April 4, 2009
For a downloadable version, click the following:
Original link for this page Original April 4, 2009
Oh, Michigan, my Michigan…oh, my goodness!
Economic Overview 2009
THE MICHIGAN ECONOMY
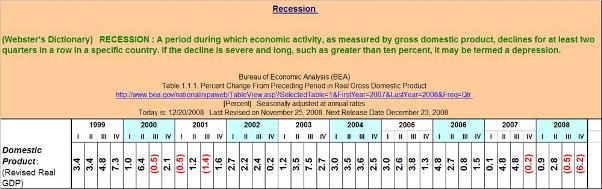
Michigan has been experiencing a structural recession since 2004 – if not earlier. Let's examine the economic facts.
Since 2000, real GDP growth for the entire U.S. averaged 2.5% as compared to Michigan alone which averaged –0.1%.
Michigan's real GDP has been trending downward since 2002. During this period, the U.S. economy has trended upward.
A similar pattern can be seen in the employment numbers. Employment in Michigan has fallen from 4.5 million in 2000 to 4.2 million in 2007.
Since the summer of 2000, the unemployment rate in Michigan has risen relative to that of the entire U.S. In December of 2008, it was 10.2 in Michigan and 7.2 for the entire U.S.
This structural recession in Michigan is the culmination of a long period of the Big Three–UAW portion of the auto industry becoming unable to compete with the newer portion of the U.S. auto industry, the transplants. I first became aware of the dilemma nearly 15 years ago.
I was a Visiting Scholar at the Federal Reserve Bank of Chicago (FED). The FED was invited to a presentation at the Delphi headquarters in Flint, Michigan. This was in the early 1990s when Delphi was still part of GM. There were nearly 300 in attendance including the media, government, unions, academia, etc.
The number two in charge at Delphi made the presentation. To keep the story short, the focus of the presentation was that an hourly UAW production worker's total compensation per hour was $42, comprised of $18 in money wages and $24 in non–wage compensation such as retirement and health care benefits. He went on to say that if GM could outsource its Delphi production it could more than half that total compensation rate; the lights starting popping on in my brain.
I knew the traditional portion of the U.S. auto industry was in bad shape, but not that bad! Two points broke through my shocked consciousness. The first was that Delphi would be spun off from GM. The second was the reason why the GM workers were complaining about so much overtime.
The spinoff of Delphi was now obvious. The Big Three could no longer compete and were steadily losing market share to the transplants: from about 90% of the U.S. market for light vehicles in 1950, to around 60% at that time. The Big Three's share is now less than 30%. The market peaked at 17.5 million units or thereabouts and this year will come in at just above 10 million units. In very recent years it had settled at about 14–15 million units of light vehicles.
The second point was why the heavy use of overtime. It became clear as a bell. At time and one half, the $18 per hour became $27 but most non–wage benefits were capped at the straight time hours so that $24 became $6 to $8 per hour at most. Add that up and you get about $35 per hour or less than straight time total compensation. As I heard him, and made a few quick calculations in my head, a popular tune from the 60s popped into my head:
"Those were the days my friend, I thought they'd never end". Well, they have ended.
To paraphrase Winston Churchill, it was NOT "the end of the beginning," but the beginning of the end.
A year or so ago, the total labor compensation peaked at $75 per hour or $150,000 per year. Let's put that into perspective…
The median household income, as estimated by the Census Bureau, is about $50,000 currently. If we adjust the auto worker's household income for a second worker and add $25,000 for a second worker, we arrive at $175,000. Looking at the current estimates of the household income distribution of the Census Bureau that puts our auto worker's household in the top 5% of all households. "Don't cry for them Argentina." The UAW is definitely not the Ladies Garment Workers Union the early 1900s.
Labor unions are cartels. They behave much like OPEC with one exception, they rarely accept cuts in the price of labor, they choose less employment over both the short run (strike) and the long run (lower labor to output ratio). This cartel power, termed downward wage rigidity in economic theory, has been a major reason for the decline of the Big Three–UAW portion of the auto industry and of the structural recession occurring in Michigan. The other major factor in this downfall has been the bloated and excessively compensated management. Many other industries share this problem. In the three years prior to the year of the bailouts of the investment bankers like Goldman Sachs, bonuses of nearly $115 billion (yes, billion and not million) were paid to the staffs of these firms. Much of it was due to the sale of so–called structured products such as Collateralized Debt Obligations (CDOs), including mortgage backed securities that they peddled to various financial institutions such as banks and pension funds, over half of which were foreign.
Don't hold your breath waiting for the resurrection of the auto industry in Michigan. The total automotive industry will return to 14–15 million units in the near future, but much of it will come from, first currently bloated inventories, and then from factories of the transplants, mostly in the Southeastern U.S.
IS THE U.S. IN AN ECONOMIC RECESSION OR IS IT REALLY A FINANCIAL DEPRESSION?
For the entire U.S., except for a few industries such as housing and consumer durables (such as light vehicle), the economy have more strength that first appears. The historic weakness that the pessimists are shouting about, including the new Obama administration, are a bit overstated, to say the least.
The revised National Income and Product Account figures released last week by the Bureau of Economic Analysis of the U.S. Department of Commerce shows Disposable Personal Income for the fourth quarter of 2008 as growing at a real or constant dollar rate of 1.5% and the Personal Savings rate of 5.0%. That Personal Savings rate in the Flow of Funds Accounts is usually one and one half to two times that in the National Income and Product Accounts.
The real problem in the economy is in the financial sector. If it continues to fester, it can drag down the rest of the economy as it has already helped do so in the automotive, real estate, and residential construction industries.
As I have argued in the most recent issue of my Newsletter ("Financial Fiasco of 2008") and more recently at an Economic Symposium at the University of Detroit Mercy, copies of which you were provided to you, it has been bad economic policies based on bad or irrelevant theories that have caused the collapse of the U.S. economy in 2000 (not 2001). and again in 2008. The private sector of the economy has steadily improved as it has gradually become more competitive since the Second World War. There have been occasional exceptions to this gradual but profound improvement such as the recartelization of the U.S. oil industry in the 1990s due to a failure of the anti–trust authorities to enforce the existing legislation already on the books.
The FED has failed to understand the changes that have occurred in the U.S. economic landscape, as I will point shortly. This failure is due to their inability to understand that much of the inflationary bias has disappeared.
FINANCIAL MELTDOWN
These activities of investment bankers were a major cause of the current collapse of the financial services industry. As I detailed fully in my Newsletter, the "Financial Fiasco of 2008", a number of factors helped change the U.S. financial system into a powder keg waiting to blow. The re–cartelization of the U.S. oil industry in the 1990s and the FED's ill advised crunch in 2004 which assured chaos in the adjustable rate mortgage portion of the market and its rapid collapse as mortgage rates were reset, monthly payments exploded upward and massive foreclosures ensued.
While sub–prime lending was part of the problem, all segments of the adjustable rate mortgage market suffered, even prime and super prime segments. Theoretically, there is nothing wrong with adjustable rate mortgages. But when the FED becomes paranoid in respect to inflation and conducts policies of monetary restraint in the short–term end of the financial markets, as they have been doing in recent years, ARMS will be the first victim.
VULNERABLE INDUSTRIES
The most vulnerable industries in terms of potential bankruptcy are those that sell their products (goods or services) in increasingly competitive markets resulting in those same firms losing market or price power and yet are still buying productive resources in cartelistic markets such as the labor market for unionized labor. The Big Three–UAW portion of the auto industry, much of the media industry including the print as well as the electronic segments, and steel are examples of such industries. Education would be there except that over three quarters is nationalized and to that extent reliant on government funding and not tuition revenues. Health care is another but because of the huge portion of it where third party payers are dominant, competition is muted. This could change either way. Government as an increasingly dominant third party payer could alter the market power of the providers either way, depending upon the form increased government funded health care takes.
A few facts…
Spending on health care
Total spending on health care in 2007 = $2.3 trillion http://www.nchc.org/facts/cost.shtml
$1.1 trillion government expenditure (or nearly 1/2 of all health care spending is through the government).
Federal level
- Hospital and supplementary medical insurance $423.7 billion
- Military medical insurance $2.5 billion
State and Local
- Medical Care $336.6 billion
- Medicaid $323.7 billion
- Other Medical Care $12.9 billion
To say that we don't have some degree of national health insurance already is ridiculous. The problem is that the cost to take over the balance of the health care costs would be enormous, resulting in an increase in spending from $4.4 trillion in expenditures in 2007 to at least $5.6 trillion.
The 2007 tax burden as a percent of GDP in nominal dollars:
- Total expenditures at Federal, State and Local level $4,396.7 billion
- Total Nominal GDP 2007 $13,807.5 billion
- Total Tax Burden as a % of GDP = 32%
- Adding in the $1,201 billion in private spending on health care to the $4,396.7 billion in total government brings us to $5,597 billion in total government spending.
- New total tax burden as a % of GDP = 41%
That's what is really at stake…do we want the government to increase its stake in our economy in such permanent and invasive manner?
Medicare and Medicaid are already insolvent. Social Security is heading for insolvency by around 2040 (the current surplus in the trust fund will turn into a deficit around 2017–2019).
See linked file with Income, Poverty, and Health Insurance Coverage in the United States U.S. Census Bureau
http://www.census.gov/prod/2008pubs/p60–235.pdf
DECLINING INFLATIONARY BIAS AND THE NEW PARADIGM
Why didn't the U.S. economy experience serous inflation in the last few years as it experienced four years of energy price increases? In the 1970s, dramatic increases in the inflation rate occurred as a consequence of the two major oil price shocks in the 1970s?
Why has the long standing relationship between the PPI and the CPI changed dramatically in recent years?
Why did the former FED Chairman Greenspan, complain about the CONUNDRIM, referring to the longer term interest rates not rising as the FED crunched the economy with a policy of monetary restraint, thus causing short–term interest rates to rise and the yield curve to invert?
The reasons are explained at length in my Newsletter issue, "Cartelistic Free Market Capitalism vs. Competitive Free Market Capitalism", also provided to you. A gradual but nonetheless profound change has occurred in the economic landscape of the U.S. economy. The gradually evolving landscape makes increasingly irrelevant some of the old and once relevant theories, for example, Monetarism and the inflationary gap theory of the Keynesian type models. Unfortunately, policy makers at the FED and in Congress are time bound and have by and large failed to see this New Paradigm develop. Hence policies based upon how the economy used to work lead to ill advised policies for the economy today. The short but dramatic collapse of the U.S. economy in the first three quarters of 2000 was caused by bad economic policies, both of the monetary and fiscal policy varieties.
The recent collapse in 2008 resulted from number of factors within the financial system creating what I have referred to as a powder keg ready to blow and two detonators, so to speak, bad anti–trust policy in the 1990s and bad monetary policy beginning in 2004.
The so–called fiscal stimulus bills passed last year and this year does little to point out the real problems and do nothing to remedy the situation. Believe me: the financial volcano can blow again in the near future.
A few pieces of good news…while the unemployment is spiking, the overall unemployment rate for 2008 was not all that high.
PERSONAL INCOME AND OUTLAYS: JANUARY 2009
http://bea.gov/newsreleases/national/pi/2009/pdf/pi0109.pdf
Personal outlays and personal saving
Personal outlays –– PCE, personal interest payments, and personal current transfer payments increased $54.5 billion in January, in contrast to a decrease of $103.5 billion in December.
PCE increased $56.4 billion, in contrast to a decrease of $101.2 billion.
Personal saving –– DPI less personal outlays –– was $545.5 billion in January, compared with $416.8 billion in December. Personal saving as a percentage of disposable personal income was 5.0 percent in January, compared with 3.9 percent in December. For a comparison of personal saving in BEA's national income and product accounts with personal saving in the Federal Reserve Board's flow of funds accounts and data on changes in net worth, which help finance consumption, go to www.bea.gov/national/nipaweb/Nipa–Frb.asp.
Real DPI and real PCE
Real DPI –– DPI adjusted to remove price changes –– increased 1.5 percent in January, compared with an increase of 0.4 percent in December.