
2011 Volume Issue 10
December 5, 2011
For a downloadable version, click the following:
Lies, Damned lies, and Statistics pdf
Lies, Damned lies, and Statistics
…etched on Hadrian's Wall by a frustrated and anonymous Roman Centurion (speculative)…also attributed to the likes of Benjamin Disraeli, British Prime Minister, Mark Twain, and Harry S Truman, president of U.S. of A.
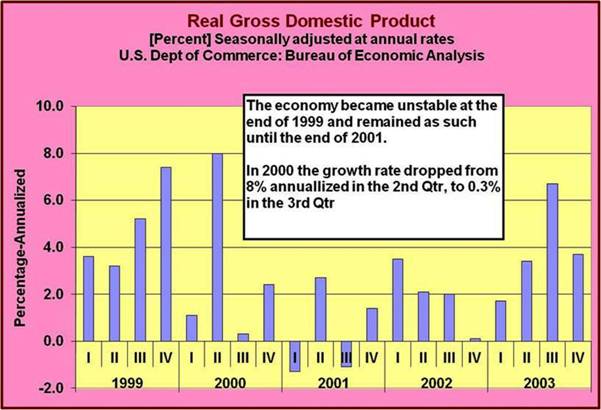
In the most recent employment report by the BLS, it appears that the employment and unemployment pictures have appreciably improved. That is NOT the case when the details are examined. Since the peak of economic activity under the Clinton Administration when the participation rate averaged 67.1% (from April 1996 through March 2001), that rate has been trending downward. The very large build up of federal government tax revenues as a result of significant tax increases during the Rubinomics period of Clinton's second term, led to a sharp collapse in GDP during 2000, President Clinton's last year. This decline in the participation rates has biased downward the calculation in arriving at the unemployment rates.
Economic Newsletter for the New Millennium
August 11, 2011
econnewsletter.com/aug112011.html
Clinton Tax Hike
When Clinton became President in 1993, he inherited an annual federal deficit of $290 billion (1992) and a U-3 unemployment rate of 7.5% (1992). In 1995, he appointed Robert Rubin as Secretary of the Treasury (en.wikipedia.org/wiki/Rubinomics). He and President Clinton lobbied Congress to dedicate the higher taxes legislated in 1993 toward reducing the federal deficit and they agreed with him.
THE STEADY DECLINE IN THE PARTICIPATION RATE AS THE JOBS OUTLOOK DARKENED
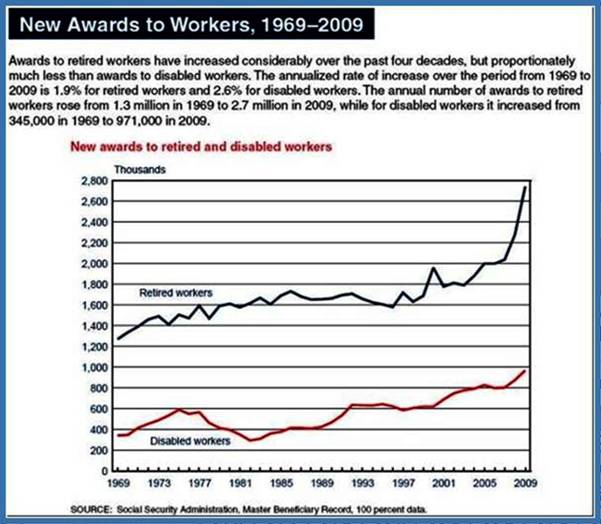
The major cause of this decline in the participation rate has been the discouraged worker effect exacerbated by an unprecedented duration of unemployment. Spikes in the early retirement rate and the permanent disability rate have also added to this decline.
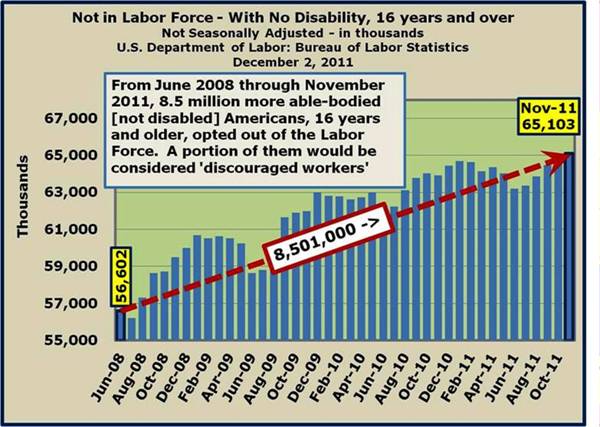
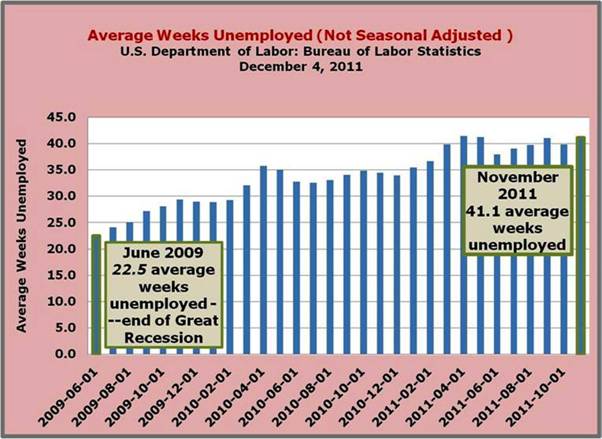
Examples of reduction in the Labor Force
How are the participation rate and the various elements of the unemployment rate determined along with the definition of the terms used in arriving at these various rates?
The following are various measures used in determining employment statistics as used by the U.S. Department of Labor, Bureau of Labor Statistics (Current Population Survey)
www.bls.gov/lau/rdscnp16.htm#defs
Civilian Non-institutional Population
The civilian non-institutional population consists of persons 16 years of age and older residing in the 50 States and the District of Columbia who are not inmates of institutions (for example, penal and mental facilities and homes for the aged) and who are not on active duty in the Armed Forces.
Employment
Employment consists of all persons who, during the reference week (the calendar week including the twelfth day of the month), (a) did any work at all (at least 1 hour) as paid employees, worked in their own business or profession or on their own farm, or worked 15 hours or more as unpaid workers in an enterprise operated by a member of the family, or (b) were not working but had jobs or businesses from which they were temporarily absent because of vacation, illness, bad weather, childcare problems, maternity or paternity leave, labor-management dispute, job training, or other family or personal reasons, whether or not they were paid for the time off or were seeking other jobs.
Unemployment
Unemployment consists of all persons who had no employment during the reference week, were available for work, except for temporary illness, and had made specific efforts to find employment some time during the 4-week period ending with the reference week. Persons who were waiting to be recalled to a job from which they had been laid off need not have been looking for work to be classified as unemployed.
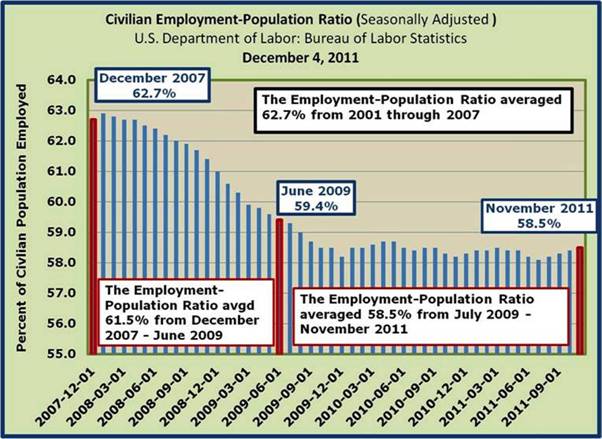
Employment-Population Ratio
Employment-population ratio is the proportion of the civilian noninstitutional population aged 16 years and over that is employed.
Civilian Labor Force
The civilian labor force consists of all persons classified as employed or unemployed as described above.
Labor force Participation Rate
The labor force participation rate represents the proportion of the civilian noninstitutional population that is in the labor force. This measure of labor force activity grew from about 60 percent nationally in 1970 to about 67 percent in 2000, with much of the increase resulting from increased participation by women.
Unemployment Rate
The unemployment rate is the number of unemployed as a percent of the civilian labor force. Unemployment rates move inversely with the business cycle, sometimes with a lag.
U-3 (Official Unemployment Rate)
U-3 Total unemployed, as a percent of the civilian labor force (official unemployment rate)
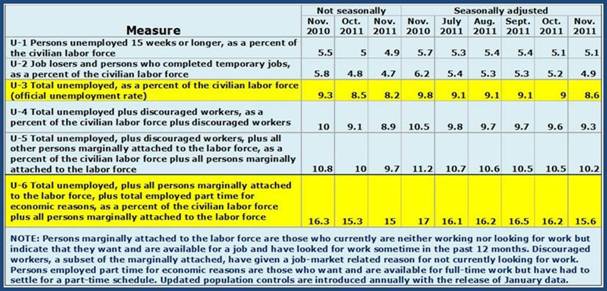
U-6 (Alternative – [more precise/complex] unemployment rate)
U-6 Total unemployed, plus all persons marginally attached to the labor force, plus total employed part time for economic reasons, as a percent of the civilian labor force plus all persons marginally attached to the labor force
Various measures of unemployment rate
www.bls.gov/news.release/empsit.t15.htm
…an alternative to the U-3 and U-6 measurements --- adjusting for a more realistic Labor Force Participation Rate
Participation rate adjustment for U-3 and U-6 Unemployment Rates
From April 1996 through March 2001, the average Labor Force Participation Rate was 67.1%. In our presentation, we adjusted the reported rates to reflect the 67.1% to identify the discouraged workers who have entirely given up any hope of gaining employment. When you experience lengthy bouts of unemployment, the discouraged worker effect is amplified, beyond even the normal levels when shorter term unemployment cycles occur.
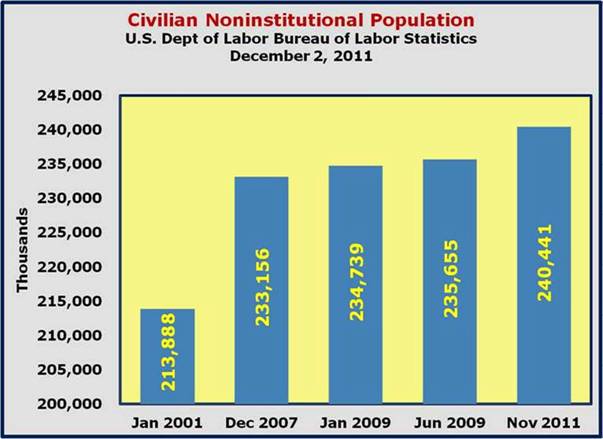
CIVILIAN NONINSTITUTIONAL POPULATION
Since January 2001, the Civilian Noninstitutional Population [those 16 and older, not in the military or in institutions (for example, penal and mental facilities, homes for the aged)] has grown by around 200,000 per month.
CIVILIAN NONINSTITUTIONAL POPULATION
- January 2001 = 213,888,000
- November 2011 = 240,441,000
- Difference = 26,553,000 / 131 months = 204,000 / month
During the Great Recession – 19 months
- December 2007 = 233,156,000
- June 2009 = 235,655,000
- Difference = 2,499,000 / 19 months = 131,526 / month
During Bush Presidency – 97 months (actually 96 months, added January 2009)
- January 2001 = 213,888,000
- January 2009 = 234,739,000
- Difference = 20,851,000 / 97 months = 214,959 / month
During Obama Presidency – 35 months
- January 2009 = 234,739,000
- November 2011 = 240,441,000
- Difference = 5,702,000 / 35 months = 162,914 / month
End of the Recession (June 2009) to November 2011 – 30 months
- June 2009 = 235,655,000
- November 2011 = 240,441,000
- Difference = 4,786,000 / 30 months = 159,533 / month
Clearly, the decline in the labor force participation was a result of the slower rate of economic activity and since it is the denominator of the calculation of the unemployment rate, that rate was biased downward and not a realistic measure of the unemployment rate picture and hence the need for an adjustment.
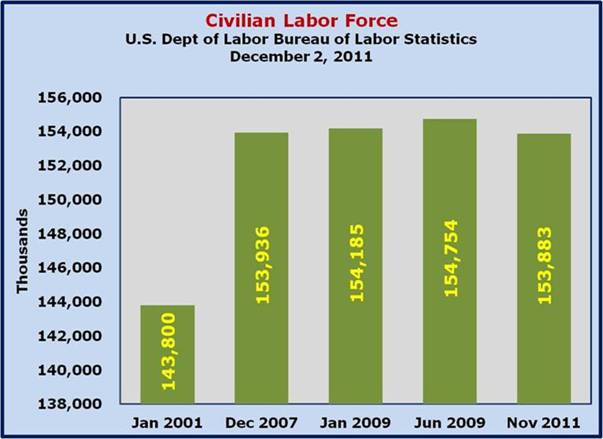
LABOR FORCE
Since January 2001, the Labor Force (a subset of the Civilian Noninstitutional Population, labeled as employed or unemployed) has only grown by around 77,000 per month.
LABOR FORCE
- January 2001 = 143,800,000
- November 2011 = 153,883,000
- Difference = 10,083,000 / 131 months = 77,000/month
During the Great Recession – 19 months
- December 2007 = 153,936,000
- June 2009 = 154,754,000
- Difference = 818,000 / 19 months = 43,053 / month
During Bush Presidency – 97 months (actually 96 months, added January 2009)
- January 2001 = 143,800,000
- January 2009 = 154,185,000
- Difference = 20,851,000 / 97 months = 107,062 / month
During Obama Presidency – 35 months
- January 2009 = 154,185,000
- November 2011 = 153,883,000
- Difference = (302,000) / 35 months = (8,629) / month
End of the Recession (June 2009) to November 2011 – 30 months
- June 2009 = 154,754,000
- November 2011 = 153,883,000
- Difference = (871,000) / 30 months = (29,033) / month
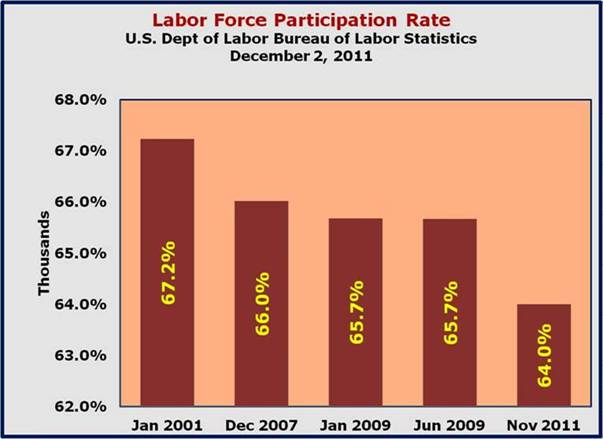
Labor Force Participation Rate
From January 2001 through November 2011, the Labor Force Participation Rate (The Labor Force as a percent of the Civilian Noninstitutional Population) grew by around 56,000 per month.
Labor Force Participation Rate
- January 2001 = 67.2%
- November 2011 = 64.0%
- Difference = -3.2%
During the Great Recession – 19 months
- December 2007 = 66.0%
- June 2009 = 65.7%
- Difference = -0.3%
During Bush Presidency – 97 months (actually 96 months, added January 2009)
- January 2001 = 67.2%
- January 2009 = 65.7%
- Difference = -1.5%
During Obama Presidency – 35 months
- January 2009 = 65.7%
- November 2011 = 64.0%
- Difference = -1.7%
End of the Recession (June 2009) to November 2011 – 30 months
- June 2009 = 65.7%
- November 2011 = 64.0%
- Difference = -1.7%
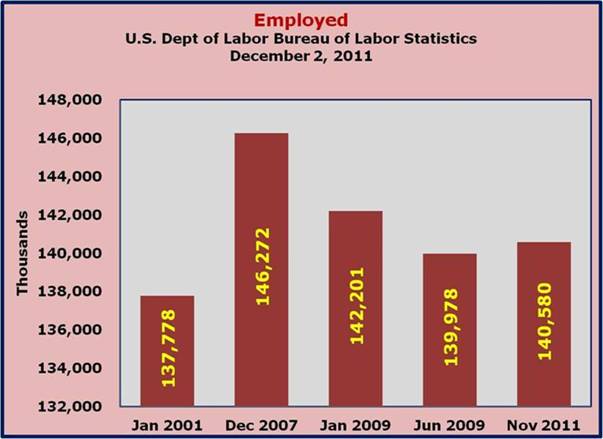
Employed
From January 2001 through November 2011, the Employed Persons (a subset of the Labor Force) grew by around 21,000 per month.
Employed
- January 2001 = 137,778,000
- November 2011 = 140,580,000
- Difference = 2,802,000 / 131 months = 21,389 / month
During the Great Recession – 19 months
- December 2007 = 146,272,000
- June 2009 = 139,978,000
- Difference = (6,294,000) / 19 months = (331,263) / month
During Bush Presidency – 97 months (actually 96 months, added January 2009)
- January 2001 = 137,778,000
- January 2009 = 142,201,000
- Difference = 4,423,000 / 97 months = 45,598 / month
During Obama Presidency – 35 months
- January 2009 = 142,201,000
- November 2011 = 140,580,000
- Difference = (1,621,000) / 35 months = (46,314) / month
End of the Recession (June 2009) to November 2011 – 30 months
- June 2009 = 139,978,000
- November 2011 = 140,580,000
- Difference = 602,000 / 30 months = 20,067 / month
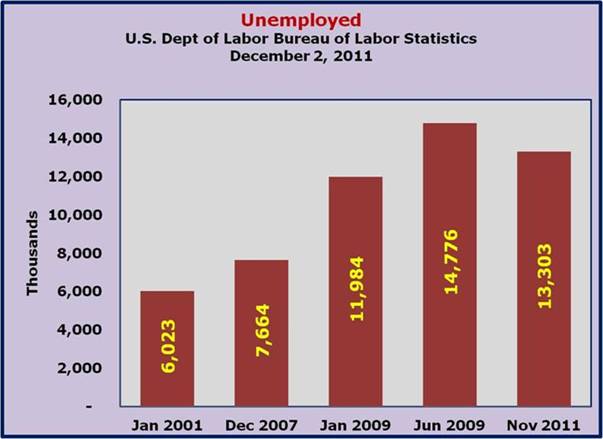
Unemployed
From January 2001 through November 2011, the Unemployed Persons (a subset of the Labor Force) grew by around 56,000 per month.
Unemployed
- January 2001 = 6,023,000
- November 2011 = 13,303,000
- Difference = 7,280,000 / 131 months = 55,573 / month
During the Great Recession – 19 months
- December 2007 = 7,664,000
- June 2009 = 14,776,000
- Difference = 7,112,000 / 19 months = 374,316 / month
During Bush Presidency – 97 months (actually 96 months, added January 2009)
- January 2001 = 6,023,000
- January 2009 = 7,664,000
- Difference = 1,641,000 / 97 months = 16,918 / month
During Obama Presidency – 35 months
- January 2009 = 11,984,000
- November 2011 = 13,303,000
- Difference = 1,319,000 / 35 months = 37,686 / month
End of the Recession (June 2009) to November 2011 – 30 months
- June 2009 = 14,776,000
- November 2011 = 13,303,000
- Difference = (1,473,000) / 30 months = (49,100) / month
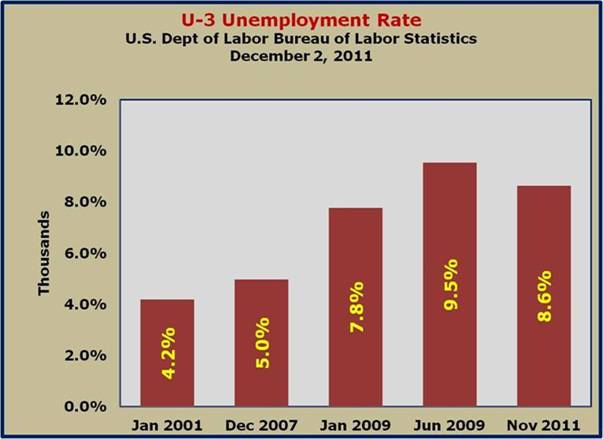
Unemployment Rate (U-3) Official
From January 2001 through November 2011, the Unemployment Rate (unemployed as a percent of the labor force.) went from 4.2 to 8.6%.
Unemployment Rate (U-3) Official
- January 2001 = 4.2%
- November 2011 = 8.6%
- Difference = 4.4%
During the Great Recession – 19 months
- December 2007 = 5.0%
- June 2009 = 9.5%
- Difference = 4.5%
During Bush Presidency – 97 months (actually 96 months, added January 2009)
- January 2001 = 4.2%
- January 2009 = 7.8%
- Difference = 3.6%
During Obama Presidency – 35 months
- January 2009 = 7.8%
- November 2011 = 8.6%
- Difference = 0.8%
End of the Recession (June 2009) to November 2011 – 30 months
- June 2009 = 9.5%
- November 2011 = 8.6%
- Difference = -0.9%
Adjusting to reflect Labor Force Participation Rate of 67.1%
Note: from April 1996 – March 2001, the average Labor Force Participation Rate was 67.1%)
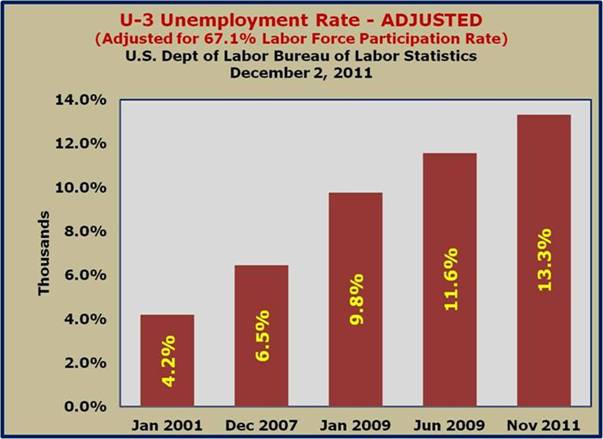
Unemployment Rate (U-3) Official – again, adjusting to reflect Labor Force Participation Rate of 67.1%
From January 2001 through November 2011, the adjusted Unemployment Rate (unemployed as a percent of the labor force.) went from 4.2 to 13.3%.
Adjusted U-3 Unemployment Rate
- January 2001 = 4.2%
- November 2011 = 13.3%
- Difference = 9.1%
During the Great Recession – 19 months
- December 2007 = 6.5%
- June 2009 = 11.6%
- Difference = 5.1%
During Bush Presidency – 97 months (actually 96 months, added January 2009)
- January 2001 = 4.2%
- January 2009 = 9.8%
- Difference = 5.6%
During Obama Presidency – 35 months
- January 2009 = 9.8%
- November 2011 = 13.3%
- Difference = 3.5%
End of the Recession (June 2009) to November 2011 – 30 months
- June 2009 = 11.6%
- November 2011 = 13.3%
- Difference = 1.7%
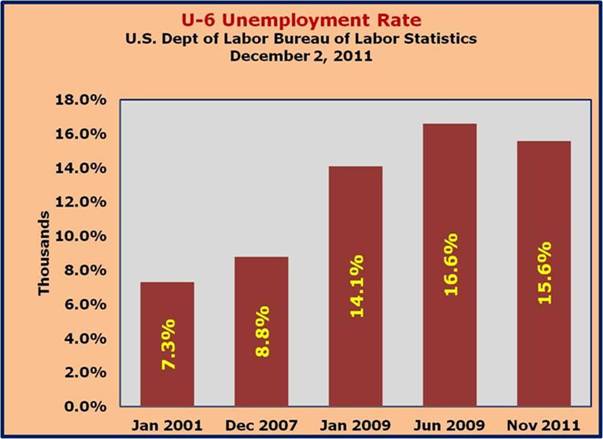
Unemployment Rate (U-6) Official
From January 2001 through November 2011, the U-6 Unemployment Rate (Alternative measures of labor underutilization = Total unemployed, plus all persons marginally attached to the labor force, plus total employed part time for economic reasons, as a percent of the civilian labor force plus all persons marginally attached to the labor force) went from 7.3 to 15.6%.
Unemployment Rate (U-6) Official
- January 2001 = 7.3%
- November 2011 = 15.6%
- Difference = 8.3%
During the Great Recession – 19 months
- December 2007 = 8.8%
- June 2009 = 16.6%
- Difference = 7.8%
During Bush Presidency – 97 months (actually 96 months, added January 2009)
- January 2001 = 7.3%
- January 2009 = 14.1%
- Difference = 6.8%
During Obama Presidency – 35 months
- January 2009 = 14.1%
- November 2011 = 15.6%
- Difference = 1.5%
End of the Recession (June 2009) to November 2011 – 30 months
- June 2009 = 16.6%
- November 2011 = 15.6%
- Difference = -1.0%
Adjusting to reflect Labor Force Participation Rate of 67.1%
Note: from April 1996 – March 2001, the average Labor Force Participation Rate was 67.1%)
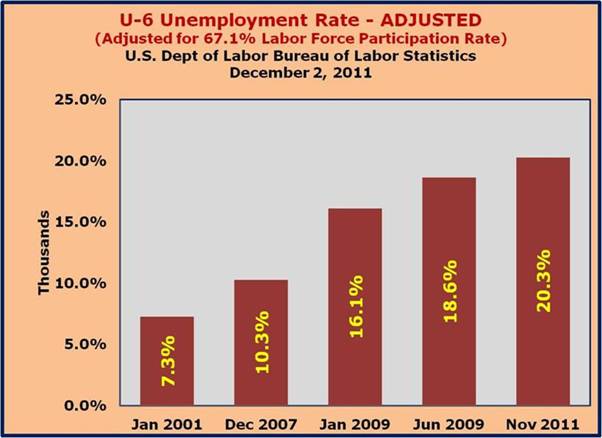
Unemployment Rate (U-6) Alternative measures of labor underutilization – again, adjusting to reflect Labor Force Participation Rate of 67.1%
From January 2001 through November 2011, the adjusted U-6 Unemployment Rate (Alternative measures of labor underutilization = Total unemployed, plus all persons marginally attached to the labor force, plus total employed part time for economic reasons, as a percent of the civilian labor force plus all persons marginally attached to the labor force) went from 7.3 to 20.6%.
Adjusted U-6 Unemployment Rate
- January 2001 = 7.3%
- November 2011 = 20.3%
- Difference = 13.0%
During the Great Recession – 19 months
- December 2007 = 10.3%
- June 2009 = 18.6%
- Difference = 8.3%
During Bush Presidency – 97 months (actually 96 months, included January 2009)
- January 2001 = 7.3%
- January 2009 = 16.1%
- Difference = 8.8%
During Obama Presidency – 35 months
- January 2009 = 16.1%
- November 2011 = 20.3%
- Difference = 4.2%
End of the Recession (June 2009) to November 2011 – 30 months
- June 2009 = 18.6%
- November 2011 = 20.3%
- Difference = 1.7%
…again, the employment-population ratio is the proportion of the civilian noninstitutional population aged 16 years and over that is employed. It further illustrates how extensive the employment problem really is.
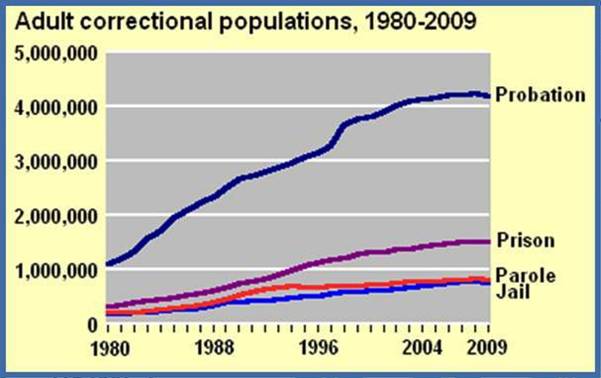
One last example of shrinkage in the Civilian Noninstitutional Population
U.S. Department of Justice - In 2009, over 7.2 million people were under some form of correctional supervision.
Source: Bureau of Justice Statistics Correctional Surveys (The Annual Probation Survey, National Prisoner Statistics Program, Annual Survey of Jails, and Annual Parole Survey)
bjs.ojp.usdoj.gov/content/glance/corr2.cfm
More to follow…
