2011 Volume Issue 4
June 8, 2011
For a downloadable version, click the following:
THE BALLAD OF ALAN GREENSPAN: TO DREAM THE IMPOSSIBLE DREAM
MISSION ACCOMPLISHED; REDUCE HOUSEHOLD NET WORTH PRIMARILY THROUGH COLLAPSING REAL ESTATE VALUES BY $7 TRILLION, THUS NEUTRALIZING THE WEALTH EFFECT AND ENDING IRRATIONAL EXUBERANCE.
Again harkening back to Greenspan in 2005: he was the one who was concerned about irrational exuberance (a persistent increase in household spending caused by a large rise in household new worth, the so-called wealth effect.) In his estimation, the market-price of household assets (primarily homes) was growing too rapidly. The FED’s solution was to use its power to drive up short term interest rates.
Shortly after Greenspan’s clarion call, the FOMC (Federal Open Market Committee) enacted a policy of monetary constraint manifested in persistently rising short term interest rates.
Much to the chagrin of Alan, in his mind, a 'conundrum' developed. The rise in short term interest rate didn't flow through to the longer end of the market. The yield curve began to flatten and at times it became inverted. Absent intervention in the longer term segments of the financial market, the expectations of market participants determined those interest rates. See an earlier article on this website explaining the expectations theory of the term structure of interest, the graph of which is the yield curve.
Excessive Subprime Lending; or Misguided Monetary Policy – A Reasoned Critique
In Greenspan’s own words,
Our forecasts and hence policy are becoming increasingly driven by asset price changes. The steep rise in the ratio of household net worth to disposable income in the mid-1990s, after a half-century of stability, is a case in point. Although the ratio fell with the collapse of equity prices in 2000, it has rebounded noticeably over the past couple of years, reflecting the rise in the prices of equities and houses.
Remarks by Chairman Alan Greenspan
Reflections on central banking
At a symposium sponsored by the Federal Reserve Bank of Kansas City, Jackson Hole, Wyoming
August 26, 2005
www.federalreserve.gov/Boarddocs/Speeches
This scenario by Greenspan can be seen played out pictorially in the preceding chart and more so in the following charts. But before we delve into them, we need to pause and consider some disturbing elements upon the principles that seem to drive government policy making.
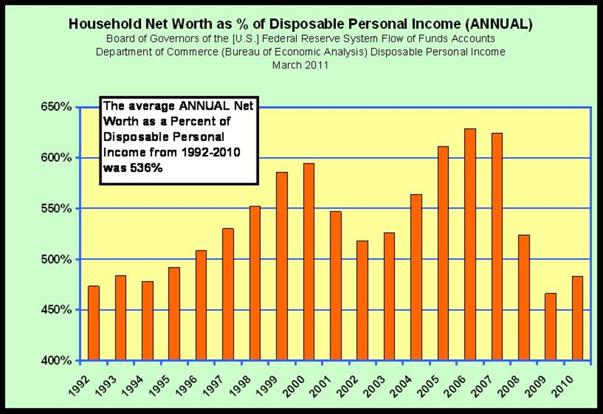
The concern voiced by Dr. Greenspan and other Federal Reserve (FED) officials was based upon “a half-century of stability” in the ratio of household net worth to household disposable income. It was not made clear whether this was a good thing or some aspect of economic stagnation. Does a smaller ratio such as we are now experiencing present a good or bad situation? Does this more “normal” 490% 50-year average ratio of Household Net Worth to Disposable Personal Income promise stability or ensure economic growth?
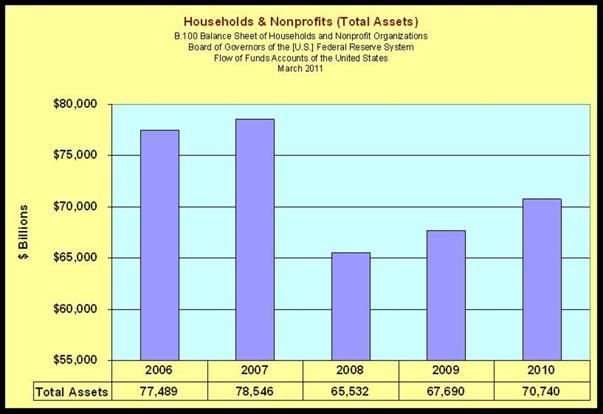
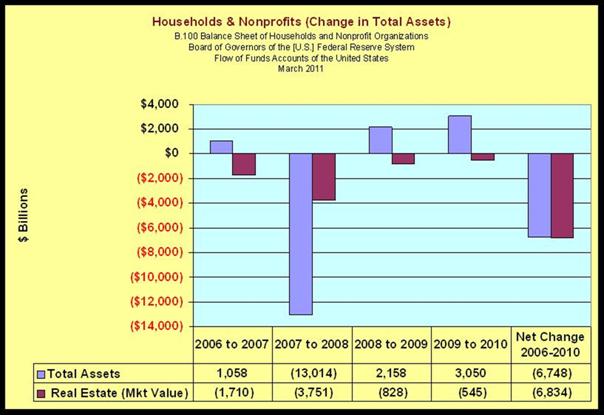
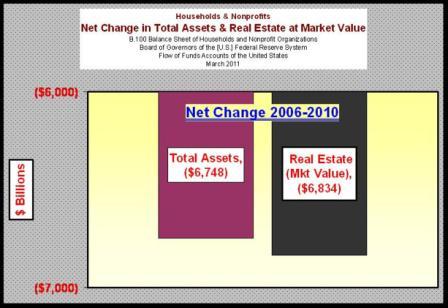
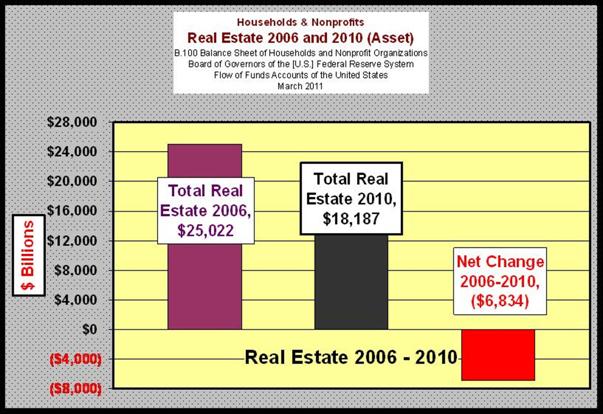
The net result is that from 2006 to 2010 there was a fall-off in Total Assets of $6.7 trillion, more than 100% of this fall in assets was in the collapse in the price of real estate by $6.8 trillion.
A parallel can be drawn from the debate over global warming. It is now certain that our solar system was experiencing a solar minimum during the time period from around 1350 A.D. to around 1850 A.D. (some place it as early as 1150 A.D.). (en.wikipedia.org/wiki/Little_Ice_Age)
As a consequence, the average temperatures were higher before and after that period including the more recent years. The five hundred year period is often referred to as a little ice age by some. Many historical occurrences are attributed to this period of global cooling including: the Stradivarius violin; the switch from wine to beer in northern Europe; the French Revolution partly resulting from weather caused famine in France; the now unheard of ice-jammed Delaware River, which Washington crossed on Christmas 1776; the year without summer in 1816 (en.wikipedia.org/wiki/Year_Without_a_Summer), which brought us Mary Shelley’s Frankenstein, etc.
500 years may be a drop in the bucket in geological time, but it is a very long time period in human experience. That is ten times longer than the Greenspan cited duration of the stability of the ratio of net worth to disposable income of households.
Are higher temperatures experienced since the 500 year long solar minimum simply a rebound to more normal temperatures or are they a mankind-induced beginning of an eventual mass extinction of mankind from the buildup of greenhouse gases?
How dare we ask such a question!
Mr. Gore and Dr. Greenspan seem to be using similar arguments to prove their points. We find neither overwhelmingly logical in their current forms.
What is normal, and what is best for our human condition is not always clear.
Also, given the track records of the policies the Federal Reserve has introduced, if Greenspan’s assumptions are correct, can the FED solve the problem with the tools currently available?
Controlling changes in the solar output of energy is really far beyond our technological abilities, if indeed that is the cause of temperature fluctuations. Given the last forty or so years of FED monetary policies, there appears to be plenty of ammunition for the argument that failures spawned by government intervention through monetary and fiscal policies do greater harm than those occurrences caused by market failures.
The Federal Reserve’s policy begs several questions that are worth thinking about.
How is the current economic situation normal or somehow a better situation than 2005?
Consider the very high and persistent unemployment situation (U-3 and U-6) exacerbated further by the significant rise in permanent disability and early retirements, etc.
If the problem was evident for some time, as intimated by Greenspan, why didn't the FED use its enormous power to nip the so-called real estate bubble before is grew so large?
Why was real estate apparently targeted for the hit when financial assets for example, account for so much more of the pie?
As we’ve noted on several occasions, the rising interest rates, prompted by the FOMC policy-making, caused adjustable rate mortgages to rise, beginning in June 2004 at 1.00% and continuing through June 2006 at 5.25%, where the Fed Funds Targeted Rate remained until the fall of 2007.
(The Financial Fiasco of Two-Thousand Eight (FFTTE))
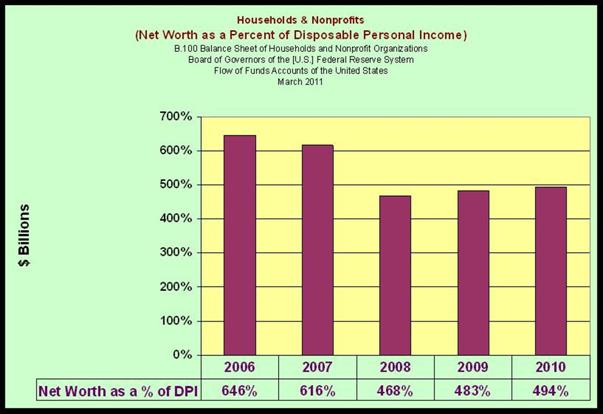
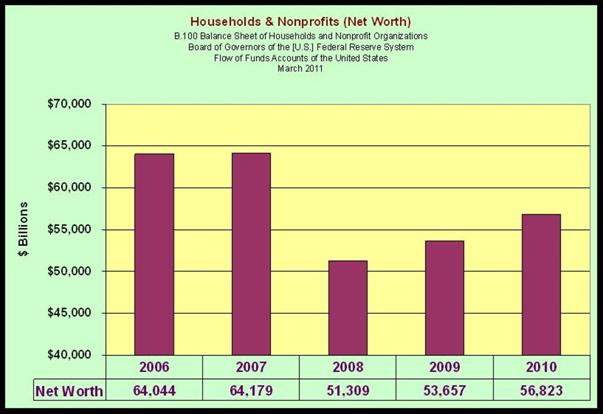
Moving from a high of 646% in 2006 to 494% in 2010, Net Worth – the numerator, declined from $62.35 trillion, to $54.95 trillion or a $7.4 trillion drop. Disposable Personal Income, on the other hand, increased from $9.65 trillion to $11.113 trillion.
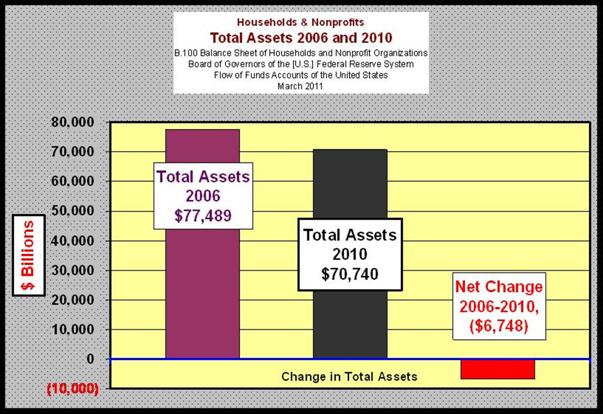
More than 100% of the drop in Total Assets from 2006 through 2010 can be tracked to falling Real Estate prices.
The rest of Total Assets include: Software and Equipment; Durable Consumer Goods; and Financial Assets (with Financial Assets representing the largest share).
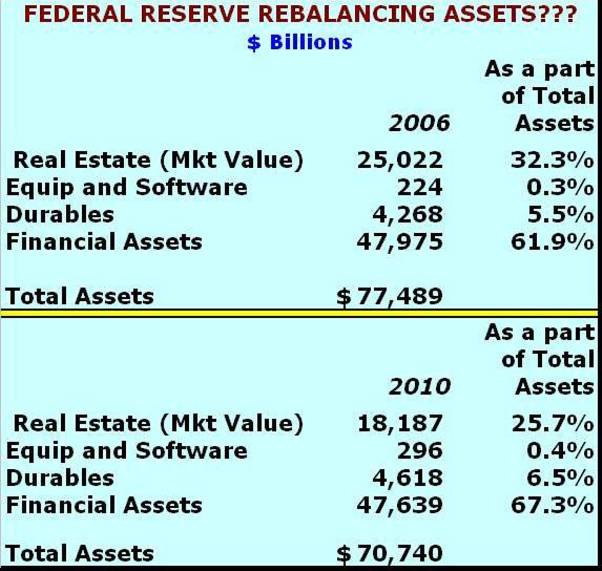
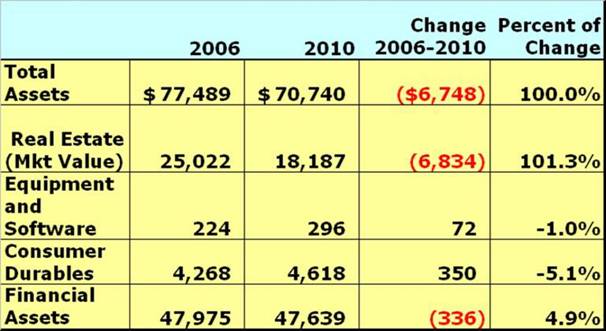
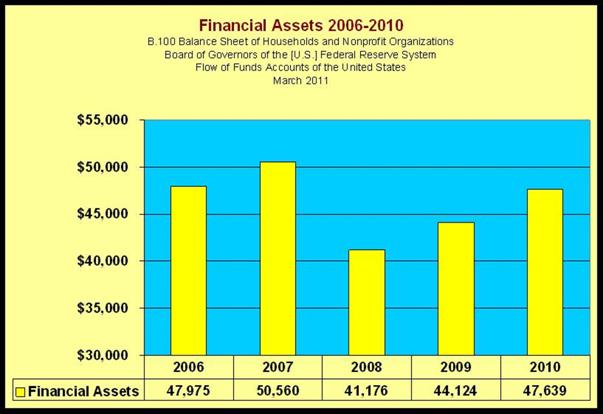
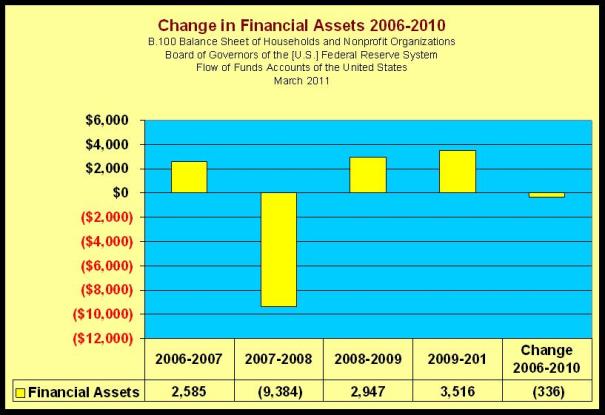
The high-water mark for Financial Assets was 2007 at $50.56 trillion falling off to $41.18 trillion in 2008, or $9.4 trillion. While the Financial Asset portion of the Household’s portfolio has basically moved back to its 2006 level, it is still well below 2008.
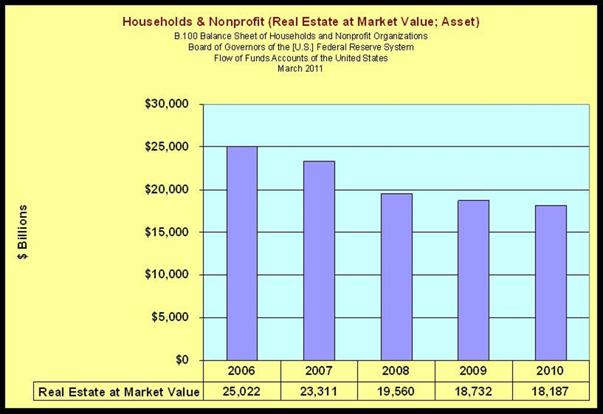
Continuing to use 2006 as the baseline for measuring asset levels, Real Estate fell from $25.0 trillion in 2006 to $18.2 trillion in 2010 for a loss of $6.8 trillion in asset value.
On a further note, most Americans are also concerned with their equity position in their homes.
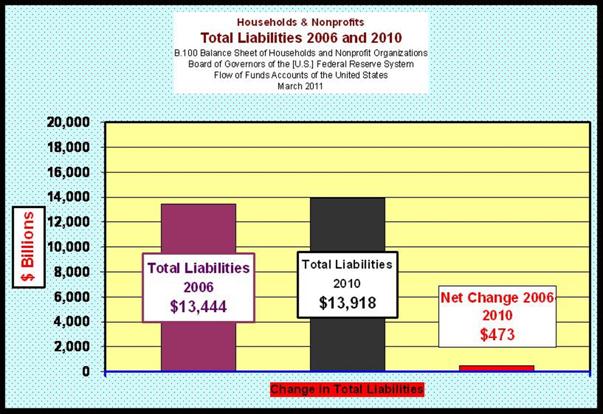
Looking at the change between 2006 and 2010
With the fall-off in the value of their assets (Real Estate) and the small rise in liabilities (Home Mortgage), their equity (Net Worth) position has declined significantly; moving from a 57% stake in 2006 to a 39% stake in 2010.
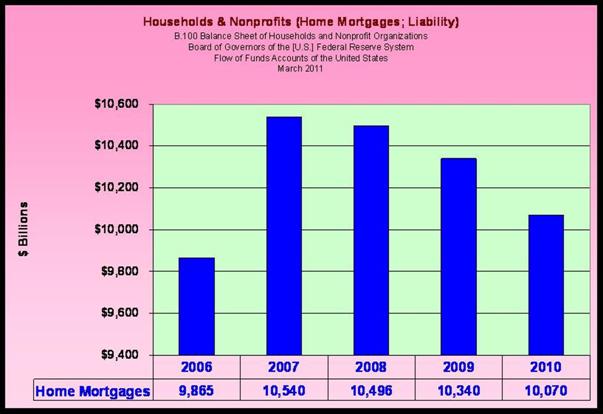
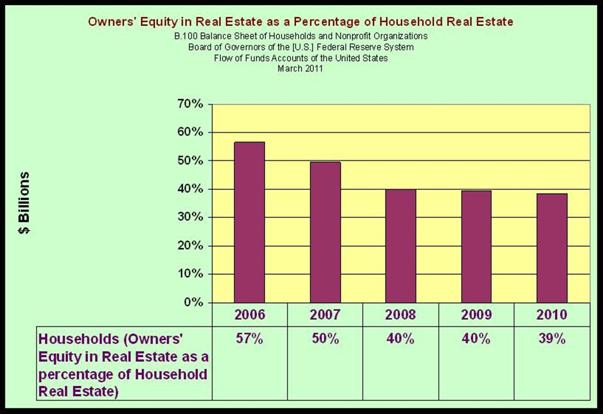
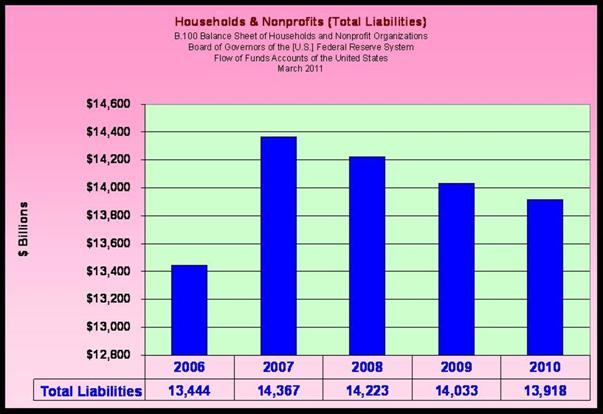
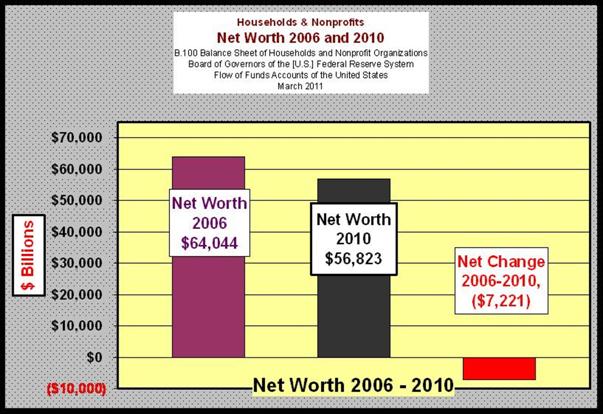
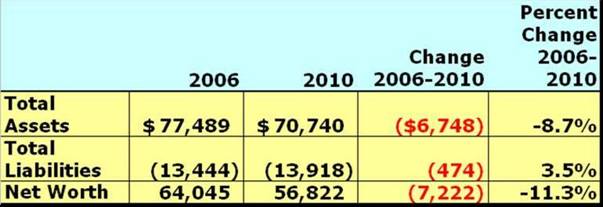
Again, keeping the Accounting Formula in mind where Assets – Liabilities = Net Worth (Owner’s Equity). The bottom line here is that between 2006 and 2010, Households experienced significant pain: Assets declined by $6.7 trillion; Liabilities increased by $0.50 trillion; leaving Net Worth to fall by a total of $7.2 trillion, or 11.3%.