2011 Volume Issue 5
June 11, 2011
For a downloadable version, click the following:
DIGGING DEEPER INTO THE DETAILS OF THE DAUNTING JUNGLE OF UNEMPLOYMENT STATISTICS
…yes, as the adage goes, the Devil is in the detail and the music plays on as the ship sinks…any volunteers for the band? I already have a spot rowing one of the lifeboats
Before embarking on a journey through the aforementioned unemployment jungle…
While the included charts are to some extent self explanatory, the following points should be understood:
- The BLS has two surveys to track employment and unemployment. They are the Payroll or Establishment Survey and the Household or Population Survey. The Payroll or Establishment Survey is really a subset of the more inclusive Household or Population Survey.
Down the Rabbit Hole
www.econnewsletter.com/may102011
While the traditional Payroll Survey sector certainly added jobs, the overall employment picture, as captured in the more inclusive Household Survey, actually worsened.
Keep in mind that the Current Employment Statistics or Establishment Payroll Survey (http://bls.gov/ces/) focuses on larger, more traditional firms that report various statistics to the Department of Labor on a regular basis. Those statistics are used to track productivity, hours worked, etc, in addition to changes in employment. Many small businesses, self-employed and the like are not included in this survey.
The Current Population Survey or Household Survey (http://bls.gov/cps/) includes the entire workforce, from the self-employed through employees at large corporations.
From the Bureau of Labor Statistics
Why are there two monthly measures of employment?
The household survey and establishment survey both produce sample-based estimates of employment and both have strengths and limitations. The establishment survey employment series has a smaller margin of error on the measurement of month-to-month change than the household survey because of its much larger sample size. An over-the-month employment change of about 100,000 is statistically significant in the establishment survey, while the threshold for a statistically significant change in the household survey is about 400,000. However, the household survey has a more expansive scope than the establishment survey because it includes the self-employed, unpaid family workers, agricultural workers, and private household workers, who are excluded by the establishment survey. The household survey also provides estimates of employment for demographic groups.
- If a worker is unemployed, even if due to a recent job loss, that worker is not counted as unemployed unless he or she is looking for a job.
Down the Rabbit Hole
www.econnewsletter.com/may102011
People are classified as employed if they did any work at all as paid employees during the reference week; worked in their own business, profession, or on their own farm; or worked without pay at least 15 hours in a family business or farm. People are also counted as employed if they were temporarily absent from their jobs because of illness, bad weather, vacation, labor-management disputes, or personal reasons.
Even though a person is in the Civilian Non-institutional Population, If they are not working and are not seeking employment, they are not considered to be part of the labor force. As this phenomenon occurs and widens, we encounter what is called the discouraged worker effect, where the Labor Force Participation Rate (the Labor Force as a percent of the Civilian Noninstitutional Population) decreases.
If they begin to look for work and are surveyed, they move back into the Labor Force and counted as Unemployed. This phenomenon is usually referred to as the Encouraged Worker Effect. This necessarily causes the labor force participation rate to increase. Typically, the Discouraged Worker Effect occurs at the beginning of an economic downturn and causes an understatement of the severity of the downturn and is replaced by an Encouraged Worker Effect with an economic upturn, thus understating the strength of the upturn. The longer the economy bumps along the bottom as it is doing now, at best; these relationships just described become less reliable.
- The U.S. economy has been experiencing significant increases in early retirements and claimants being granting permanent disability status. We here at the New Economic Paradigm Associates have coined the term “Very Discouraged Workers.” These two groups also reduce the labor force participation rate and obscure the seriousness of the unemployment problem.
www.econnewsletter.com/feb062011
www.ssa.gov/policy/docs/statcomps
All Social Security disabled beneficiaries in current-payment status, December 1970–2009
The number of disabled workers grew steadily until 1978, declined slightly until 1983, started to increase again in 1984, and began to increase more rapidly beginning in 1990. The growth in the 1980s and 1990s was the result of demographic changes, a recession, and legislative changes. The number of disabled adult children has grown slightly, and the number of disabled widow(er)s has remained fairly level. In December 2009, about 7.8 million disabled workers, just under 921,000 disabled adult children, and over 236,000 disabled widow(er)s received disability benefits.
…on to the current story
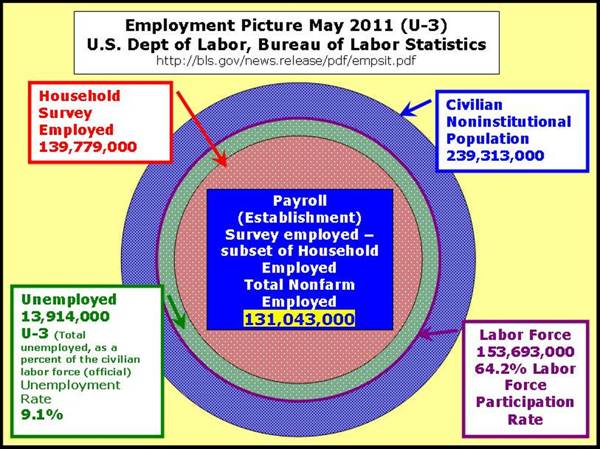
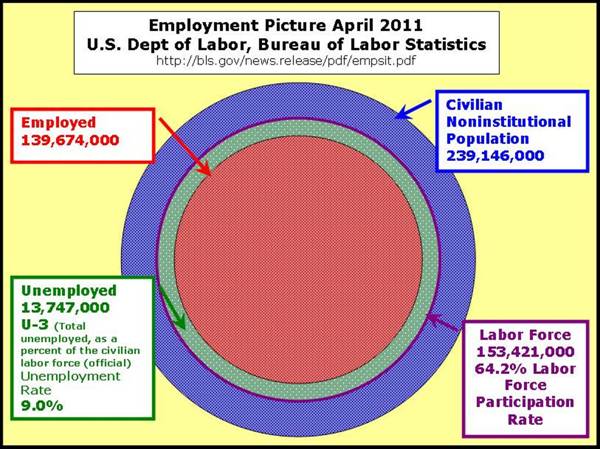
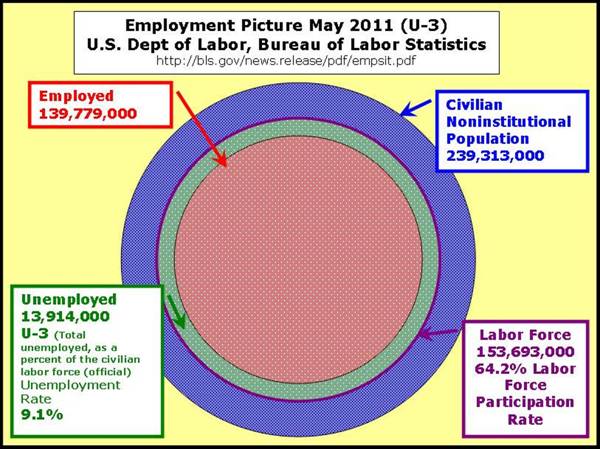
May 2011 Employment Picture
bls.gov/news.release/pdf/empsit.pdf
Nonfarm payroll employment changed little (+54,000) in May, and the unemployment rate was essentially unchanged at 9.1 percent, the U.S. Bureau of Labor Statistics reported today. Job gains continued in professional and business services, health care, and mining. Employment levels in other major private-sector industries were little changed, and local government employment continued to decline.
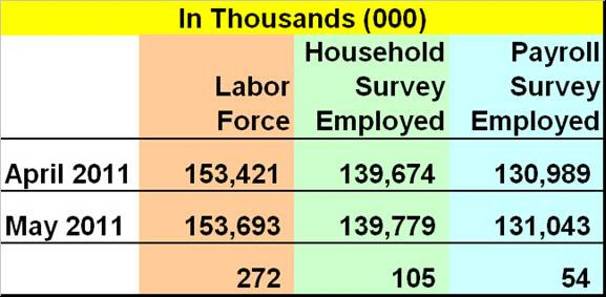
While employment, or more specifically, payroll employment rose by 54,000, and the overall employment grew by 105,000 in the more inclusive household survey, unemployment actually rose due to a much higher 272,000 increase in the Labor Force. These additional 167,000 jobseekers (so-called encouraged workers) brought about a 0.1% hike in the unemployment rate to 9.1% over last month.
Monthly change…
- Labor Force = unemployed + employed
- Labor Force = 167,000 + 105,000
- Labor Force = 272,000
The number of unemployed persons (13.9 million) and the unemployment rate (9.1 percent) were essentially unchanged in May. The labor force, at 153.7 million, was little changed over the month.
The question then is, if the unemployed persons…changed little in April, and payroll employment rose by 54,000, how then did unemployment rise by 167,000?
Simply put, it means that the ranks of the unemployed actually swelled by 272,000, due to an increase in encouraged workers – those individuals who were once discouraged workers but are now looking for work again. That number was mitigated somewhat by a 105,000 gain in jobs in the Household Survey (including 54,000 from the Payroll Survey) but just the same resulted in an unemployment increase of 167,000.
Again, those 167,000 added to the unemployed, i.e., discouraged workers, who have become encouraged enough to begin looking for jobs once more. They are now counted as being in the Labor Force, but since they cannot find work (and are seeking employment), they are also counted as unemployed.
The 167,000 (unemployed) included:
- A 167,000 increase in unemployment; more specifically, a 221,000 increase in unemployment in the non-payroll portion of the Household Survey, offset by job growth of 54,000 in the Payroll Survey.
- The 272,000 added to the Civilian Labor Force consisted of those new entrants to the Civilian Noninstitutional Population netting out to 167,000 that are not employed, but are seeking employment; hence, they represent the total unemployed.
- Note: The Civilian Noninstitutional Population includes those who are 16 years of age and older, who are not in the military or who are not institutionalized.
- 167,000 were added to the Civilian Noninstitutional Population, but many remained ‘unattached’ to the Civilian Labor Force…mostly based on the lack of available jobs.
- Unemployment Rate = [(Labor Force – Employed) / Labor Force]
- Unemployment Rate = [(153,693,000 – 139,779,000) / 153,693,000]
- Unemployment Rate = [13,914,000 / 153,693,000]
- Unemployment Rate = 9.1%
So that’s what happened between April 2011 and May 2011…
A glimpse of things to come:
- As (if) employment seekers are encouraged by any sign of improved job prospects, the Labor Force should rise (64.2 Labor Force Participation Rate is very low).
This equates with a higher unemployment rate.
- The Payroll Survey Jobs, while low, don’t seem to be continuing the bounce-back from last month
Note the ADP (the payroll service company) Survey, showed a 38,000 increase in jobs for May. While this is clearly not a perfect one-to-one substitute for the official Bureau of Labor Statistics report, it does tend to reflect a reasonable estimate. (it's typically available at the end of the month--- a week or so before the official report from the BLS (U.S. Bureau of Labor Statistics))
ADP NATIONAL EMPLOYMENT REPORT
www.adpemploymentreport.com/PDF/FINAL_Release_May_11.pdf
Again, this equates to a higher unemployment rate, since the Payroll Survey jobs are so critical to employment improvement at this point in the economic growth cycle.
This portends a higher unemployment rate.
- Mass Layoff Numbers for April were not encouraging…
bls.gov/news.release/mmls.nr0.htm
Employers took 1,564 mass layoff actions in April involving 143,927 workers, seasonally adjusted, as measured by new filings for unemployment insurance benefits during the month, the U.S. Bureau of Labor Statistics reported today. Each mass layoff involved at least 50 workers from a single employer. The number of mass layoff events in April increased by 278 from March, and the number of associated initial claims increased by 25,404. In April, 327 mass layoff events were reported in the manufacturing sector, seasonally adjusted, resulting in 35,022 initial claims; both figures increased over the month.
- Initial Claims continue to stay well above the weekly average required to spur job growth (should be in the 300,000 to 350,000 range). The average Seasonally Adjusted Initial Weekly Claims is 412,000 for 2011, with latest data for May 28 at 422,000
www.dol.gov/opa/media/press/eta/ui/current.htm
The bad news is that unemployment levels will remain high – or will continue to rise for some time to come …but there is a silver lining in that so long as overall employment rises (as measured by the Household Survey), then that will indicate that the economy is rebounding. If this is not the case, all bets are off.
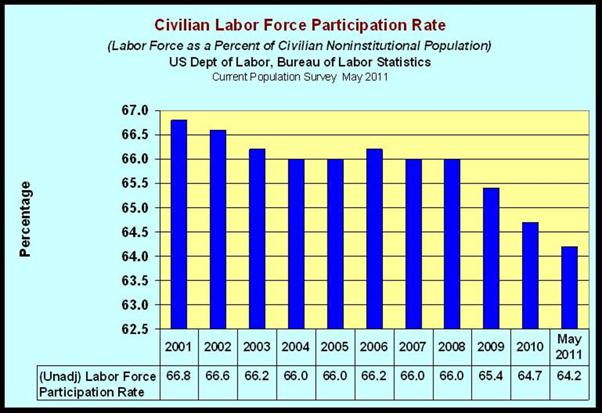
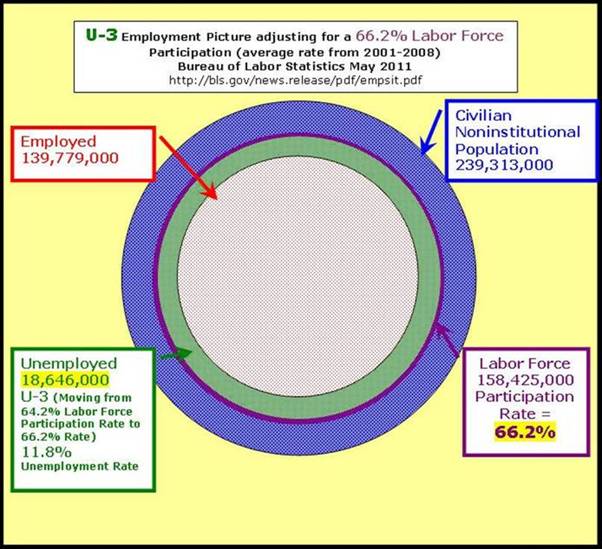
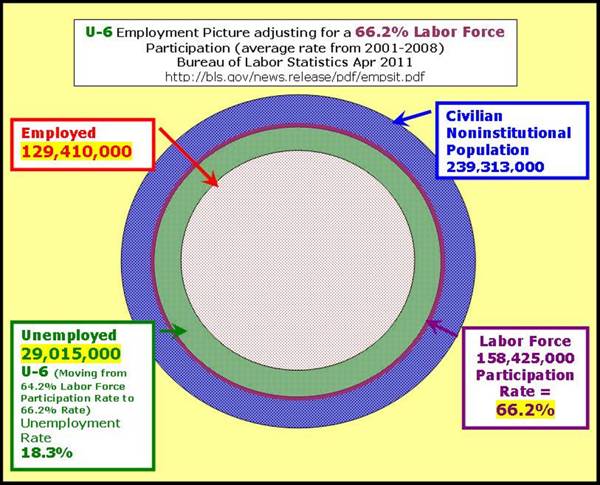
In the following graphs, we will look at the effect of the Labor Force Participation Rate, in terms of the measures of Unemployment: U-3, the official unemployment rate; and U-6 the unemployment rate reflecting underemployment (working at jobs you are overqualified for, working part-time when you would rather work full-time, etc.).
For example, the current Labor Force Participation Rate is 64.2%, while the average Labor Force Participation Rate from 2001-2008 was 66.2%

So what does this all mean? How bad is our employment picture at this point in time?
Let’s keep it simple and assume the following:
- Using the current population figures, we would like to be at a 66.2% Labor Force Participation Rate and 5.0% Unemployment Rate
- The Labor Force would have to increase 4.7 million workers, reflecting discouraged and other potential workers that would likely be encouraged to re-enter the workforce.
- A reduction in the unemployment rate would add and additional 6.0 million workers to the mix.
Given these stated parameters, we are currently at 10.7 million job deficit.

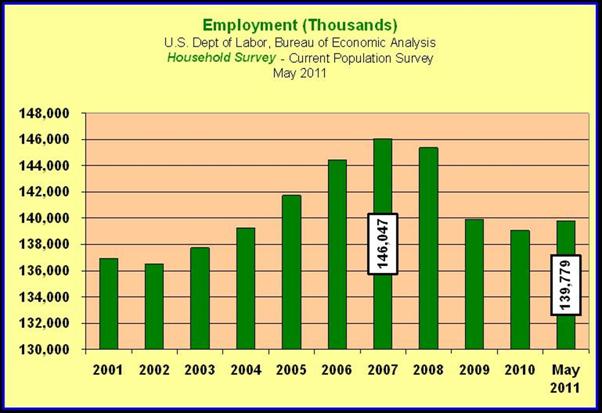
This becomes a bit clearer if we look back at the massive numbers of jobs that have been shed over the past few years in both the Payroll Survey and the Household Survey. Keep in mind that the Payroll Survey is a subset of the Household Survey and while the former’s importance has diminished over the last decade, well over 90% of the jobs created end up in the domain of the Payroll Survey.
As a point of reference, the Establishment (Payroll) Survey accounted for more than 96% of total employment in 2001. In recent years it has fallen below 94%. Just the same, this still means that more than 9 out of every 10 jobs created will come through in the Establishment (Payroll) Survey. This movement between the two surveys – from 96% to 94%, points to the increased importance of small business and the self-employed segment of the labor force. Moving from more traditional employment may also point to bigger issues related to legal costs associated with hiring and managing multiple employees, or simply that with more people are able to run businesses out of their homes (access to computers, Internet, etc.).
Since the Establishment (Payroll) Survey is a subset of the Household Survey, it means that while jobs may grow (as they did in April 2011--- 244,000 jobs) it doesn’t necessarily translate into overall job growth, or a reduction in unemployment. Overall employment, as reflected in the Household Survey, actually declined by 190,000 in April. Again, even though 9+ out of ten jobs will show up in the Payroll Survey, it must also flow through to the Household Survey to affect the unemployment rate.
Moving forward, keep in mind that when we begin to experience the ‘Encouraged Worker Effect’ – when the Labor Force begins to rise beyond the normal influx of new workers, the unemployment rate will likely rise and or remain sticky for some to come. The key figures to keep in mind are the ‘Employed’ in the Household Survey and the ‘Nonfarm Payroll Employment’ in the Establishment Survey. With the encouraged workers we will likely see negative or low numbers in the ‘Employed’ category, due to the influx of those people moving into the Labor Force from the sidelines – Civilian Noninstitutional Population. So long as the ‘Nonfarm Payroll Employment’ number remains high, the employment picture will eventually begin to improve.
The question is how will we know what a recovery looks like? We will see the Labor Force Participation Rate move from its current 64.2% to the 66.2% range. Next, or concurrently, we will see the unemployment rate drop to 5% or less level.
As we pointed out in a previous newsletter article (Down the Rabbit Hole www.econnewsletter.com/may102011), we need on the order of 525,000 jobs per month over the next 2-years to reach 66.2% Labor Force Participation Rate and 5% unemployment, both modest goals.


For an altogether different look – and typically starker look at unemployment and other economic data, you should check out the following link
Shadow Government Statistics www.shadowstats.com
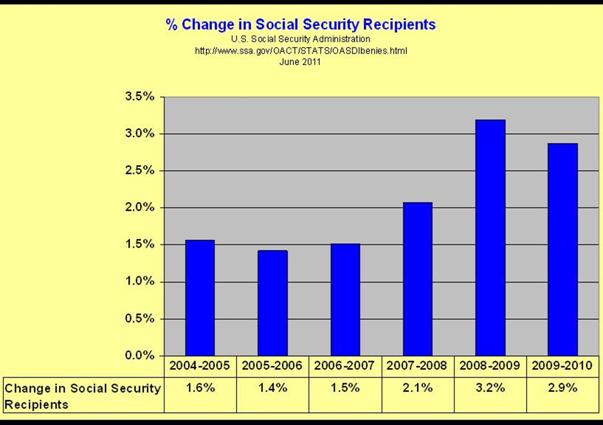
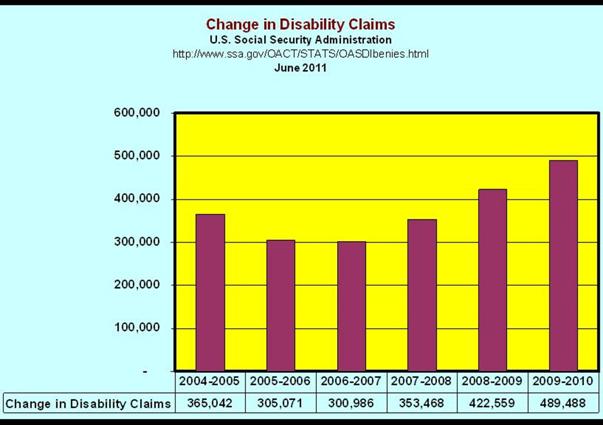
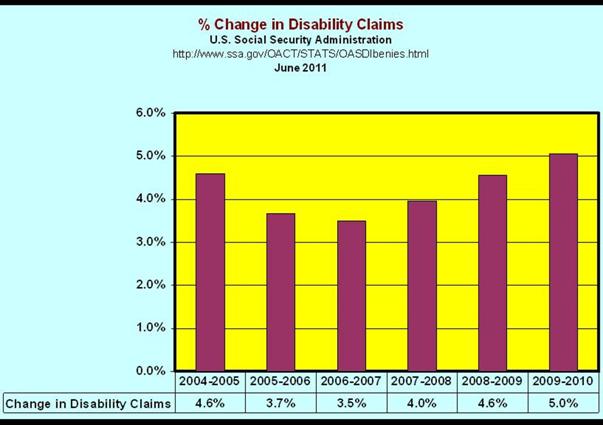
On another (last – for now) note, among the drivers responsible for the fall-off in the Labor Force Participation Rate has been an uptick in the Social Security Rolls, in terms of expanded Disability Claims and ramping up of Social Security Benefit recipients…
Keep in mind that these increased benefits have to be funded by current Payroll taxes, or as Social Security Fund deficits begin to mount; this will have to be offset through the Federal Budget – driving the deficit train even further down the tracks.
www.nationalreview.com/corner/267568/growth-disability-robert-verbruggen
The Growth of Disability
By Robert VerBruggen
May 18, 2011
From Social Security Administration
Facts on OASDI (FACT SHEET ON THE OLD-AGE, SURVIVORS, AND DISABILITY INSURANCE PROGRAM)
December 2010
www.ssa.gov/OACT/FACTS/fs2010_12.pdf
Number of Social Security Beneficiaries
www.ssa.gov/OACT/ProgData/icpGraph.html