
2011 Volume Issue 1
For a downloadable version, click the following:
The U. S. Economy in 2011: A Real Bummer
Let’s stop kidding ourselves. Our economy is in a rut that will soon make the Grand Canyon look like a pothole. Keep in mind that the recession ‘officially’ ended in June 2009.
Unemployment has not gone away: First the Discouraged Workers; and now the EXREMELY DISCOURAGED WORKERS
The U-3 unemployment rate is said to be about 9%, nearly one and one-half times its average of 5.7% for the entire post WW II period, but is that a meaningful estimate when it does not include the so called discouraged workers who have stopped looking for work and many who want full time jobs but can only find part time jobs?
The more meaningful U-6 measure shows unemployment in excess of 16%, a level that smacks of a depression and not a slow recovery.
Even more telling is the fact that if you factor in the discouraged workers; those folks who have given up looking for work and have opted out of the labor force and are waiting for their employment ships to come in. If you factor that into the unemployment equation, it pushes the number much higher.
www.econnewsletter.com/feb062011
[From February 2011]
FYI - official U-6 is 16.1%. Using the same rationale, you could simply tack on another 3.3% for discouraged workers, pushing the adjusted U-6 to 19.3%.
Additional note: since “the sum of the employed and the unemployed constitutes the civilian labor force,” it’s a straight addition of the 3.3% (9.0% +3.3% = 12.3% at the 66.2% Labor Participation Rate).” The impact of the discouraged worker effect is shown in the drop in the participation rate of the population in the labor force.
Perhaps the clearest and starkest picture of the unemployment situation is illustrated by the duration of the unemployment. Americans are not just out of work; they are staying on the unemployment rolls for much, much, much longer!
Many have reached the limit of 99 weeks of unemployment benefits.
www.michigan.gov/documents/uia/NEW_EUC-Internet_.pdf
The maximum number of weeks for which the [State of Michigan] Unemployment Insurance Agency can pay state and federal unemployment benefits remains at 99 weeks.
What is even worse is that the applications for early retirement and social security benefits as well as apps for permanent disability have literally skyrocketed. Let’s call these the EXTREMELY DISCOURAGED WORKERS.
2010 Volume Issue 1
September 23, 2010
HERE WE GO AGAIN
www.econnewsletter.com/sep232011
A stubborn and severe recession is exacerbating the dismal job outlook and causing accelerated early retirements from the labor force, seeking long term disability status, and an increasing reality of very long duration unemployment.
www.socialsecurity.gov/policy/docs/chartbooks/fast_facts10.pdf
Inflation
The inflation rate is said to be under control but decontenting is everywhere.
See our recent article: INFLATION BY DECONTENTING – Less Roll for Your Buck www.econnewsletter.com/feb122011
My friends and relatives have now been informing me that the bureaucrats controlling the Girl Scouts have massively decontented, the grandmother of all decontenting, on two fronts.
Cookie Cutters: Girl Scouts Trim Their Lineup for Lean Times
Fewer in the Package, Less Packaging; No More Thank U Berry Munch
Wall Street Journal
January 27, 2011
online.wsj.com/article/SB10001424052748704881304576093691253234896.html
The so-called Super Six pilot program is the Scouts' latest way to increase profit. Last year, both of the Girl Scout cookies bakers reduced certain varieties of cookies by one ounce per box.
This year, a number of councils—from New York to Chicago—have raised the price of a box of cookies to $4. (Cookies are cheaper in such places as Duluth, Minn., and Dallas.)
Many parents of the Girl Scouts are complaining that many of the Girl Scout camps, the financing of which is a major reason for the cookie campaign, are being closed. The marketing gurus have really blown this one.
www.scrippsnews.com/content/upset-camp-closings-some-girl-scouts-wont-sell-cookies
Upset that their leaders are hanging out For Sale signs at cherished campgrounds, some local Girl Scouts say they may ditch the annual cookie sale in protest.
A NEW TWIST ON SOVEREIGN RISK
State and local governments in the U.S. are on the brink of manifesting a sovereign risk similar to Greece, Portugal and Ireland. Default on their debt is hovering above their heads like a vulture sensing a meal. In recent years, these state and especially local governments have experienced steadily growing payrolls and employees earning substantially more total compensation on the average than the private sector workers that must pay for them with higher taxes. In addition, federally legislated mandates such as Medicaid have bloated state and local government budgets.
The big spenders of the Beltway (Federal government – Washington D.C.) then begin to only partially fund these mandates and in some cases eliminate federal government funding entirely. Growing payrolls and underfunded federal mandates are requiring governors, mayors, etc. to make massive spending cuts just to balance their budgets. Remember that this state and local government debt is mostly held externally, and thus much more burdensome that internally held debt such as was much of the federal government debt until the past few years.
www.bls.gov/news.release/pdf/ecec.pdf
EMPLOYER COSTS FOR EMPLOYEE COMPENSATION – SEPTEMBER 2010
State and local government employers spent an average of $26.25 per hour worked for employee wages and salaries in September 2010, the U.S. Bureau of Labor Statistics reported today. Wages and salaries accounted for 65.5 percent of compensation costs while benefits averaged $13.85 per hour worked and accounted for the remaining 34.5 percent. (See chart 1.) Wages and salaries for management, professional, and related occupations, which represent approximately half of all state and local government employment, averaged $33.17 per hour worked.

Enter Diminished, yet Powerful Unions
www.bls.gov/news.release/pdf/union2.pdf
In 2010, the union membership rate—the percent of wage and salary workers who were members of a union—was 11.9 percent, down from 12.3 percent a year earlier, the U.S. Bureau of Labor Statistics reported today. The number of wage and salary workers belonging to unions declined by 612,000 to 14.7 million. In 1983, the first year for which comparable union data are available, the union membership rate was 20.1 percent, and there were 17.7 million union workers.
From the 2010 data:
The union membership rate for public sector workers (36.2 percent) was substantially higher than the rate for private sector workers (6.9 percent).
Naively, critics have mounted massive efforts to deny these realities and blame those who are faced with the massive rivers of red ink in their state and local government budgets.
THE ANNIHILATION OF DISCRETIONARY INCOME
We’ve pointed out several times on this website the many causes of household budgets being bled dry by rising costs including credit card debt, energy, food, and health care. For awhile, rising interest rates on ARMS mortgages and the resulting rise in monthly payments on those mortgages gave us the foreclosure epidemic and the collapse of home values and household net worth.
In economic theory, the results of these two debilitating effects on consumer spending are called the WEALTH EFFECT, and the INCOME EFFECT.
Do you remember Alan Greenspan’s (former Chairman of the Federal Reserve System’s Board of Governors) comment on the irrational exuberance of consumers due to the wealth effect? As quoted in articles on this website a few years ago and noted below, FED officials were very concerned over the asset bubbles existing and their desire to eliminate them. Back in 2004 they began their attack on these asset bubbles with a vengeance. They drove up short term interest rates by over 400 basis points. As we warned back then in articles on this website, rising oil prices and rising mortgage payments on ARMS would crunch the economy. These factors destroyed the discretionary income of households and left no slack in their budgets to work out of the ensuing problems.
THE FAILED FEDERAL FISCAL STIMULUS POLICIES
The various programs constituting the fiscal stimuli in the past two years have simply not resulted in turning around the economy. Two cases in point: the current average duration of unemployment exceeds 30 weeks - the longest on record; state governments are imploding after the stimulus was used to ramp up hiring and maintain high levels of compensation. We're left with a string of deficits running in the $1.5 trillion range that have to be financed, which in the near term have resulted in little or no economic growth - and the long term prospect of servicing that debt are even more troubling.
Runaway federal government spending is raising the fear of sovereign risk for the U.S. national debt. As risk premiums rise and upward pressure on interest rates result, crowding out of private sector spending becomes an increasing probability.
In an article by Charles Hugh Smith on the Daily Finance website, he pointed out that the federal government spending has increased by one trillion dollars, i.e. $ 1,000,000,000,000 from 2007 to 2010, compared four-hundred thirty billion, i.e. $430,000,000,000 for the period 2004 to 2007; and he concluded that all we receive for it – and will receive for it, is the status quo we had before the humongous resulting increase in the federal budgetary deficits (totaling $3.2 trillion dollars from calendar year 2008 through the end of calendar year 2010).
What Are We Getting for an Extra $1 Trillion in Federal Spending?
02/28/11
www.dailyfinance.com/story/what-are-we-getting-for-an-extra-1-trillion-in-federal-spending
FED’S MONETARY POLICIES: BE CAREFUL WHAT YOU WISH FOR, IT MAY COME TO FRUITION
Again harkening back to Greenspan: he was the one who was concerned about irrational exuberance - namely that the market price of our assets (primarily homes) were growing too rapidly and that the Federal Reserve had to use its power in driving up short term interest rates through policies prescribed by the FOMC (Federal Open Market Committee) that resulted in his 'conundrum' (the short term interest rate hikes didn't flow through to the longer end of the market). The yield curve began to flatten and at times it became inverted.
www.econnewsletter.com/aug272007
Our forecasts and hence policy are becoming increasingly driven by asset price changes. The steep rise in the ratio of household net worth to disposable income in the mid-1990s, after a half-century of stability, is a case in point. Although the ratio fell with the collapse of equity prices in 2000, it has rebounded noticeably over the past couple of years, reflecting the rise in the prices of equities and houses.
Remarks by Chairman Alan Greenspan
Reflections on central banking
At a symposium sponsored by the Federal Reserve Bank of Kansas City, Jackson Hole, Wyoming
August 26, 2005
www.federalreserve.gov/Boarddocs/Speeches/20050826/default.htm
FROM IRRATIONAL EXUBERANCE TO RATIONAL DESPAIR
The Fed and OPEC along with the newly re-cartelized U.S. oil industry rapidly transformed irrational exuberance into RATIONAL DESPAIR of households. The wealth effect works both ways. As stock prices and housing prices collapsed, so did consumer spending as well as the profitable environment of business so necessary to maintain spending on capital goods.
The rising price of borrowed capital and energy exerted an inevitable income effect which also had a depressing effect on consumer spending.
Our economy is once again suffering miserably. With a growth or real GDP of significantly less than 3%, Chairman Bernanke just told Congress than a slide back into a recession (if indeed we have come out of it, the NBER pronouncement not withstanding) is very possible. The FED will continue a policy of ease referred to as QE 2 (quantitative easing – buying securities).
The problem is that the FED can only provide the reserves to the depository system, but they simply become excess reserves until profitability in creating money and lending it out (credit) returns. At the same time, regulators from the FDIC and some from the FED itself are closing banks by the dozens as their capital ratios fall from defaults on their past loans. Only a relatively minuscule amount of new credit is being created.
Credit card credit, especially those of commercial banks have reached heights that were once considered usurious and would have been sufficient for the Mafioso to be content. Clearly despite QE 2, credit creation is virtually non-existent and what is available is very costly.
FYI – Interest Rates…Consumer Lending
Keep in mind that lenders, many of whom were recipients of TARP bailout ‘loans’, are borrowing at very low interest rates to finance very high interest rates on consumer credit card lending.
Are those same institutions that took advantage of TARP, now paying back those ‘bailout’ loans with enormous profits from credit card operations and other consumer loans?
It seems to us that the taxpayer financed the bailout and now the consumer is financing the repayment of the loans.
January 28, 2011
CNN Money
money.cnn.com/2011/credit_cards_interest_rates/index.htm
“Credit card rates at record highs near 15%”
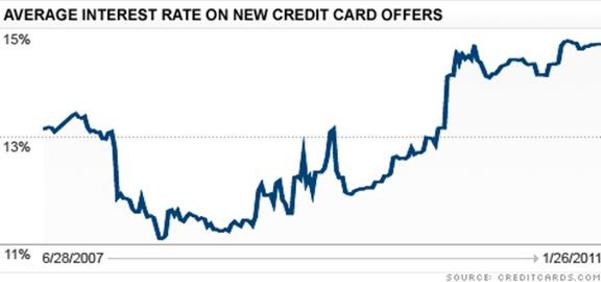
money.cnn.com/2011/credit_cards_interest_rates/index.htm
Meanwhile the cost of funds for financial institutions is very low…
ARE WE CUTTING OUR OWN THROATS?
While the environmental movement can claim victories in limiting seriously the exploitation of our own energy sources such as drilling for oil and mining our huge coal reserves and promoting corn based ethanol, the harmful economic side effects of their victories are staggering.
The Middle East oil producers and fellow travelers such as Venezuela, control the strings of energy production as puppeteers whenever they choose or when political disruptions as they are now occurring become widespread in oil producing areas. Speculators and price gougers drive up energy prices well beyond levels dictated by the real and not contrived forces of supply and demand. This reduces significantly the discretionary income of households and crushes consumer spending. Plenty of cash flow to the supporters of terrorist organizations like Hamas, Hezbollah and Al Qaeda but none left for consumer spending. It reminds us of the famous saying that we can paraphrase as “billions for terrorists but not a cent for consumption spending”.
To satisfy the subsidized use of ethanol, hundreds of thousands of acres of crop land are being diverted to corn production for making ethanol. I just heard from an Iowa resident that farmers are take lots of acreage out of the land bank and producing corn for ethanol. While inclement weather is also a cause of skyrocketing food prices, acreage diversion from soy beans, etc as well as diverting corn from its market derivative products including food and other uses, is also a major cause of such rising prices. The weather will improve, the diversion of acreage will not.
Much of our deficit in the trade balance can be accounted for by oil imports and declining agricultural exports. The U.S. can be energy independent without depending on acreage diversion ultimately for ethanol production. We have the world’s largest coal reserves. We know have the technology to free oil and gas from shale. While we may lack the ethical sensibilities of the management of large oil companies, we do have the technology to tap the huge reserves of oil deep below the Gulf and Caribbean. The technology of slant drilling, etc. is making such exploitation of natural resources more environmentally friendly. Environmental impact statements have to take into account the massive economic side effects of restricting our domestic exploitation of natural resources. Such side effects including providing massive cash flows to governments that support terrorism, growing inflationary pressures by direct price increases of inflation by decontenting, long term if not permanent unemployment and its resulting slowing of economic growth, etc, etc. should also be considered in any environmental impact statement. You could certainly argue that the failing to perform more comprehensive or inclusive ‘environmental’ assessments verges on lunacy.
Rising cost of Gasoline and Diesel
Do you really think the recovery can take off with gasoline prices at $3.50 per gallon and compared to $1.60 per gallon in 2004 and diesel fuel at $3.75 per gallon and rising compared to $1.60 per gallon in 2004?
Latest prices on gasoline and diesel [and historical prices]
U.S. Department of Energy (Energy Information Administration)
www.eia.gov/petroleum/gasdiesel
Finally
It took a major recession that the National Bureau of Economic Research insists we came out of in 2009 (but have we?) to get the public to start connecting the dots. Some are beginning to do so and a scary picture emerges.
NBER December 2007 to June 2009
www.nber.org/cycles/sept2010.pdf
As prices of various forms of energy increase, as rising product prices from toilet paper to Girl Scout cookies rise, even though the trickery of decontenting attempts to mask them, as consumers and business fear additional taxes to fund the rising costs of government intervention from policing what we eat to moving toward universal health care, do you really think spending on consumer goods and services and capital goods for business will rise and ignite a full blown recovery? Come on, quit kidding yourselves.
Even FED Chairman Ben Bernanke is worried.
