
May 18, 2011
For a downloadable version, click the following:
THE GREAT CREDIT COLLAPSE OF 2008-2011: The Smoking Howitzer
Caveat!
The pictures accompanying the following article are very vivid and we recommend the weak of heart view this with adult supervision.
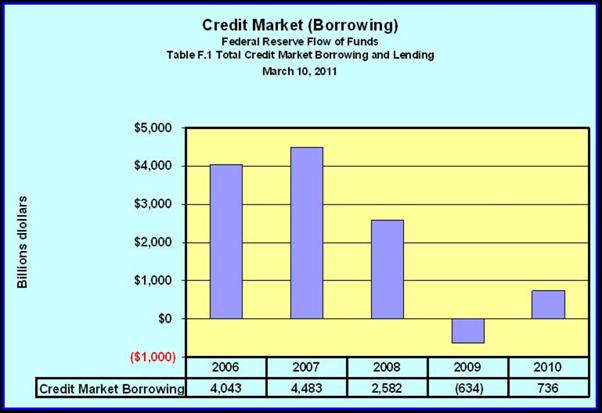
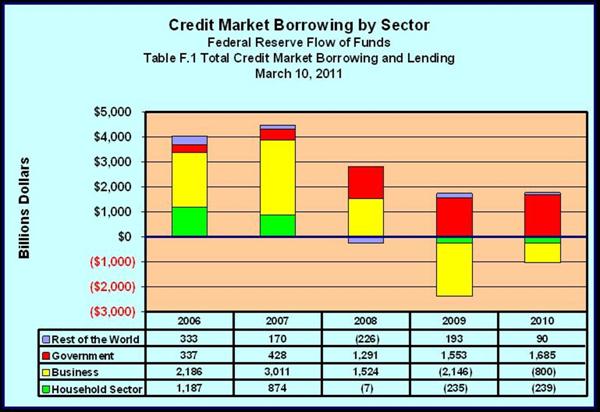
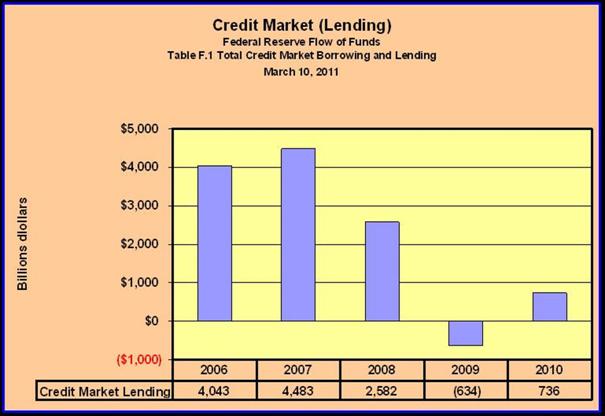
The Flow of Funds Accounts of the Federal Reserve System for the last five years goes a great distance in explaining the ongoing financial and economic malaise of the U.S. economy. The total credit creation was trending upward and reached a peak in 2007 at $4.483 trillion. It fell to $2.582 trillion in 2008 and dropped further, turning negative, (-$634) billion in 2009. This means that in a net sense, no new net credit creation was occurring and outstanding credit was allowed to run off by either credit recipients paying off some of their debt or because lenders undertook bad debt write-offs. A very slight revival occurred in 2010 with $736 billion credit being created. This was 83.6% less credit than was created in 2007. The Flow of Funds data for the first quarter of 2011 is not yet available.
Board of Governors of the [U.S.] Federal Reserve System
Flow of Funds Accounts of the United States
Flows and Outstandings
Fourth Quarter 2010
THE THEORETICAL AND HISTORICAL BACKGROUND
Just as Keynes shattered the neoclassical vision of what was to be called macroeconomics, economists, John Gurley and Edward Shaw shattered the accepted view of credit creation. What it boils down to is that credit creation has two sources, credit can be created by creating new M-1 money as depositories such as banks and credit union do, or it can be created by non-depositories such as finance companies, insurance companies, mutual funds and pension funds, to name but a few, by offering the holders of existing M-1 money, nearly always in a checkable deposit form, a substitute such as a certificate of deposit or pension fund claim or the cash surrender value of a life insurance policy and then “lending out” or investing the just acquired M-1 money. Gurley and Shaw viewed these substitutes as near M-1 money. Many of these substitutes are the non-M-1 components of the more inclusive monetary aggregates such as M-2, M-3, etc.
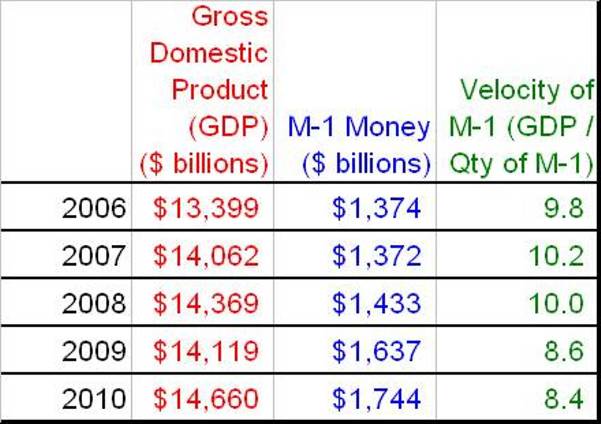
The monetary aggregate M-1 will support a larger GDP and thus the GDP velocity of M-1 is increased. In other words, the financial intermediaries can also create credit by increasing the velocity of M-1 money. While credit creation is related to M-1 money, the greater is the velocity of M-1 money, the greater the creation can be in relation to a given quantity of M-1 money.
This has been implicit in continental monetary theory and policy making. Especially in post WWII Germany where the monetary authority mandated required legal reserves for a much broader spectrum of monetary assets than in for example, the United States. The “spiritual father” of monetary policy on this side of the Atlantic Ocean has been the classical-neoclassical versions of the quantity theory, called monetarism in its modern form.
When the velocity of M-1¹ was stable or at least unstable but reliably predictable, monetarism dominated the FED’s policy making activities. Hence defining, estimating their size, publicly reporting their size, and targeting the growth rates of five monetary aggregates, M-1 though M-5 were characteristics of monetary policy.
1. Archives Blog July 21, 2009
With the inflation driven explosion of substitutes for M-1, moving from M-1 to the broader aggregates or from those broader aggregates back to the narrower aggregates including M-1, caused the predictability of the velocity of the monetary aggregates to become increasingly unreliable, as the basis for monetary policy decisions. The reign of monetarism ended as did the estimating and reporting of the broader aggregates M-3, M-4, and M-5.
Discontinuance of M3 (March 23, 2006)
www.federalreserve.gov/releases/h6/discm3.htm
Chairman Ben S. Bernanke
At the Fourth ECB Central Banking Conference, Frankfurt, Germany
November 10, 2006
Monetary Aggregates and Monetary Policy at the Federal Reserve: A Historical Perspective
M4 and M5 were dropped in a 1980 redefinition of the monetary aggregates.
www.federalreserve.gov/newsevents/speech/bernanke
Even when Monetarism was gaining wider acceptability, Monetarists disagreed on just what was the monetary aggregate that was a chief cause of price level changes. Most argued M-1 as being too narrow a measure. Many chose a broader and more inclusive monetary aggregate such as M-2 or M-3. The broader the aggregate, the less the impact on the velocity of these more inclusive monetary aggregates such movements between its components had. Some chose to define the appropriate aggregate differently than did the FED.
Velocity changes can become quantity changes in the broader aggregates. As the monetary aggregate is more broadly defined and more inclusive, it approaches the totality of credit creation. Estimates of such a broad aggregate become more difficult to make and time lags in the availability of their estimates become increasingly problematic. While the velocity problem is reduced, other such problems as just mentioned make the use of monetarism more difficult as the basis for money policy deliberations and policy choices.
Since the explosion of substitute financial assets, the FED has gradually returned to influence economic and financial behavior by attempting to control the cost and availability of credit.
Tales of Quantitative Easing
QE 1 = 2009
Release Date: March 18, 2009
www.federalreserve.gov/newsevents/press/monetary
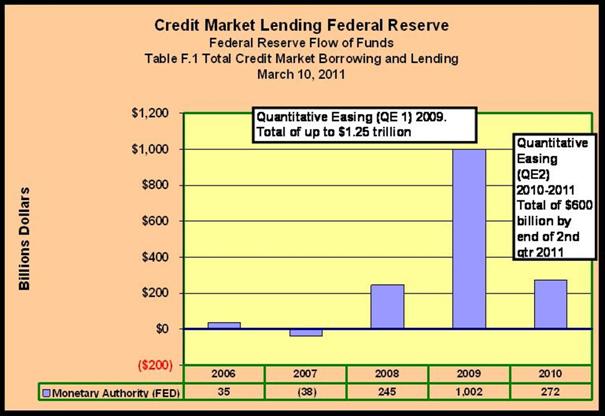
…In these circumstances, the Federal Reserve will employ all available tools to promote economic recovery and to preserve price stability. The Committee [Federal Open Market Committee] will maintain the target range for the federal funds rate at 0 to 1/4 percent and anticipates that economic conditions are likely to warrant exceptionally low levels of the federal funds rate for an extended period. To provide greater support to mortgage lending and housing markets, the Committee decided today to increase the size of the Federal Reserve’s balance sheet further by purchasing up to an additional $750 billion of agency mortgage-backed securities, bringing its total purchases of these securities to up to $1.25 trillion this year, and to increase its purchases of agency debt this year by up to $100 billion to a total of up to $200 billion. Moreover, to help improve conditions in private credit markets, the Committee decided to purchase up to $300 billion of longer-term Treasury securities over the next six months.
QE 2 = 2010-2011
Release Date: November 3, 2010
www.federalreserve.gov/newsevents/press/monetary
To promote a stronger pace of economic recovery and to help ensure that inflation, over time, is at levels consistent with its mandate, the Committee [Federal Open Market Committee] decided today to expand its holdings of securities. The Committee will maintain its existing policy of reinvesting principal payments from its securities holdings. In addition, the Committee intends to purchase a further $600 billion of longer-term Treasury securities by the end of the second quarter of 2011, a pace of about $75 billion per month.
There is an old expression that warns us, “You can lead a horse to water but you can’t make him drink”. To paraphrase it for purposes of this article: You can supply all the legal reserves you want to the depositories but you cannot make them create M-1 money and credit.
We have pointed out in previous newsletters and blogs on this website that depositories create money (checkable deposit form of M-1 money) and credit (lending out the newly created money in the form of loans and investments) in order to increase profits. If such credit creation is not profitable, they will not undertake money and credit creation even with significant excess reserves. The pre- WW II literature on monetary policy referred to this reaction to monetary stimulus as the “reflux mechanism.”
Thomas M. Humphrey – The Federal Reserve Bank of Richmond
Tom Humphrey worked as an economist in the Research Department for 35 years. He retired from his position as senior economist and research advisor in 2005.
Humphrey published numerous journal articles and books during his career at the Richmond Fed. He continues to write on monetary policy history, most recently about the Federal Reserve's role as lender of last resort.
www.richmondfed.org/research/economists/authors
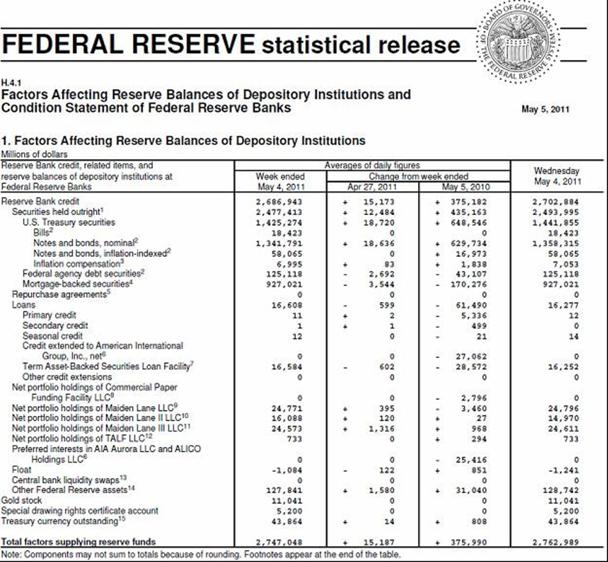
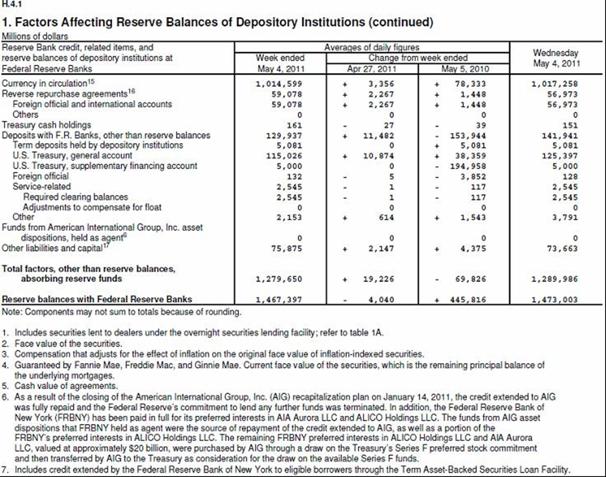
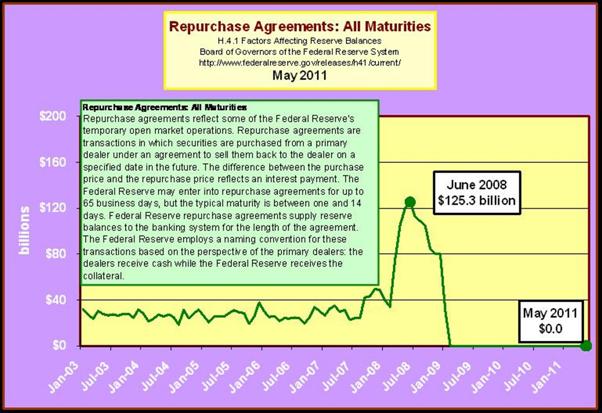
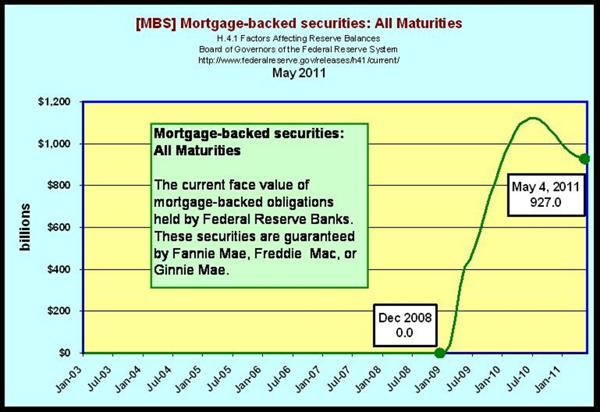
Taking apart the Fed’s Balance Sheet…
federalreserve.gov/releases.pdf
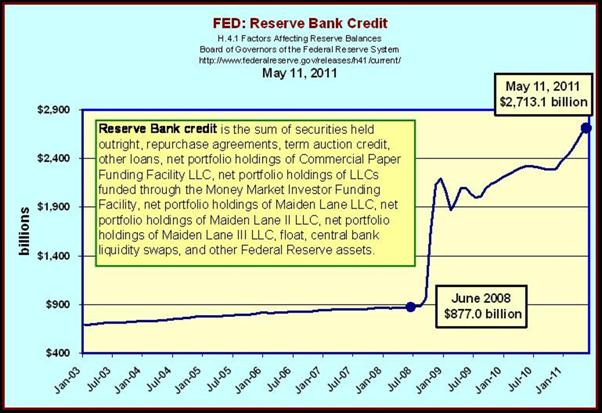
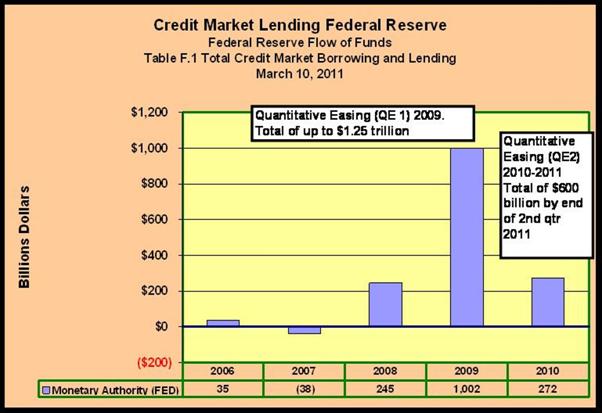
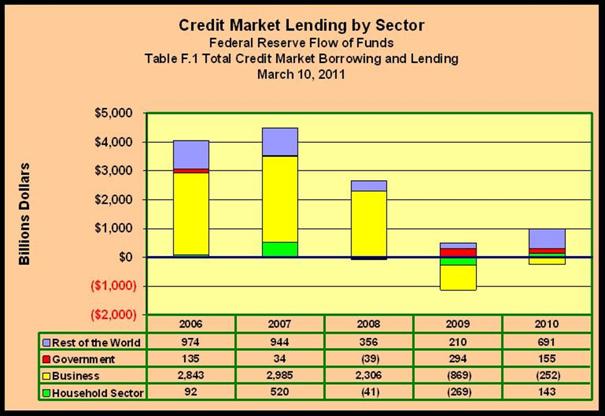
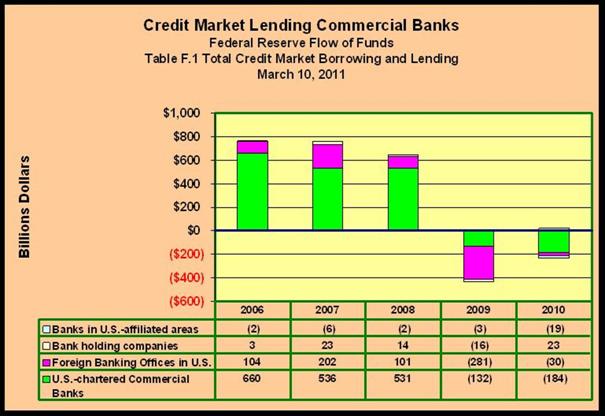
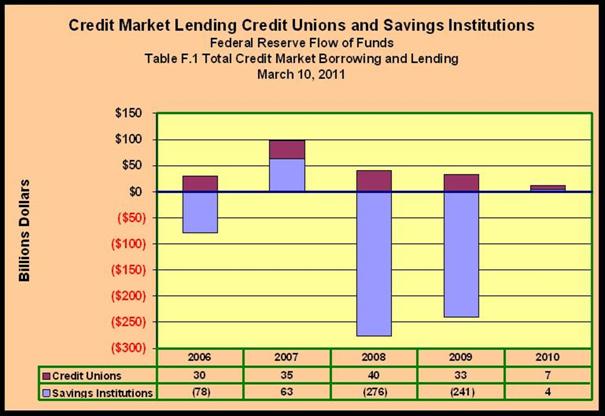
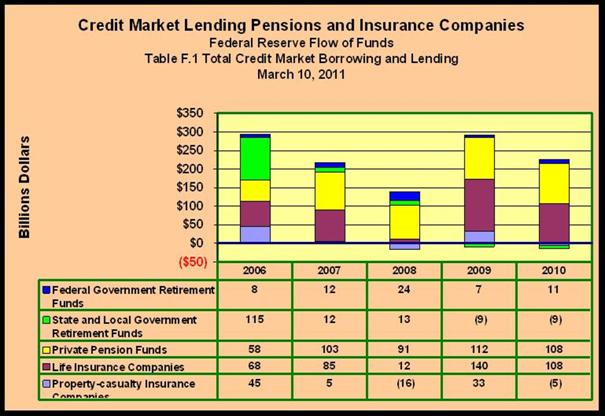
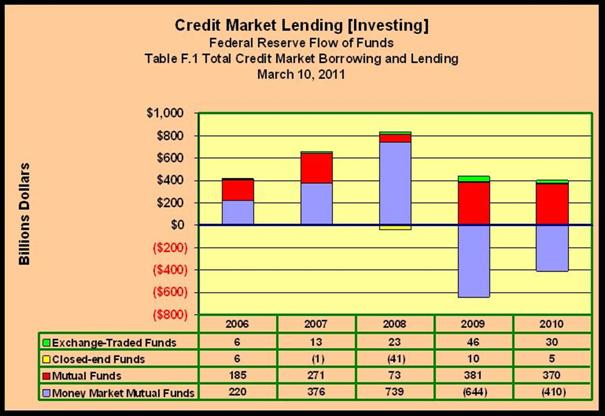
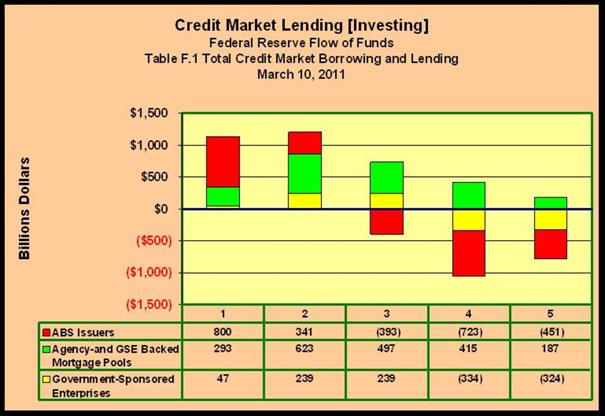
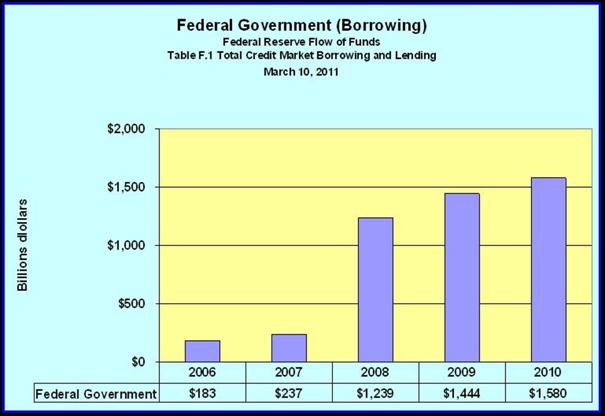
An examination of the following charts is very helpful in revealing where credit creation has been weak. The first two charts below show total credit market borrowing and then its breakdown by sector. First note the collapse beginning in 2008 and the anemic revival in 2010.
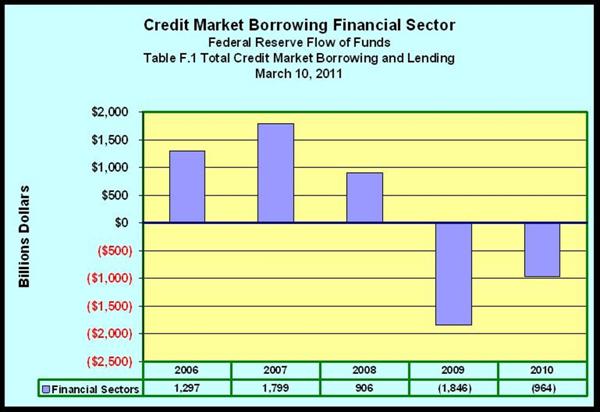
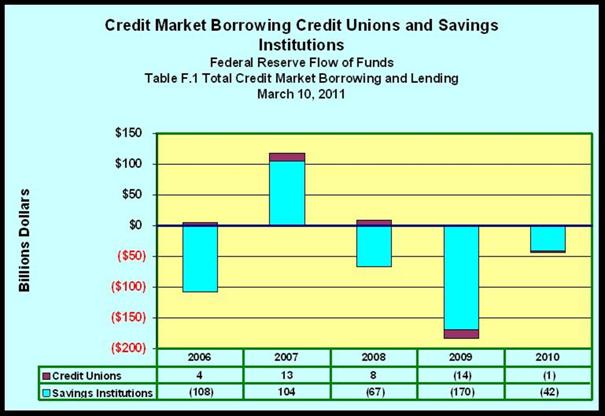
Drilling down on the Financial Sectors…[BORROWING]
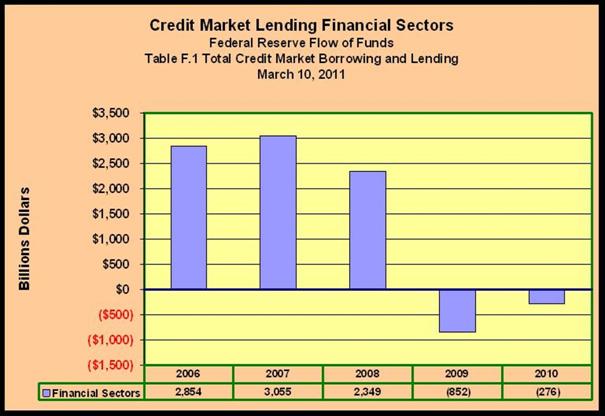
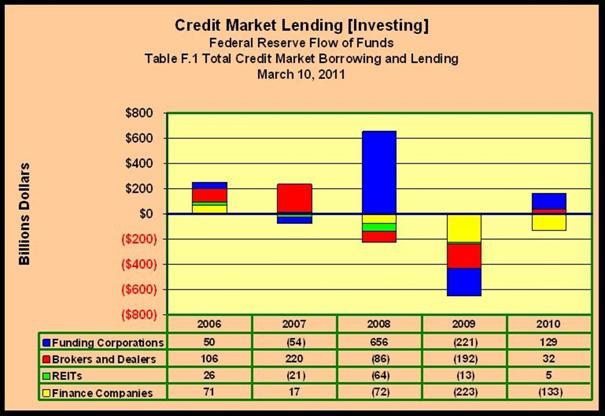
Drilling Down in the Financial Sector…[LENDING]
again
QE 1 = 2009
Release Date: March 18, 2009
www.federalreserve.gov/newsevents/press/monetary
…In these circumstances, the Federal Reserve will employ all available tools to promote economic recovery and to preserve price stability. The Committee [Federal Open Market Committee] will maintain the target range for the federal funds rate at 0 to 1/4 percent and anticipates that economic conditions are likely to warrant exceptionally low levels of the federal funds rate for an extended period. To provide greater support to mortgage lending and housing markets, the Committee decided today to increase the size of the Federal Reserve’s balance sheet further by purchasing up to an additional $750 billion of agency mortgage-backed securities, bringing its total purchases of these securities to up to $1.25 trillion this year, and to increase its purchases of agency debt this year by up to $100 billion to a total of up to $200 billion. Moreover, to help improve conditions in private credit markets, the Committee decided to purchase up to $300 billion of longer-term Treasury securities over the next six months.
QE 2 = 2010-2011
Release Date: November 3, 2010
www.federalreserve.gov/newsevents/press/monetary
To promote a stronger pace of economic recovery and to help ensure that inflation, over time, is at levels consistent with its mandate, the Committee [Federal Open Market Committee] decided today to expand its holdings of securities. The Committee will maintain its existing policy of reinvesting principal payments from its securities holdings. In addition, the Committee intends to purchase a further $600 billion of longer-term Treasury securities by the end of the second quarter of 2011, a pace of about $75 billion per month.
THE BASIC THEORY OF CREDIT CREATION
Recall that only depositories (commercial banks, savings banks, credit unions and savings and loan associations) can create credit by creating additional M-1 money and lending it out (in checkable deposit form: demand deposits, NOW accounts, share drafts at credit unions, and ATS accounts). Credit creation by non-depository financial intermediaries such as insurance companies, pension funds, finance companies and mutual funds, etc., is achieved by their increasing the velocity of existing M-1 money (by issuing substitute financial assets for already existing M-1 assets). These non-depository financial intermediaries cannot create checkable deposits and have to acquire the already existing M-1 money created by the depositories, usually in the process of creating credit. For example, a pension fund issues pension fund claims in exchange for checkable deposits from the contributors, either individuals or the firms that employ them. The pension fund can then lend the checkable deposits by making loans or investments, i.e. creating credit.
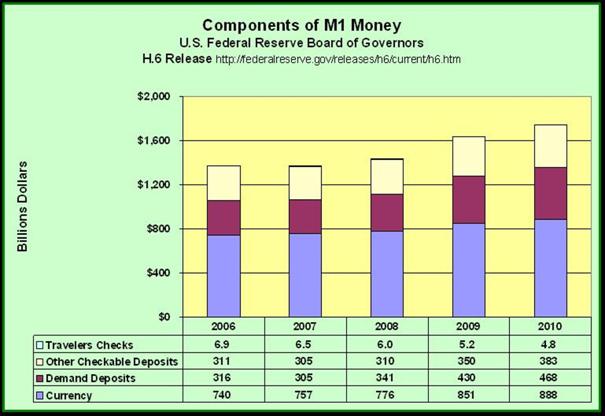
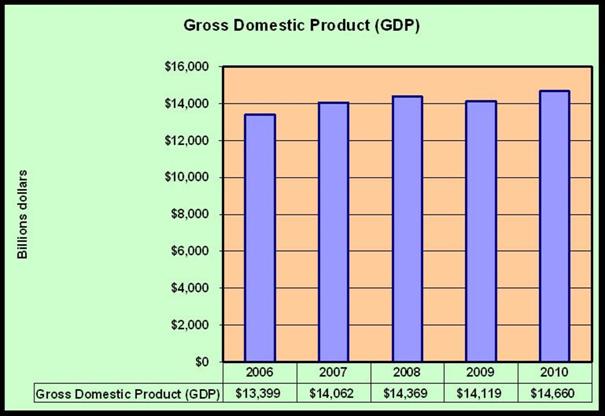
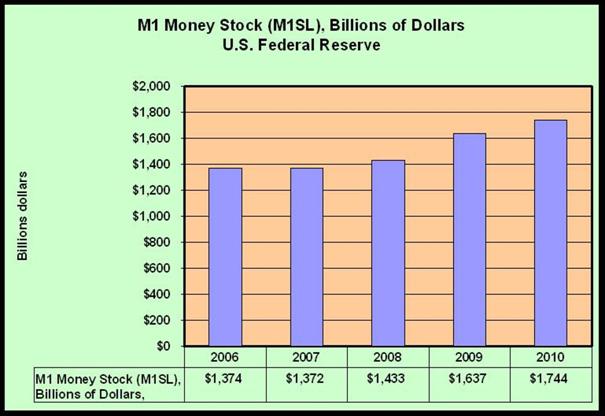
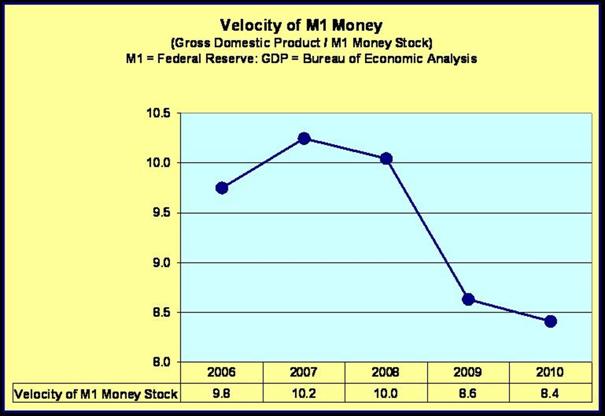
From the data, since all non-depository financial intermediaries as well as the depositories were reducing substantially their credit creation activities, the growth of M-1 slowed to a crawl and the velocity of M-1 fell sharply.
This can be seen in the accompanying charts.
This was not the case for the U.S. Government which has been experiencing record deficits in the last (3) three years.
Glossary of Terms – Federal Reserve Board of Governors
www.federalreserve.gov/newsevents/reform_glossary.htm
just a few…
- Asset-backed securities (ABS)
- A security that is collateralized by a discrete pool of assets (such as loans, leases, or receivables) and that makes payments that are based primarily on the performance of those assets.
- Agency mortgage-backed securities (agency MBS)
- Mortgage-backed securities issued or guaranteed by federal agencies and government sponsored enterprises.
- Mortgage-backed securities (MBS)
- A security that is collateralized by a discrete pool of mortgage loans and that makes payments that are based primarily on the performance of those loans.
- Depository institution
- A financial institution that is legally permitted to accept deposits from individuals. Depository institutions include savings banks, commercial banks, savings and loan associations, and credit unions.
- These are often referred to as primary deposits. This is the chief way in which the depositories acquire legal reserves and enable them to create secondary deposits in the process of credit creation. Secondary deposits are those checkable deposits created by depositories in the process of their creating credit, i.e. making loans and investments.
- The total checkable deposits, as they relate to the total legal reserve of each depository institution, are called the legal reserve ratio.
