
2012 Volume Issue 10
April 15, 2012
For a downloadable version, click the following:
Declaration of Energy Independence 4-15-12 PDF
…a bit more compressed version of the PDF
Declaration of Energy Independence
This newsletter has two parts. The first is a Declaration of Energy Independence and the second part is a survey of existing energy resources and references to the sources and relevant literature for each of the fossil fuels and a selective but brief glance at the alternative renewable energy resources both actual and potential.
A DECLARATION OF ENERGY INDEPENDENCE
Mr. President, members of both houses of the Congress of the United States of America, elected officials of all State and Local governments in this nation and its territories and all appointed bureaucrats:
TEAR DOWN THIS WALL OF RESTRICTIONS ON THE EXPLOITATION OF OUR ENERGY RESOURCES!!
- Free this great nation from the grip of the GREAT RECESSION. Bring back the jobs of the 14.5 million women and men unemployed according to the realistic U-6 measure, wanting to work but cannot find jobs, many having given up looking, out of frustration.

- Eliminate the persistently high foreclosure rate on homes.
Home Prices Seen Dropping 10% in U.S. on Foreclosures: Mortgages
Bloomberg
By Kathleen MF. Howley
April 03, 2012
As many as 1.25 million of America's least cared for homes are headed for auction after a year-long probe into foreclosure practices kept them off the market.
Howley noted that the added supply, as reflected in a 25 percent increase in foreclosures, could cause housing prices to drop up to 10 percent in 2012.
- Bring back oil prices from their current crippling level of around $100 a barrel to range of $30-60 per barrel and derivative petroleum products such as gasoline currently around $4.00 a gallon to it pre-crisis level of $1.30 or so by eliminating the monopoly power over crude oil prices and downstream petroleum products of the now re-cartelized U.S. oil industry. It claims that it is just going along with market prices - prices heavily influenced by OPEC, we must add. It is acting like it is an informal part of the OPEC cartel.
- Free up the permitting process so that petroleum refineries can be expanded, modernized, and built to avoid impending shortages caused by approaching lack of refining capacity.
- Similarly, free up the permitting process for pipelines needed to take advantage of newly exploitable gas and oil shale fields (Marcellus, Bakken, Eagle Ford, and others) and the oil sands of Canada.
This is the nation that undertook the Manhattan Project bringing the end to the War in the Pacific and launched us into the nuclear fission age and is helping propel us along to the age of nuclear fusion, the virtually unlimited energy resource.
This is the nation that took us from horse and buggies and landed us on the moon.
This is the nation that forced the collapse of the Iron Curtain and the Soviet Empire.
We do not need to have our president bowing and scraping to the royalty of nations limiting our sovereignty by orchestrating the contrived scarcity of crude oil nor trying to emulate the leaders of Europe floundering with the problems of sovereign risk having brought it on by seducing a large portion of their populations into a state of dependency on government handouts.
What we do need is an energy policy that will take advantage of the abundant currently technologically exploitable energy resources as indicated in the remainder of this article.
…a review of fossil fuel sources of energy
Coal Reserves
Based on U.S. coal production for 2010, the U.S. recoverable coal reserves represent enough coal to last 239 years. However, EIA projects in the most recent Annual Energy Outlook (January 2012) that U.S. coal production will increase at about 0.4% per year for the period 2009-2035. If that growth rate continues into the future, U.S. recoverable coal reserves would be exhausted in about 168 years if no new reserves are added.
Crude Oil
U.S. Department of Energy, Energy Information Administration
Review of Emerging Resources U.S. Shale Gas and Shale Oil Plays
July 2011
INTEK shale report's assessment of technically recoverable shale oil resources, which amount to 23.9 billion barrels in the onshore Lower 48 States. The largest shale oil formation is the Monterey/Santos play in southern California, which is estimated to hold 15.4 billion barrels or 64 percent of the total shale oil resources shown in Table 1. The Monterey shale play is the primary source rock for the conventional oil reservoirs found in the Santa Maria and San Joaquin Basins in southern California. The next largest shale oil plays are the Bakken and Eagle Ford, which are assessed to hold approximately 3.6 billion barrels and 3.4 billion barrels of oil, respectively.

Office of Oil and Natural Gas/Office of Fossil Energy U.S. Department of Energy
April 17-20, 2005
Opportunities for Increasing Revenues from State and Federal Lands: Pursuing the Stranded Oil Prize Crude Oil Inventory.pdf USGS - United States Geological Survey - April 2005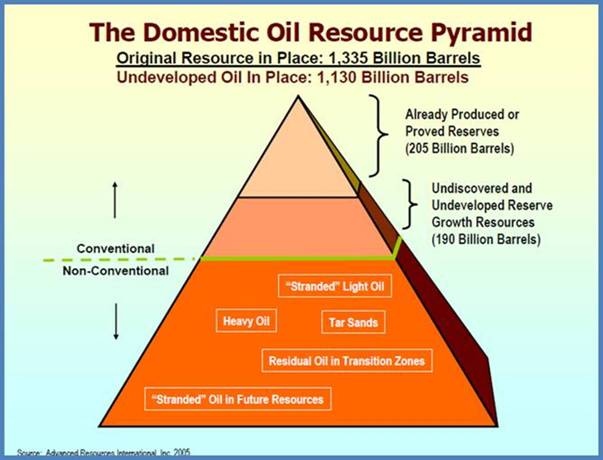
USGS - United States Geological Survey - April 2005
U.S. Department of the Interior, Bureau of Ocean Energy Management, Regulation and Enforcement (formerly, Minerals Management Service)
Using a play-based assessment methodology, the Minerals Management Service estimated a mean of 85.9 billion barrels of undiscovered recoverable oil and a mean of 419.9 trillion cubic feet of undiscovered recoverable natural gas in the Federal Outer Continental Shelf of the United States.
1995 National Estimate of United States Oil and Gas Resources
U.S. Department of the Interior, United States Geological Survey greenwood.cr.usgs.gov
Estimates of national totals for technically recoverable conventional oil, gas, and natural gas liquids (NGL):
Total onshore areas and State waters of the United States:
- Crude Oil (billions of barrels) = 112.6
- Gas (trillions of cubic feet) = 1,073.8
- NGL (billions of barrels) = 29.3
U.S. Department of Energy, Office of Fossil Energy - Office of Oil and Natural Gas
Prepared by Advanced Resources International
February 2006
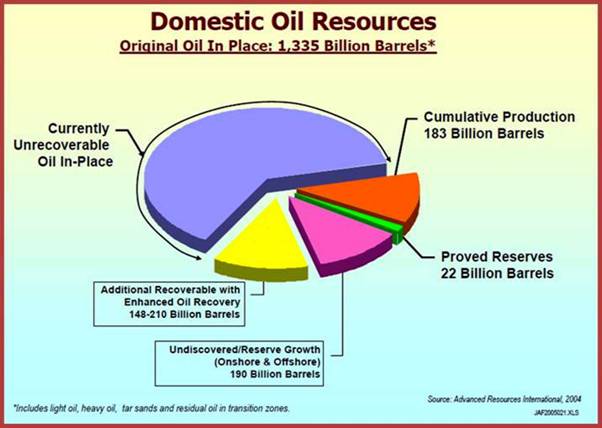
Large volumes of technically recoverable domestic oil resources remain undeveloped and are yet to be discovered, estimated at 400 billion barrels, from an undeveloped remaining oil in-place of over a trillion (1,124 billion) barrels.
U.S. oil resources: President Obama's ‘non sequitur facts'
Posted by Glenn Kesslerat - Washington Post
03/15/2012
This oil resource figure is based on technical estimates made by two arms of the Interior Department — the U.S. Geological Survey (for onshore estimates) and the Bureau of Ocean Energy Management, Regulation and Enforcement (for offshore estimates). These estimates add at least 140 billion barrels to what is known as the U.S. endowment of oil, for a total of more than 160 billion barrels.
Official Oil and Natural Gas Reserves
Natural Gas
Do you know that the U.S. has over one-hundred years of reserves of natural gas?
According to the EIA Annual Energy Outlook 2011, the United States possesses 2,543 trillion cubic feet (Tcf) of potential natural gas resources. Natural gas from shale resources, considered uneconomical just a few years ago, accounts for 862 Tcf of this resource estimate. At the 2010 rate of U.S. consumption (about 24.1 Tcf per year), 2,543 Tcf of natural gas is enough to supply over 100 years of use.
Do you know that ‘peakers' are used to meet peak load needs of electric utilities when electricity cannot be purchased from the grid from other electric utilities off peak? They use the gas to generate electricity from jet-like turbines. With the substantial drop in natural gas prices in recent years, it is becoming a growing source of power to generate electricity even at off peak times.
Why not something like a Manhattan Project or Man on the Moon Project for the advancement of technology to expand alternative renewable resources as well as the detoxifying of pollution from the use of fossil fuels?
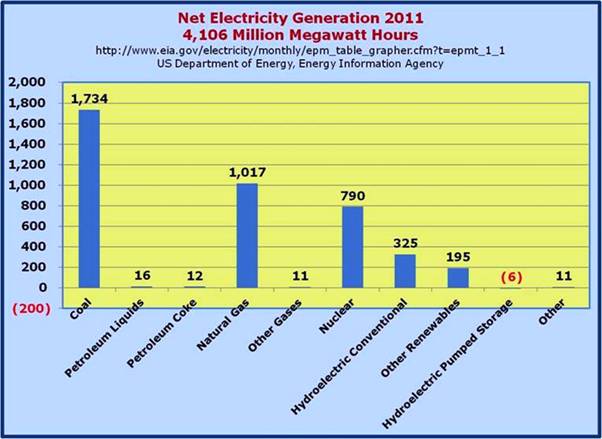
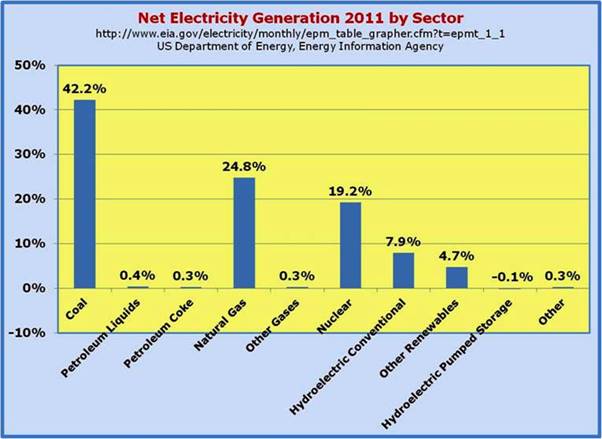
It's clear that while we will be tied to coal for electricity production for many years to come, we are making some strides in terms of alternative energy production as well as increasing our use of cheap and relatively cleaner natural gas. In spite of that, the Environmental Protection Agency, the EPA, recently published standards that will effectively restrict the use of our most abundant resource, coal, in the future production of electricity.
Standards of Performance for Greenhouse Gas Emissions for New Stationary Sources: Electric Utility Generating UnitsMarch 27, 2012
epa.gov/carbonpollutionstandard/pdfs
The proposed requirements, which are strictly limited to new sources, would require new fossil fuel-fired EGUs greater than 25 megawatt electric (MWe) to meet an output-based standard of 1,000 pounds of CO2 per megawatt-hour (lb CO2/MWh), based on the performance of widely used natural gas combined cycle (NGCC) technology.
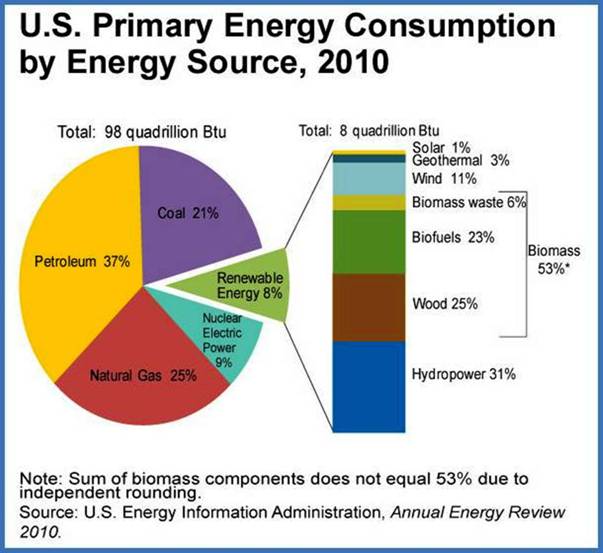
Renewable Energy
Five renewable sources used most often are:
- Biomass — including: wood and wood waste; municipal solid waste; landfill gas and biogas; ethanol; and biodiesel
- Water (hydropower)
- Geothermal
- Wind
- Solar
…a quick glance at Wind Power - Michigan
Wind power, study by MSU Land Policy Institute
At the end of 2010, the installed capacity of wind power in the United States was just over 40,000 megawatts (MW)...Wind power accounts for about 3% of the electricity generated in the United States.
A study by Michigan State University argued that enough wind power could be achieved from off shore wind turbines to satisfy nearly one-quarter of the nation's need for electricity ON A RENEWABLE BASIS.
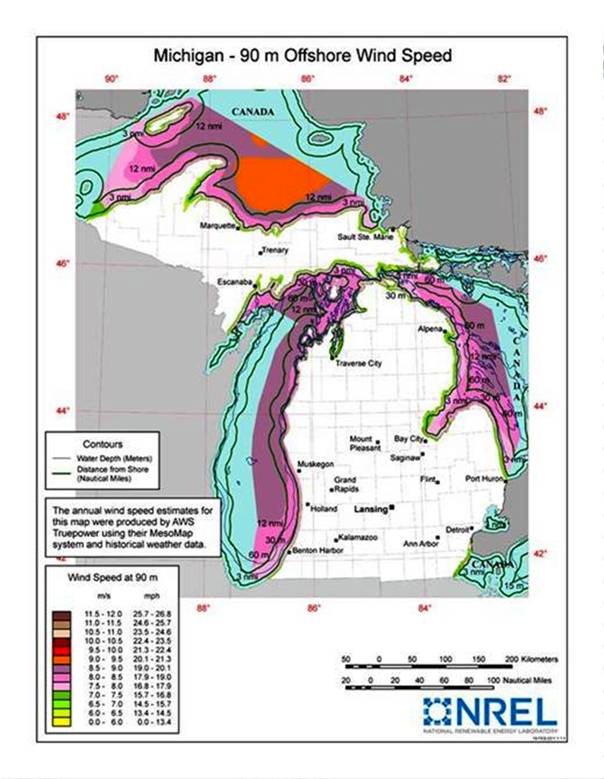
Michigan's Offshore Wind Potential
September 30, 2008
Web page Press Release
Report
www.landpolicy.msu.edu/modules
Assuming that wind towers can be located at all depths without restrictions, Michigan could potentially generate 321,936 Megawatts (Mw) of electricity from offshore wind.
In essence, if the Great Lakes surface area is built out, without restrictions, to maximum depth, the total power output is projected to be 321,936 Mw, or 99,932 Siemens SWT 3.6 turbines.
Summary
We need to focus much more on growing the economy and less on redistributing income and wealth. An aggressive anti-trust policy to decrease the concentration of industries such as currently exist in the financial services and crude oil and its derivative products, is a much more efficient way of maintaining an equitable income distribution than is letting industries concentrate monopoly power over production and prices with the resulting grossly inequitable income distribution and then massive intervention by government to redistribute income to lessen such inequalities.
Why stand we here idle? We send billions of dollars to unfriendly oil exporting nations who in turn are large funders of terrorism around the world resulting in the deaths of tens of thousands of not only innocent foreign people, but of their own people as well.
