2012 Volume Issue 20
August 4, 2012
For a downloadable version, click the following:
…a bit more compressed version of the PDF
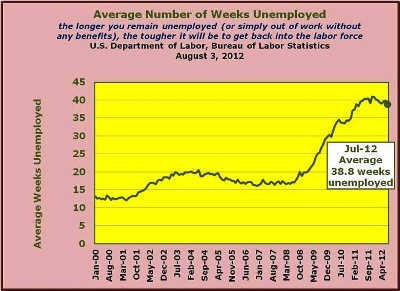
Unemployment Woes Continue: Labor Force shrinks; Employment falls; Unemployment rises – no surprise that the Unemployment Rate increases and the Labor Force Participation Rate falls
Summary:
U.S. Department of Labor, Bureau of Labor Statistics
The Employment Situation – July 2012
www.bls.gov/news.release/pdf/empsit.pdf
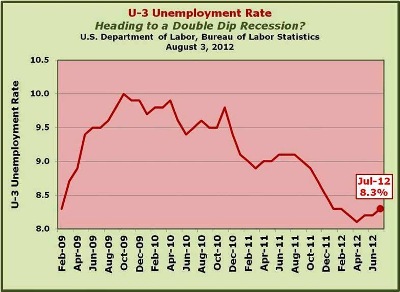
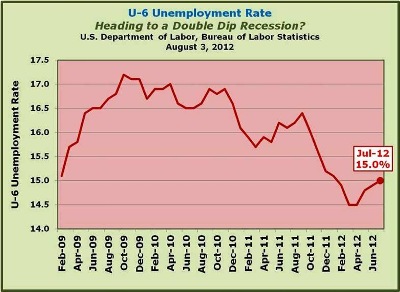
In July 2012, the official U-3 unemployment rate rose from 8.2% to 8.3%, while the U-6 or more inclusive unemployment rate measuring marginally attached (part-time, discouraged, etc.) went from 14.9% to 15.0%.
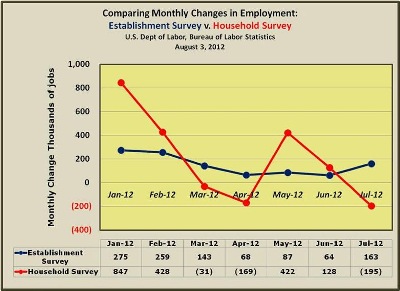
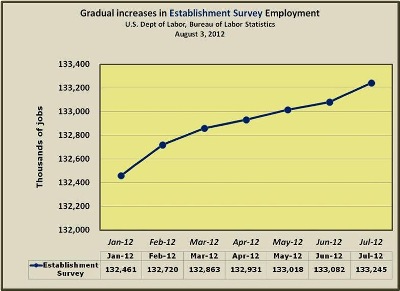
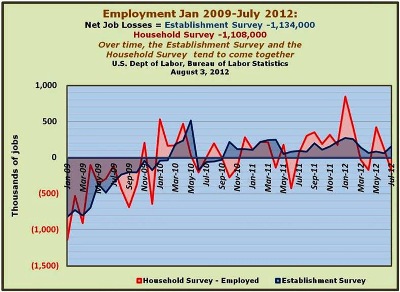
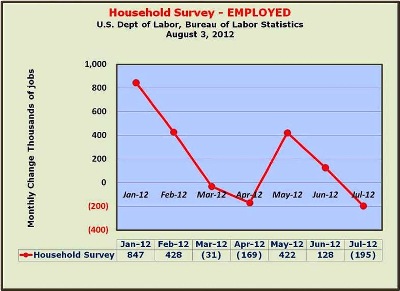
The good news coming from the Establishment (Payroll) Survey, which measures nonfarm payroll employment, was that there were 163,000 additions to those payrolls in July 2012 in comparison to June 2012. The problem with this is that Establishment (Payroll) Survey is [over time] effectively a subset of the overall employment picture (Household Survey), which actually showed a net drop of 195,000 from the employment rolls.
The Breakdown in the Household Survey
Keeping in mind that the Establishment (Payroll) Survey measures about 95% of the Household Survey and seem to be in concert over time:
Frequently Asked Questions about Employment and Unemployment Estimates
www.bls.gov/news.release/pdf/empsit.pdf
Why are there two monthly measures of employment?
The household survey and establishment survey both produce sample-based estimates of employment and both have strengths and limitations. The establishment survey employment series has a smaller margin of error on the measurement of month-to-month change than the household survey because of its much larger sample size. An over-the-month employment change of about 100,000 is statistically significant in the establishment survey, while the threshold for a statistically significant change in the household survey is about 400,000. However, the household survey has a more expansive scope than the establishment survey because it includes the self-employed, unpaid family workers, agricultural workers, and private household workers, who are excluded by the establishment survey. The household survey also provides estimates of employment for demographic groups.
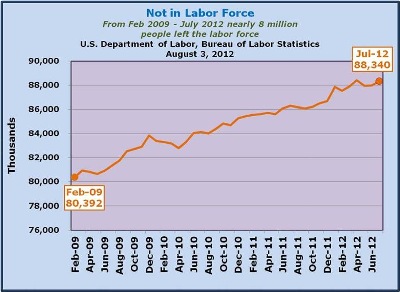
The broadest measure in the Household Survey is shown in the Civilian Noninstitutional Population (population 16 and over who are not in the military, incarcerated, or in other institutions). The two groups comprising the Civilian Noninstitutional Population are the Labor Force and the Not in Labor Force groups. Included in the Labor Force are those employed and those unemployed (actively seeking employment). The Not in Labor Force component includes retirees, those discouraged workers no longer seeking employment (therefore not considered unemployed, or part of the labor force) and increasingly, we are seeing disability numbers on the rise in conjunction with those opting to go onto Social Security earlier than they would have otherwise if the employment situation was not so bleak.
A SUMMARY OF THE 2012 ANNUAL REPORTS
Social Security and Medicare Boards of Trustees
www.ssa.gov/oact/trsum/index.html
Covered Workers and Benefits
www.ssa.gov/oact/tr/2012/lr4b2.html
Editorial: Disability claims swelling in recession
USA Today
Feb 2, 2012
In 2007, 8.9 million people were on disability. Now that number is 10.7 million, a 20% jump in just five years.
Recession Hits Social Security Benefits
Wall Street Journal
July 27, 2012
http://blogs.wsj.com/totalreturn/2012/07/27/recession-hits-social-security-benefits/
…Boston College Center for Retirement Research.
Between 2007 and 2009, the portion of 62-year-olds claiming Social Security benefits – and receiving payments that were 25% less than they would have received at their full retirement age of 66 – “increased sharply,” the study says.
More than 5% of the people eligible to claim their Social Security retirement benefits at age 62 were induced to do so by “the Great Recession,” it says.
- Civilian Noninstitutional Population
- (population 16 and over who are not in the military, incarcerated, or in other institutions) increases by 199,000.
- Labor Force
- (those employed or unemployed (out of work seeking employment)) dropped by 150,000
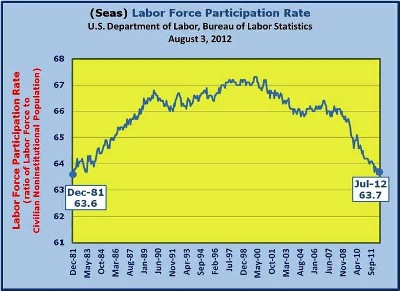
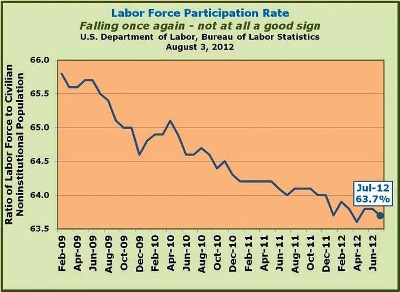
- Labor Force Participation Rate
- fell from 63.8% to 63.7% reflected by the combination of the rise in the Civilian Noninstitutional Population (+199,000) and the fall of the Labor Force (-150,000), resulting in a net increase in the Not in the Labor Force category of 348,000. On a net basis, those additions to the Civilian Noninstitutional Population (+199,000) were combined with the fall off in the Labor Force (-150,000) resulting in 348,000 (rounding) people being sidelined.
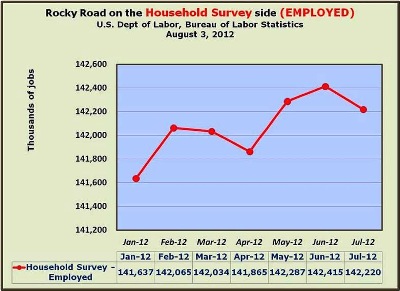
In addition to changes in the size of the Civilian Noninstitutional Population (rising by 199,000) and the fall-off in the Labor Force (falling by 150,000), we now turn to the components within the Labor Force, those employed and the unemployed. Within the context of the labor force, the Employed decreased by 195,000 and the Unemployed increased by 45,000. Again, the difference between the Employed and Unemployed of 150,000 reflects the total of those leaving the Labor Force.
This shrinking Labor Force of 150,000, plus the 199,000 net add to the Civilian Noninstitutional Population, drove the Labor Force Participation Rate to an even lower 63.7% for July, down from 63.8% from June 2012. By the way, the Labor Force Participation Rate (or LFPR) had risen from a low of 63.6% in April 2012 to 63.8% for May and June of 2012. Since most forecasts indicate continued anemic growth – if not a shrinking economy, it’s not likely that the employment situation will improve any time soon.
Federal Reserve Open Market Committee Press Release
August 1, 2012
www.federalreserve.gov/newsevents/press/monetary/20120801a.htm
Information received since the Federal Open Market Committee met in June suggests that economic activity decelerated somewhat over the first half of this year. Growth in employment has been slow in recent months, and the unemployment rate remains elevated.
As noted previously, employment in the Household Survey fell by 195,000. Keep in mind that the Establishment Survey is a subset of the Household Survey, so while there was an improvement on the Establishment Survey of 163,000, the overall number as reflected in the Household Survey Employed number fell by 195,000 in July 2012.
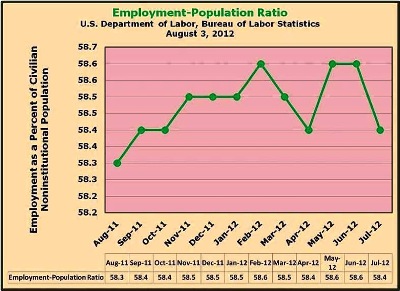
The next ratio to review is the Employment-Population Ratio which measures the relationship between Employment and the Civilian Noninstitutional Population. In the preceding two months (May and June 2012) the ratio appeared to be showing signs of improvement after moving up from 58.4% in April to 58.6% in both May and June. The drop-off in July to 58.4% raises red flags since those who are employed are ultimately responsible for ‘growing’ the economy. If you are not employed, you are either unemployed or not in the labor force, in either case, you are not contributing to economic growth. To summarize, if the Employment-Population continues to either remain low or fall further, this will put additional pressure on those gainfully employed to carry the rest.
And now we move on to the unemployed…
In July 2012, the (official) U-3 Unemployment Rate rose from 8.2% in the preceding month to 8.3%. Over the past several months, the unemployment rate has fallen quite a bit, but it’s been viewed with some degree of skepticism based on deterioration in the Labor Force Participation Rate (revealing that that many workers unable to find employment left the Labor Force altogether) and the stubbornly high U-6 Unemployment Rate which includes marginalized workers, many of whom are either discouraged or working part-time - unable to find adequate full-time employment.
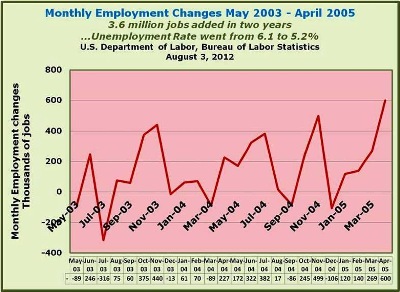
Whereas a falling unemployment rate in the Bush era was derided as a jobless recovery – owing to the significant employment gains outside of the Payroll Survey, such additions to the employment numbers in the Household Survey (Current Population Survey) would be very welcome indeed currently.
(Read the following from the pages of the Economist Magazine in May 2003)
Another Bush, another jobless recovery
The jobs market looks bleak and the president's tax cut is unlikely to help
Economist Magazine - May 8, 2003
www.economist.com/node/1772963
In the end, the Republican Congress looks likely to force through a stimulus package that is largely based around tax cuts. Some of these measures may be sensible long-term reforms, and returning money to taxpayers is seldom unpopular. But the stimulus will not create many jobs now, whatever Mr Bush says.
The Reality…
The last piece of this Employment Picture puzzle that we’ll delve into is the Not in Labor Force component. In July 2012, the Not in Labor Force reading was 348,000 (rounding) which reflected an increase in the Civilian Noninstitutional Labor Force of 199,000 and a decrease in Labor Force of 150,000 (Employed fell by 195,000 but was offset by an increase in Unemployment of 45,000, netting out to a decrease in the Labor Force of 150,000).
Since February 2009, the Not in Labor Force component increased by 7.948 million. While it’s normal to see increasing numbers in the Not in Labor Force portion of the Civilian Noninstitutional Population, the rate since February 2009 has been 187,000 per month, while for the preceding 43 months the average was around 90,000 per month (typically, the number would be in the 70,000 range).