
2012 Volume Issue 2
February 8, 2012
For a downloadable version, click the following:
Labor Force Participation Rate by Age Group
Labor Force Participation Rate by Age Group
So you think a drop in the unemployment rate from 8.5% in December 2011 to 8.3% in January 2012 is a sign of improvement in the economy? Think again!
January 2009 versus January 2012
Brought to you by the Department of Labor, Bureau of Labor Statistics www.bls.gov.
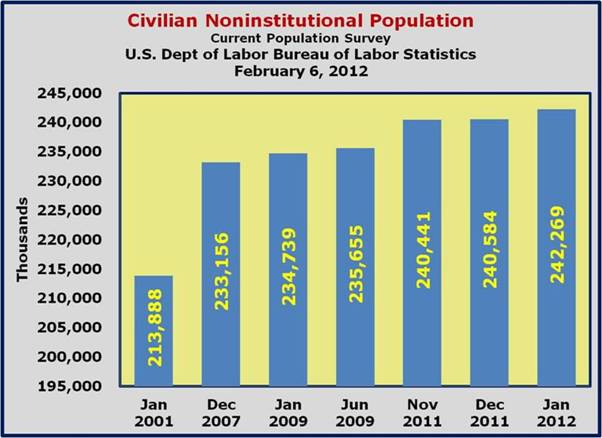
- In January 2009 the CIVILIAN NONINSTITUTIONAL POPULATION (16+ year-old, not in instutions, i.e., military, prison, etc.) was 234,739,000; in January 2012 the CIVILIAN NONINSTITUTIONAL POPULATION was 242,269,000
- CIVILIAN NONINSTITUTIONAL POPULATION grew by 7,530,000
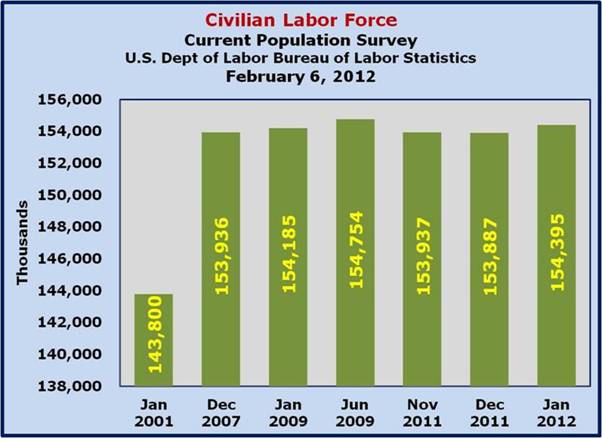
- In January 2009 the CIVILIAN LABOR FORCE (employed + unemployed) was 154,185,000; in January 2012 the CIVILIAN LABOR FORCE was 154,395,000
- CIVILIAN LABOR FORCE grew by 210,000
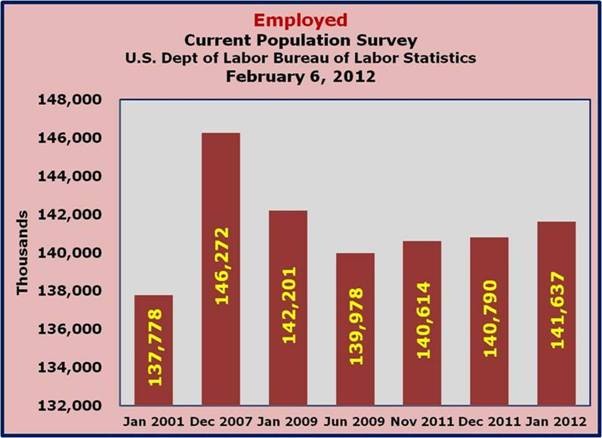
- In January 2009 total EMPLOYED was 142,201,000; in January 2012 total EMPLOYED was 141,637,000
- 1,659,000 fewer EMPLOYED
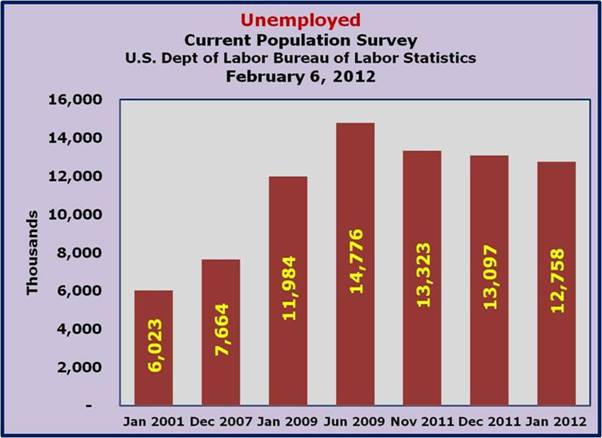
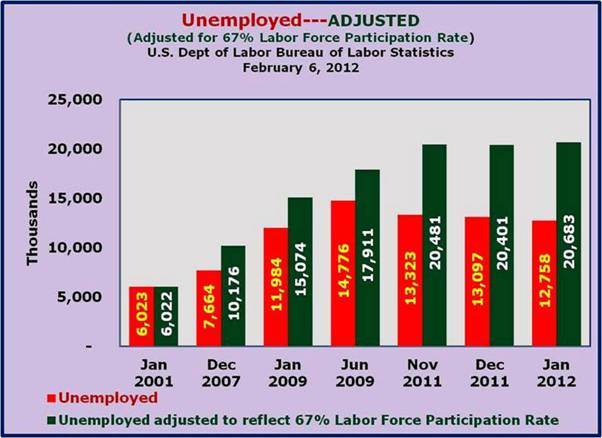
- In January 2009 total UNEMPLOYED was 11,984,000; in January 2012 total UNEMPLOYED was 12,758,000
- 774,000 more UNEMPLOYED
- UNEMPLOYMENT RATE = Unemployed divided by the Labor Force
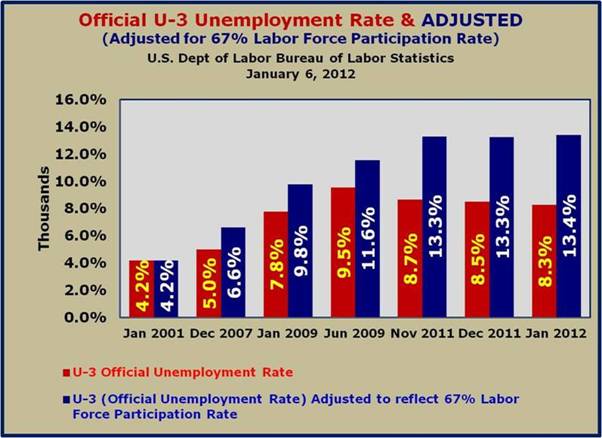
- In January 2009 UNEMPLOYMENT RATE was 11,984,000 / 154,185,000, or 7.8%; in January 2012 total UNEMPLOYMENT RATE was 12,758,000 / 154,395,000, or 8.3%
- UNEMPLOYMENT RATE rose 0.5%
Let's get this straight:
- From January 2009 to January 2012
- CIVILIAN NONINSTITUTIONAL POPULATION grew by 7,530,000
- CIVILIAN LABOR FORCE (Employed + Unemployed) grew by 210,000
- EMPLOYED fell by 1,659,000
- UNEMPLOYED rose by 774,000
- UNEMPLOYMENT RATE increased by 0.5%
So you ask what about last month? Wasn't the movement from 8.5% Unemployment Rate to 8.3% a good thing? How can that be?
…keep in mind that January includes data affected by the Census Bureau's estimation updates relating to the Current Population Survey which is the basis for metrics related to measuring National Unemployment.If January 2012 LABOR FORCE PARTICIPATION RATE (63.73%) had been the same as December 2011 (63.96%)
- UNEMPLOYMENT RATE = Unemployed divided by the Labor Force
- In December 2011 UNEMPLOYMENT RATE was 13,097,000 / 153,887,000, or 8.5%
- Adjusting January 2012 total at the 63.96% December Labor Force Participation Rate UNEMPLOYMENT RATE was 13,327,792 / 154,964,792, or 8.6%
- The UNEMPLOYMENT RATE would have risen by 0.1%! This is why the focus has to be on metrics other than the just unemployment.
Caution: Keep in mind that when the Bureau of Labor Statistics (BLS) notes that "Total nonfarm payroll employment rose by 243,000 in January," they are referring to a different survey – the Current Establishment Survey (or Payroll Survey) to measure changes in job growth. There are two different surveys employed by BLS, Household (Current Population Survey – CPS) and Payroll (Current Establishment Survey – CES). While it is a good thing to point out the increase on the Payroll side, keep in mind that this is in effect a subset of the Household Survey.
Back to the Labor Force Participation Rate
While the media and wishful thinkers revel in what officialdom has released as a drop in the unemployment rate, a more in depth analysis raises many red flags about the validity of this metric. Let's highlight these warning flags first before we go into the devilish details.
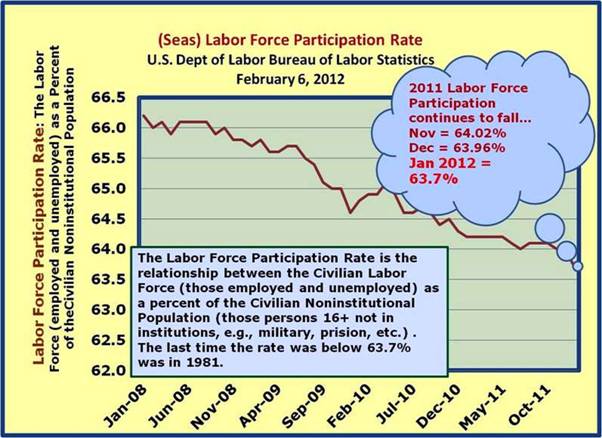
The overall Labor Force Participation Rate has fallen again from 63.96% in December 2011 to 63.7% in January 2012. It is the lowest reading since December, 1981!
This is clearly a sign that people have opted out of the workforce (labor force). It goes beyond even what is captured in the U-6 Unemployment measure that typically picks up 'discouraged workers', those people who have stopped looking due to economic conditions. In essence it comes down to two categories: those 'discouraged workers' who indicate that they will return to the workforce (labor force) when the job prospects reappear; and those who think they will never find work again – hence, they have opted out.
What will happen when the economy truly does improve is that we will see an uptick in the Labor Force Participation Rate, indicating that those who left the Labor Force will have returned.
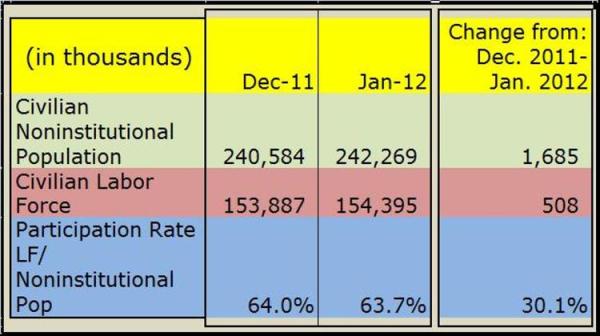
The marginal or monthly change in the labor force participation or LFPR is an absolute, unmitigated disaster having fallen to 30.1%. Note: the December numbers reflect an adjustment to the entire year, based on updated population estimates by the Census Bureau.
The Civilian Noninstitutional Population rose by 1,685,000, but the Civilian Labor Force only expanded by 508,000, resulting in monthly 30.1% Labor Force Participation Rate. This means that only 30.1% of those added to the Civilian Noninstitutional Population (16 years and older) actually joined the labor force, a total of 1,173,000.
The Youngest are Hit the Hardest
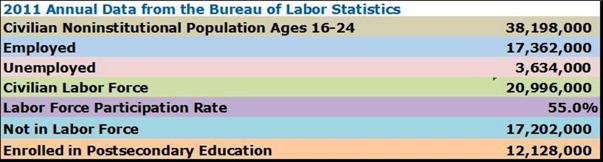
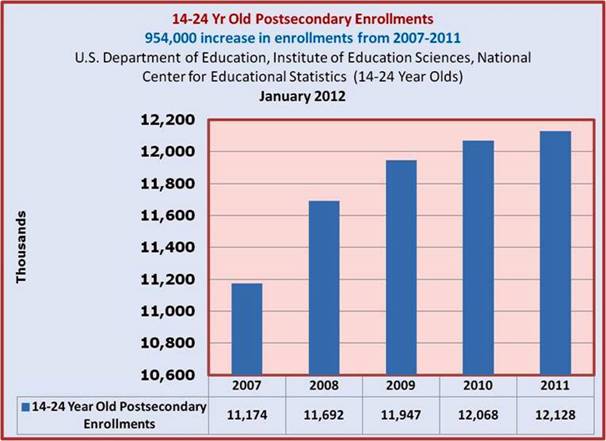
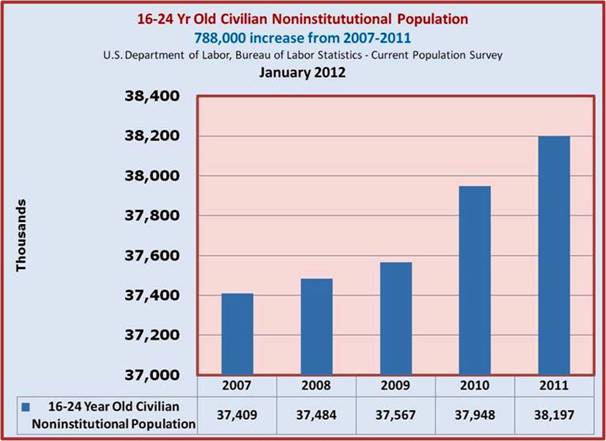
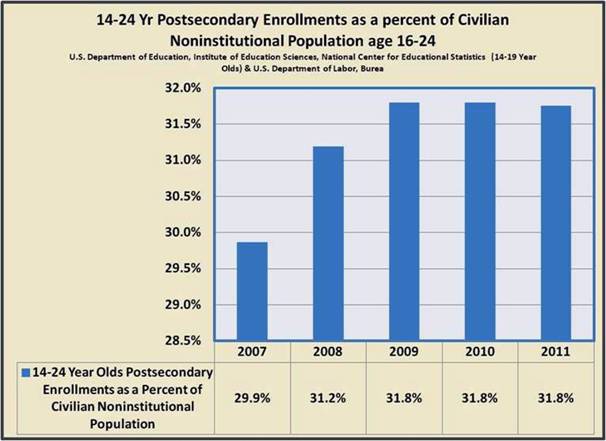
The Labor Force Participation Rate (LFPR) for the age group 16-24 years of age has fallen significantly from the years, 63.3% in 2002 to 55.0% in 2011. Of the total in this age group (2011 Civilian Noninstitutional Population ages 16-24) only 45.5% or 17.4 million have found jobs. Of those not employed (20.8 million out of a total Civilian Noninstitutional Population of 38.2 million), the U.S. Department of Education indicated that 12.1 million have chosen to attend college. Keep in mind that many of the 12.1 million in school are also working or seeking work.
U.S. Department of Education, National Center for Education Statistics
Enrollment in degree-granting postsecondary institutions increased by 9 percent between 1989 and 1999. Between 1999 and 2009, enrollment increased 38 percent, from 14.8 million to 20.4 million. Much of the growth between 1999 and 2009 was in full-time enrollment; the number of full-time students rose 45 percent, while the number of part-time students rose 28 percent. During the same time period, the number of enrolled females rose 40 percent, while the number of enrolled males rose 35 percent. Enrollment increases can be affected by both population growth and rising rates of enrollment. Between 1999 and 2009, the number of 18- to 24-year-olds increased from 26.7 million to 30.4 million, an increase of 14 percent, and the percentage of 18- to 24-year-olds enrolled in college rose from 36 percent in 1999 to 41 percent in 2009.
Drilling Down in Five Year Increments
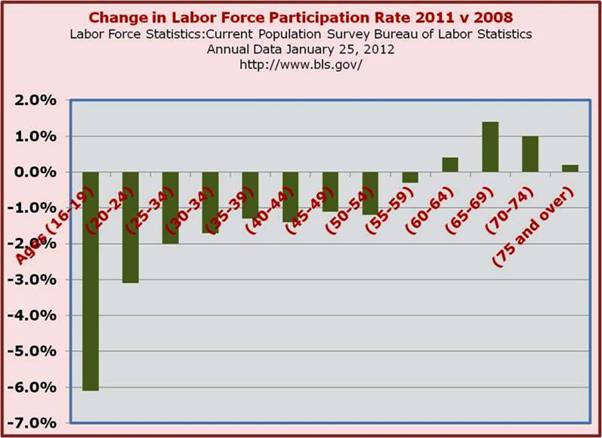
Just as disturbing as the fall-off in the 16-24 set are the age group segments through age 59. These seasoned workers have also experienced a significant drop in their LFPR.
A real shocker is that despite the overall drop in the LFPR, the elderly workers from 50 years and up have experienced an INCREASE IN THEIR LFPR. This is true even for the age segment 75 years of age and older. It would appear that Social Security and private pensions and savings have become inadequate to maintain an acceptable life style. We will address the potential causes for this failure in a soon to be posted newsletter n the website.
What is disturbing about this is that calculation of the unemployment rate ignores a huge cadre of workers that have become DISCOURAGED and stopped looking for work and VERY DISCOURAGED who have been able to retire early or have successfully received permanent disability status. The numbers of such have risen significantly in the last few years.
THE FUTURE GUIDES THE PRESENT; THE DEMOGRAPHIC MAP VERSUS THE HELP WANTED SECTION OF THE WANT ADS: What will tomorrow's today look like demographically by 2050?
November 1, 2011
www.econnewsletter.com/nov012011.html
IF THE UNEMPLOYMENT RATE IS REALLY FALLING, WHY ARE SO MANY PEOPLE STILL OUT OF WORK? THE DEVIL IS IN THE DETAILS
www.ssa.gov/policy/docs/statcomps
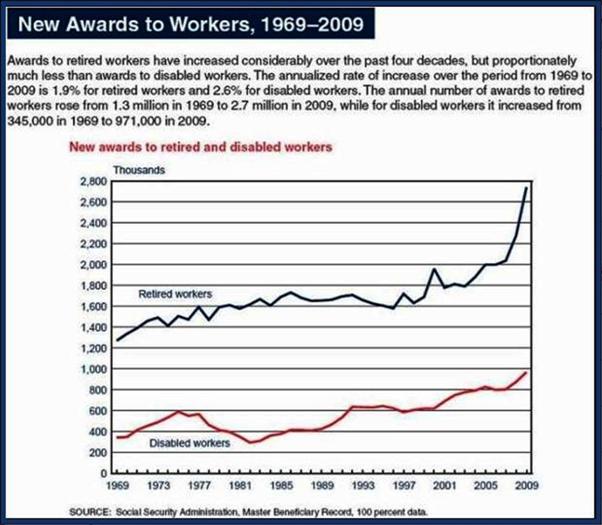
All Social Security disabled beneficiaries in current-payment status, December 1970–2009
The number of disabled workers grew steadily until 1978, declined slightly until 1983, started to increase again in 1984, and began to increase more rapidly beginning in 1990. The growth in the 1980s and 1990s was the result of demographic changes, a recession, and legislative changes. The number of disabled adult children has grown slightly, and the number of disabled widow(er)s has remained fairly level. In December 2009, about 7.8 million disabled workers, just under 921,000 disabled adult children, and over 236,000 disabled widow(er)s received disability benefits.
A stubborn and severe recession is exacerbating the dismal job outlook and causing accelerated early retirements from the labor force, seeking long term disability status, and an increasing reality of very long duration unemployment.
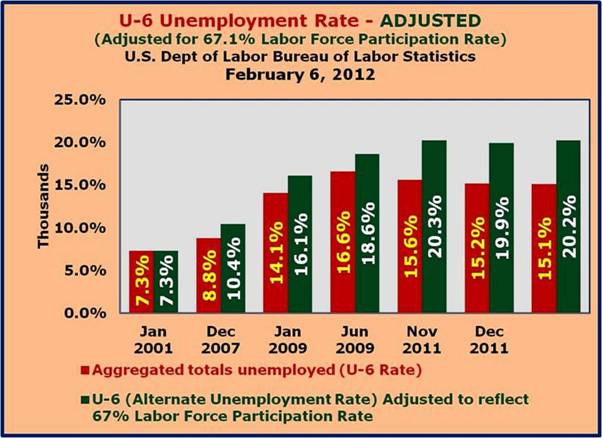
The editors of the newsletter have argued persistently for adjusting the unemployment figures to include these categories of discouraged workers. When this is done, as we have calculated such adjusted numbers and rates in previous newsletters on this website, the unemployment rates are much higher and more reflective of what is really happening in the economy.
The Labor Force Participation Rate is the relationship between the Civilian Labor Force (those persons employed and unemployed) as a percent of the Civilian Noninstitutional Population (those persons 16 and over not in institutions, e.g., military, prison, etc.). Again, the Labor Force Participation Rate was 63.7% in January 2012; the last time the rate was less, 63.6%, was December 1981.
Lies, Damned lies, and Statistics
December 5, 2011
www.econnewsletter.com/dec052011.html
Labor force Participation Rate
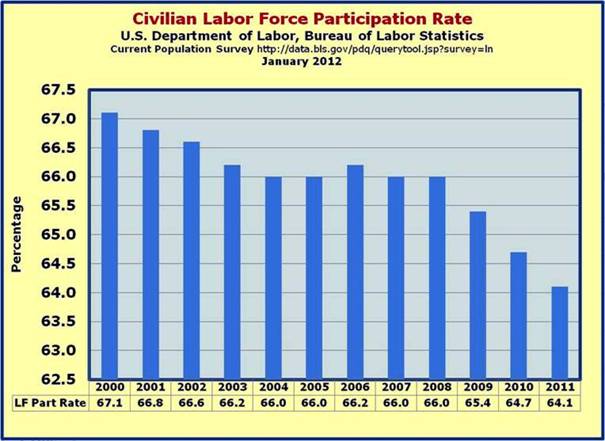
The labor force participation rate represents the proportion of the civilian noninstitutional population that is in the labor force. This measure of labor force activity grew from about 60 percent nationally in 1970 to about 67 percent in 2000, with much of the increase resulting from increased participation by women.
In summary we've been looking into the impact of the Labor Force Participation Rate in a few previous newsletters and this is where we are at:
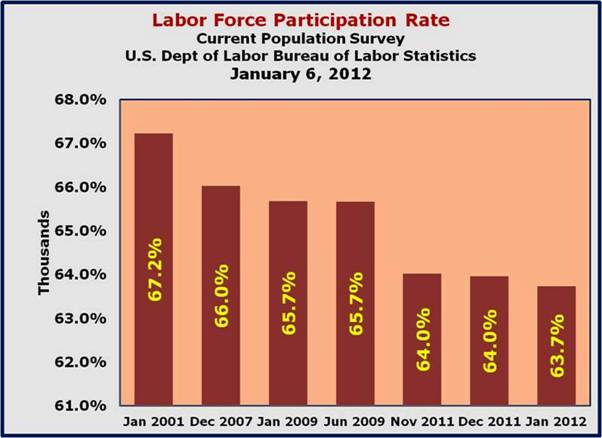
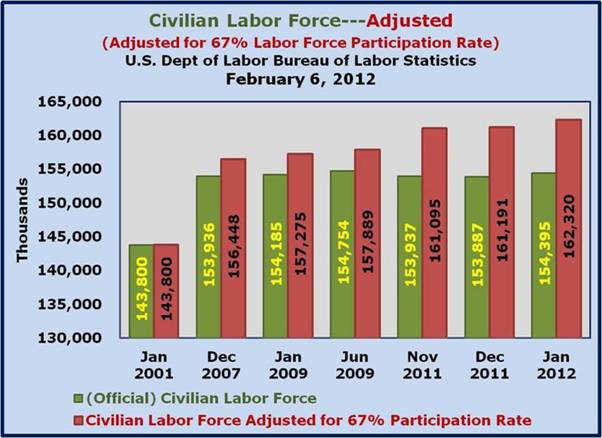
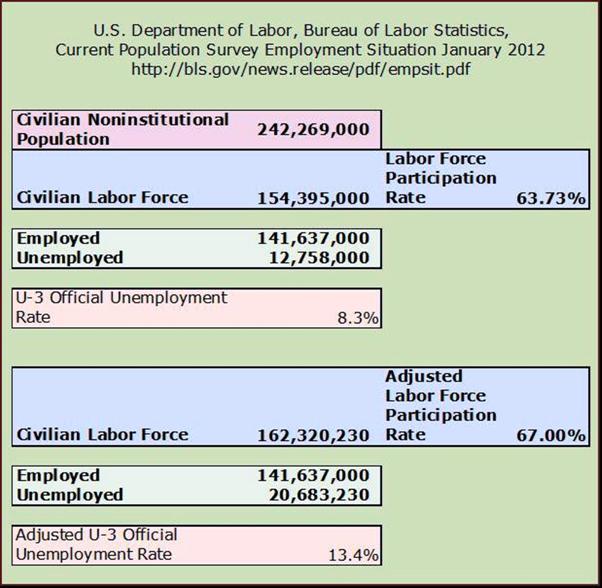
In 2000 the Annual Labor Force Participation Rate was 67.1%, and while it came down to 66% in 2008, it was fairly stable and actually moving back toward the 67% range in 2006 when it was at 66.2%. From 2008, when it was at 66.0%, it fell to 64.1% in 2011 (the actual, was 63.96% in December 2011). Adjusting to the 67% Labor Force Participation Rate of 2000, the unemployed number would go from 12,758,000 to 21,530,230. The U-3 (official) unemployment rate would go from 8.3% to 13.4%!!!
It's clear that the shrinking Labor Force Participation Rate is masking the true measures of unemployment – what we refer to as the 'very discouraged workers' – beyond even the discouraged workers, but looking deeper into the numbers, we wanted to see if the lower Labor Force Participation Rate is a permanent situation or if it has more to do with the weakened state of the current economy.
Digging first into the Civilian Noninstitutional Population, we see the affect that the baby-boomers (born from 1946 through 1964) have had on the population statistics as they have aged, advancing toward the more 'seasoned' end of the population continuum.
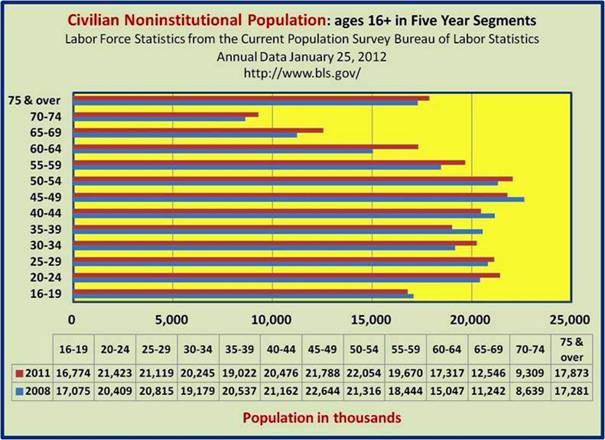
While the various five year segments (cohorts) have changed from 2008-2011, the overall Civilian Noninstitutional Population has grown by 5.8 million. Assuming a 66.7% Labor Force Participation Rate (Labor Force (unemployed and employed) as a percent of the Civilian Noninstitutional Population), the Labor Force should have expanded by 3.9 million; instead, the Labor Force fell by nearly 700,000.
Note:
While the various five year age segments (cohorts) have changed from 2008-2011, the overall Civilian Noninstitutional Population has grown by 5.8 million in that time. Assuming a 66.7% Labor Force Participation Rate (Labor Force as a percent of Civilian Noninstitutional Population), the Labor Force should have expanded by 3.9 million; in fact, the Labor Force fell by nearly 700, 000. The leading edge of the baby-boomers remained strongly represented in the Labor Force, but there's been a fall-off in the rate along the entire 16 - 54 year old range. At the very youngest of segments, the 16 - 24 year old in particular, the rate fell significantly, with some of the increase related to an increase in college enrollments.
Moving on to the Civilian Labor Force, we again see the effect that the baby-boomers (born from 1946 through 1964) have had. At first look, it would appear that the problem might be at the very youngest range of the labor force and toward the middle, but those ups and downs in the Civilian Noninstitutional Population and the Civilian Labor Force by themselves fail to paint a clear picture.
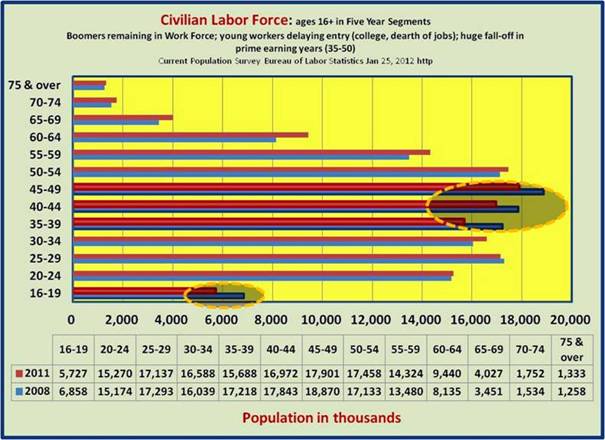
From 2008-2011, the Labor Force fell by nearly 700,000. The leading edge of the baby-boomers remained strongly represented in the Labor Force, there's been a fall-off in the 35-50 year range and the 16-19 year old segment.
It's only when we look at the individual segments that we begin to develop a more accurate idea of what has been going on with Labor Force Participation Rate.
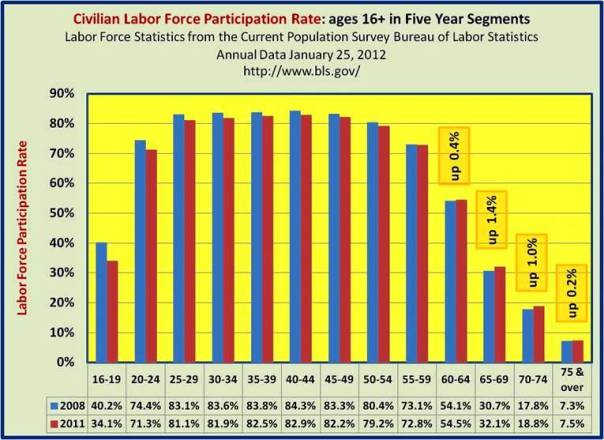
Contrary to conventional wisdom, the biggest hit to the Labor Force Participation Rate is from age 16 through 59. The grouping from 60 and older showed an increase in the participation rate from 2008 to 2011. Again, the overall Labor Force Participation Rate fell from 66% in 2008, 64.1 in 2011. Note that in January 2012, the Labor Force Participation Rate fell to 63.7%.
Beyond the distorted and what seems as understated unemployed numbers, the Labor Force Participation Rate reveals even more telling problems moving ahead. It's clear that the traditional retirement age of 65 is no more. Increasingly, older workers are either lingering in the workforce, or finding their way back in to it, whether due to income shortfalls, i.e., pensions and Social Security, desire to continue working, or simply because the workplace has become more conducive/accepting of older workers. Very soon, we will be delving into the topics of pensions and income. What has become abundantly clear is that in order to maintain its current lifestyle to support increasing demands on the federal budget from Medicare, Social Security, etc., Americans will have to work longer and the real tale of the tape is in the form of the Labor Force Participation Rate, not the Unemployment Rate.
…more to follow
