
2012 Volume Issue 16
June 11, 2012
For a downloadable version, click the following:
ARE WE PAINTING OURSELVES INTO A PROVERBIAL CORNER?
Our concern is for our future (both near and far) ability to conduct effective monetary policy and fiscal policy. Let’s examine the alarming data and the theoretical reasons for this concern.
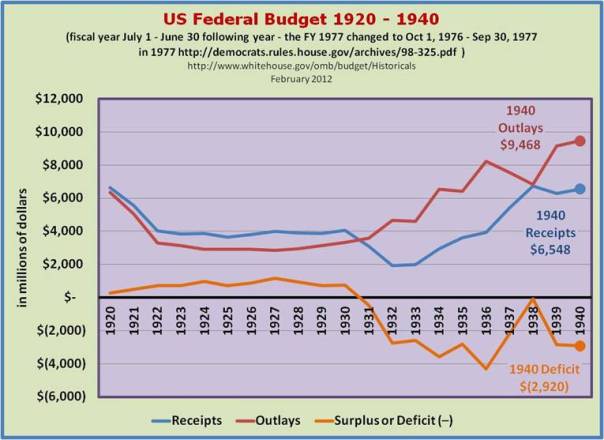
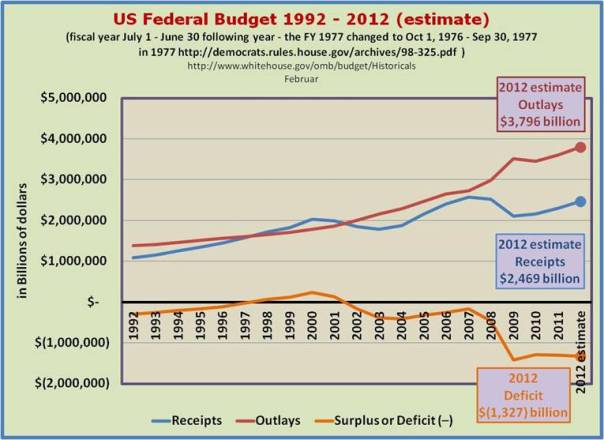
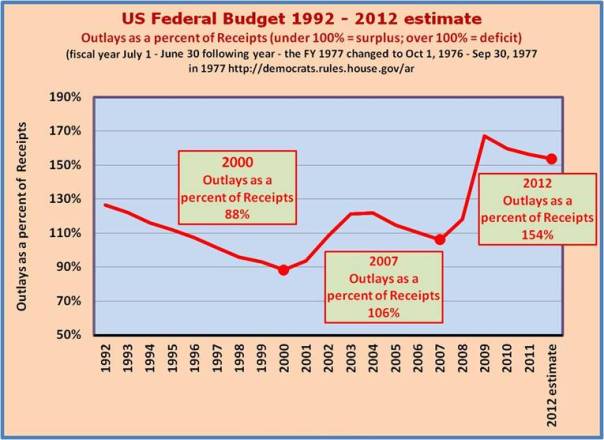
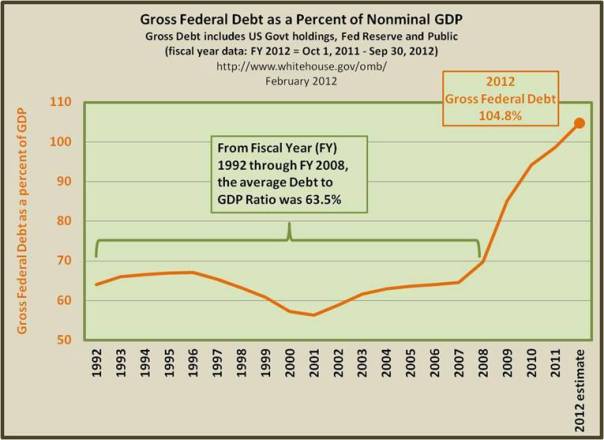
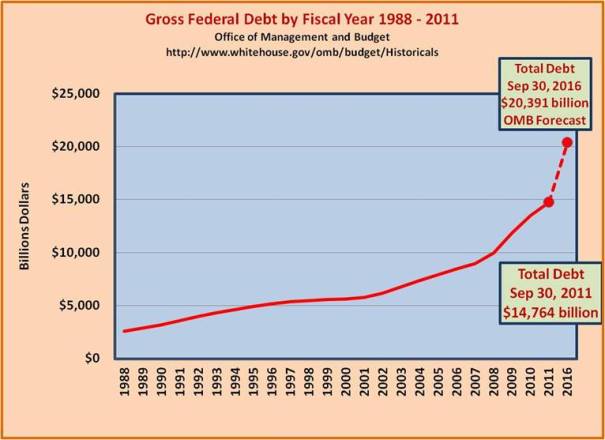
It is very clear that the U.S. federal government’s budgetary deficit has been careening out of control. This can be seen by examining the ratio of federal government debt to Gross Domestic Product (GDP) over the last 21 years. From fiscal year (FY) 1992 through FY 2008, the Gross Federal Government Debt to GDP averaged 63.5 percent. From FY 2009 through FY 2012 (estimate) the Debt to GDP ratio averaged 95.7 percent. For FY 2012 the ratio will go past 100% for the first time since 1948. The ratio is forecasted to climb to 107.8% within two years. This is the most popular measure for determining sovereign risk or the likelihood of a particular central government to default on its outstanding debt.
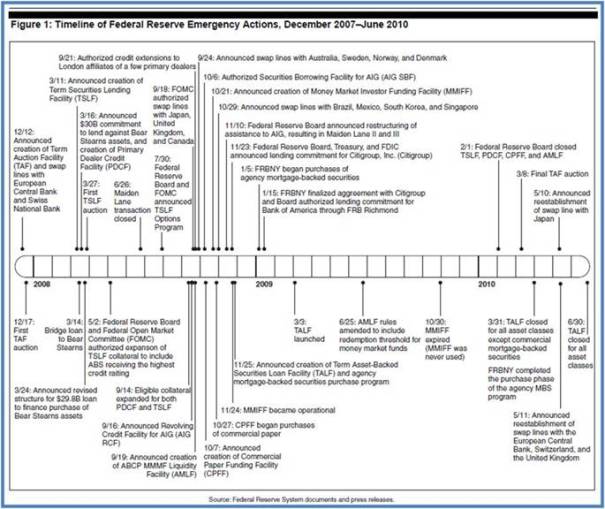
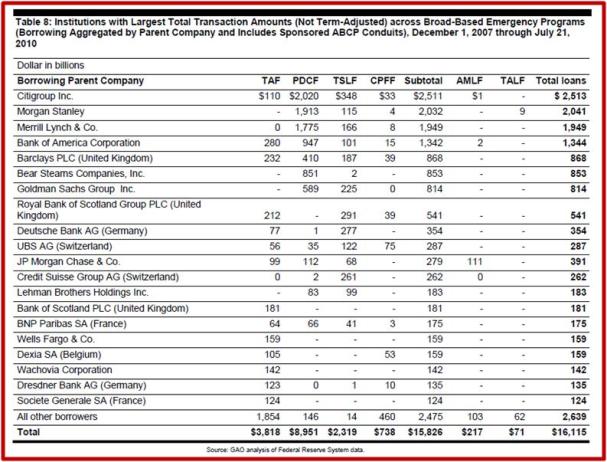
But these figures also tell us about the future conduct of U.S. monetary policy. Recall that the FED (Federal Reserve System, the central bank of the U.S.) has intervened in the market for both private sector debt as well as the debt of the federal government of the U.S. Does the term Maiden Lane strike a familiar chord? It was one of the FED’s programs, employed in its attempt to stabilize the financial system in the crisis that first surfaced in June–July 2007, when Bear Stearns bailed out its underperforming collateralized debt obligations to the tune of $3.2 billion, which proved to be only the tip of the tip of the iceberg related to the ‘subprime’ mortgage fiasco. It was followed up by Fed reaction to the blossoming crisis:
This view of Fed policy of constraint resulting in rising short–term rates abruptly changed when the largest French bank, BNP Paribas announced that it was unable to estimate the value of mortgage related asset backed securities of its investment companies. The Fed reacted very quickly, supplying funds to the financial markets through repurchase agreements, cutting the effective Federal Funds rate from an elevated 5.41% on August 9 to 4.54% on August 14, 2007.
August 27, 2007
Excessive Subprime Lending; or Misguided Monetary Policy – A Reasoned Critique
www.econnewsletter.com/aug272007
Maiden Lanes, I, II, and III
http://en.wikipedia.org/wiki/Maiden_Lane_Transactions
- Maiden Lane I – Bear Stearns collapse,
- triggered by heavy losses related to their mortgage related hedge funds beginning in July 2007, culminating in their collapse in March 2008 and takeover by JP Morgan Chase.
- Maiden Lane II and III – AIG collapse
- "After AIG was taken over by the U.S. government in September 2008 the holding companies Maiden Lane II LLC and Maiden Lane III LLC were created with $19.5 billion and $24.3 billion loans from Federal reserve."
In a succession of such moves, often referred to as bail outs, the Fed was trying to achieve at least two of several possible goals.
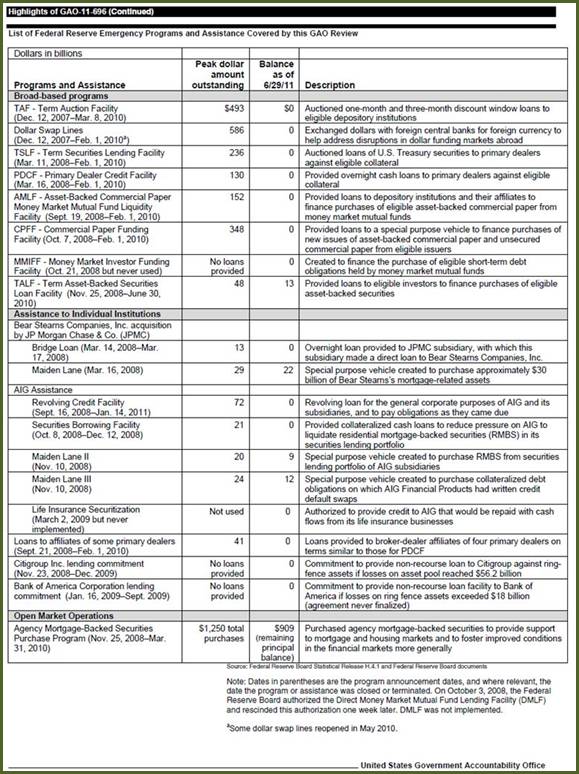
The Fed Audit by the GAO (Government Accountability Office)
July 2011
http://www.gao.gov/new.items/d11696.pdf
U.S. Senator Bernie Sanders, Vermont
www.sanders.senate.gov/newsroom/news
The first was to stem the tide of investors liquidating their fast shrinking investments. A second one was to halt the economic decline triggered by the financial crises by putting downward pressure on interest rates. While many criticize these moves on various grounds, the FED seems to have had some degree of success in achieving these goals.
One of the fears was that the FED was going to start an inflationary surge by ‘monetizing the debt’ and ‘running the printing presses’. As we explained in earlier newsletters on this website, the FED creates very little M–1 money (money as the medium of exchange) but rather when it purchases private or public sector debt, it increases the monetary base, a portion of which becomes the legal reserves of depository institutions (commercial banks and non–commercial bank depositories, the credit unions, savings banks and what is left of the savings and loan associations, formerly called the thrift institutions).
The increase in legal reserves of the depositories increases the capacity of these depositories to create M–1 money and credit. Nearly all of the M–1 money so created is in the form of checkable deposits (non–interest bearing demand deposits, and other usually interest bearing checkable deposits, namely, NOW accounts, credit union share drafts, and ATS accounts. Quite literally, the depositories create the checkable deposits, a liability of these depositories, and lend them out to the borrowers. Studies over time indicate that these checkable deposits facilitate nearly ninety percent of all transactions in the legitimate or above ground economy (variously estimated as somewhere between 70% and 900% of the total U.S. economy). Currency, nearly all of it in the form of paper money (nearly all of it being Federal Reserve Notes), facilitates nearly all of the transactions of the illegitimate or so called underground economy.
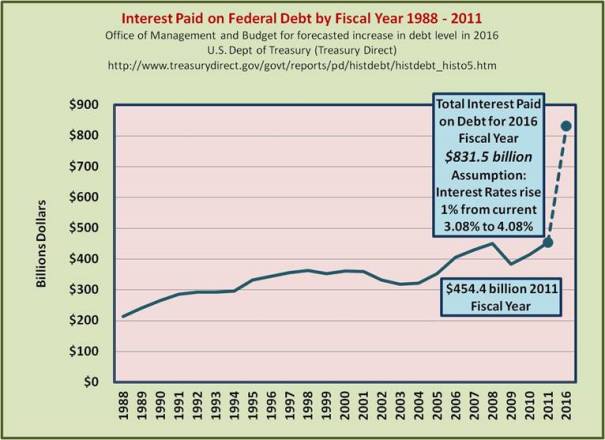
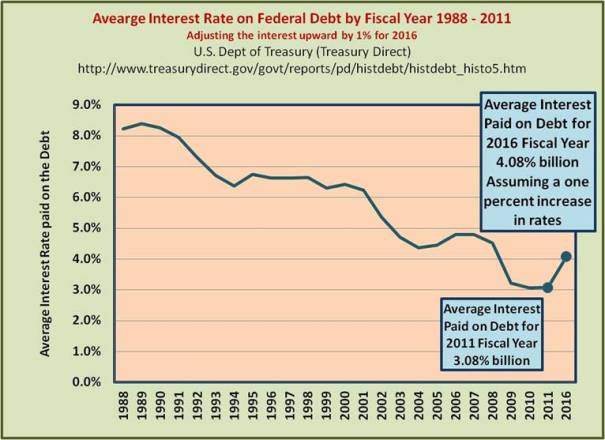
What is economically frightening about the low interest rates currently as a result of the FED’s policies to eliminate the ongoing financial and economic crisis is that it is masking the potential explosion of debt service as a result of the huge increase in federal budgetary deficits over the past few years and the data above shows.
If we take the average interest paid on the federal government debt as a percent of the outstanding federal debt back in those pre–crisis years and compare it to that metric currently, the difference is startling. Then if the pre–crisis yields are applied to the current level of debt, the debt service takes a quantum jump upwards. Then compare the debt service as a percent of total federal government expenditures for the pre–crisis years to the current one. You can begin to see the problem.
The depositories can use this increased capacity to create additional checkable deposit M–1 money and credit only if it seems to be profitable. In times of financial crisis in which we are currently wallowing, the regulatory authorities have postured themselves as protectors of these institutions preventing the depositories from accepting what these regulators deem as ‘excessive’ risks and can be reasonably accused as trying to micro manage rather than regulate these financial institutions. It is often a fine line of distinction between the two, regulating and micro managing. The net effect is that credit and money creation by depositories is very minimal and helping the stalled economy remain relatively stalled in terms of economic growth. This can be seen by observing the large volume of excess reserves which is a measure of the unused or excess capacity of these depositories.
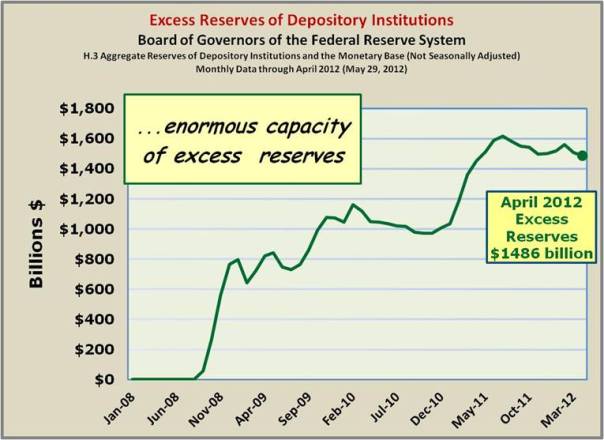
As the FED unwinds its earlier asset acquisitions, as it has been doing over the past few quarters, those excess reserves will gradually disappear. This will be a slow process if the FED wants to keep interest rates low, since given the huge federal deficit, continued purchases of U.S. Government securities will be necessary.
It is also clear that the impending tax increases to begin around this coming January will cause a complete stall in the weak to non–existent recovery we are experiencing.
Apparently the Keynesians out there have forgotten what they had learned from John Maynard. Tax rate increases of and by themselves reduce aggregate demand by reducing Disposable Personal Income and thus reduce private sector consumption and investment. Tax rate increases do not grow the tax base.
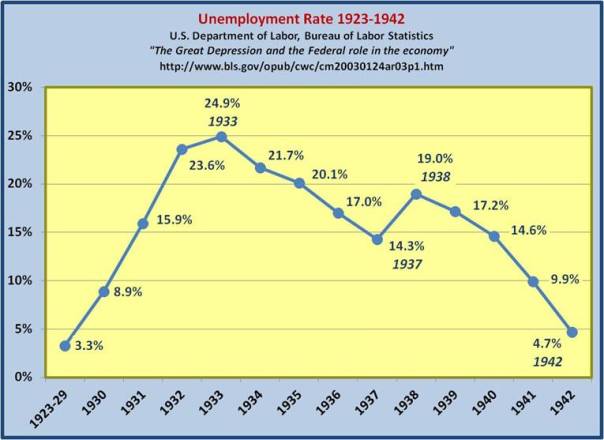
History is replete with failed attempts at bringing about a recovery with tax increases or federal government expenditure increases. Hoover and Roosevelt’s (FDR’s) early years and the dominance of Rubinomics of second term of Clinton are three such examples.
On the other hand, there are many examples of tax cuts stimulating economic recovery and growth such as Mellon’ policies under Harding, Reagan’s sponsored tax cuts as well as those engineered through Congress by George Bush II.
With the so–called Bush tax cuts scheduled to be eliminated this coming January by sunset provisions when they were originally enacted, and many other tax rate increases scheduled to be raised about then as well, an economic catastrophe is just around the bend. In a recent Congressional Budget Office report, the focus was on the impact on the U.S. economy of allowing the tax cuts to expire as well as new tax rate increase to become effective.
Economic Effects of Reducing the Fiscal Restraint That Is Scheduled to Occur in 2013
May 22, 2012
http://www.cbo.gov/publication/43262
How Substantial is the Fiscal Restraint in 2013?
CBO estimates that the combination of policies under current law will reduce the federal budget deficit by $607 billion, or 4.0 percent of gross domestic product (GDP), between fiscal years 2012 and 2013. The resulting weakening of the economy will lower taxable incomes and raise unemployment, generating a reduction in tax revenues and an increase in spending on such items as unemployment insurance. With that economic feedback incorporated, the deficit will drop by $560 billion between fiscal years 2012 and 2013, CBO projects.
With that Fiscal Restraint, What Will Economic Growth Be in 2013?
Under those fiscal conditions, which will occur under current law, growth in real (inflation–adjusted) GDP in calendar year 2013 will be just 0.5 percent, CBO expects—with the economy projected to contract at an annual rate of 1.3 percent in the first half of the year and expand at an annual rate of 2.3 percent in the second half. Given the pattern of past recessions as identified by the National Bureau of Economic Research, such a contraction in output in the first half of 2013 would probably be judged to be a recession.
How Would Eliminating or Reducing the Fiscal Restraint Affect the Economy in the Short Run?
CBO analyzed what would happen if lawmakers changed fiscal policy in late 2012 to remove or offset all of the policies that are scheduled to reduce the federal budget deficit by 5.1 percent of GDP between calendar years 2012 and 2013. In that case, CBO estimates, the growth of real GDP in calendar year 2013 would lie in a broad range around 4.4 percent, well above the 0.5 percent projected for 2013 under current law.
