
Sign up for our Newsletter
Please fill out the following:
2012 Volume Issue 6
March 9, 2012
For a downloadable version, click the following:
…a bit more compressed version of the PDF
The Civilian Noninstitutional Population: Focusing on the Labor Force (Employed & Unemployed) and Discouraged Workers
The Employment Challenge Ahead...
This morning, the Employment Situation for February 2012 was released by the U.S. Department of Labor, Bureau of Labor Statistics
Total nonfarm payroll employment rose by 227,000 in February, and the unemployment rate was unchanged at 8.3 percent, the U.S. Bureau of Labor Statistics reported today. [Note: The unemployment rate actually increased slightly to 8.27 percent (from 8.26% in January).] Employment rose in professional and businesses services, health care and social assistance, leisure and hospitality, manufacturing, and mining.
Note: there are two surveys employed by the Bureau of Labor Statistics to measure employment: the Household Survey (Current Population Survey) includes a sample from all households, while the Payroll Survey (Current Establishment Survey) includes data from larger companies, though narrower in focus, which submit monthly workforce data.
Down the Rabbit Hole (and Through the Looking-glass): Where Employment Rises and Unemployment also Rises???
In the following table, we summarize the current status of the Employment Picture and the monthly changes:
We'll get to the Labor Force Participation Adjustment in a bit (Item 3).
We're going to focus on a few items:
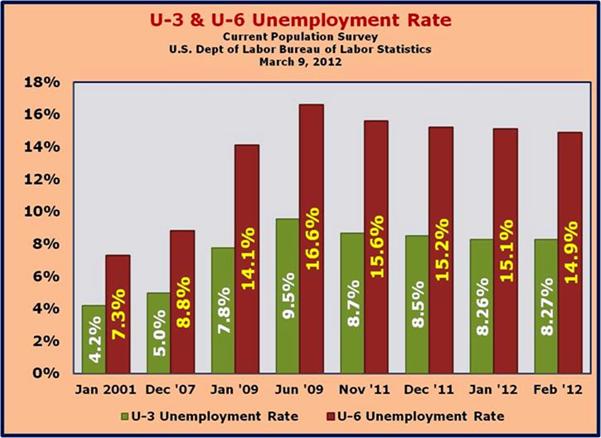
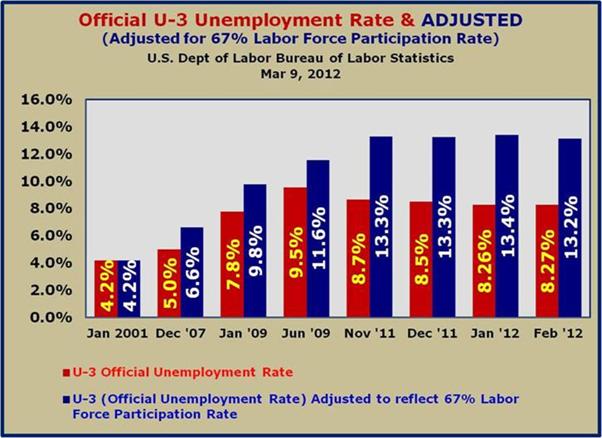
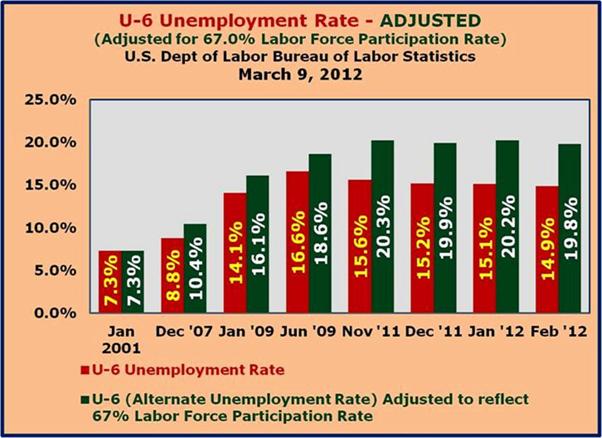
- U-3 Unemployment Rate or the Official Unemployment Rate and an alternative measure of unemployment, or the U-6 Unemployment Rate
- Encouraged Worker Effect? The Unemployment Rate rose slightly from 8.26% in January to 8.27% in February, a 0.1% increase. This is the first uptick in the Unemployment Rate since June 2011. The more inclusive U-6 Unemployment Rate dropped from 15.1% to 14.9%, a 0.2% decrease.
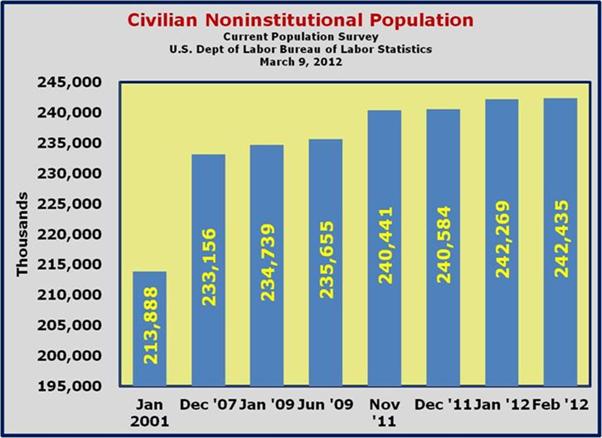
- Civilian Noninstitutional Population and its component parts
- The Civilian Noninstitutional Population (those persons 16 and over not in institutions, e.g., military, prison, etc.).
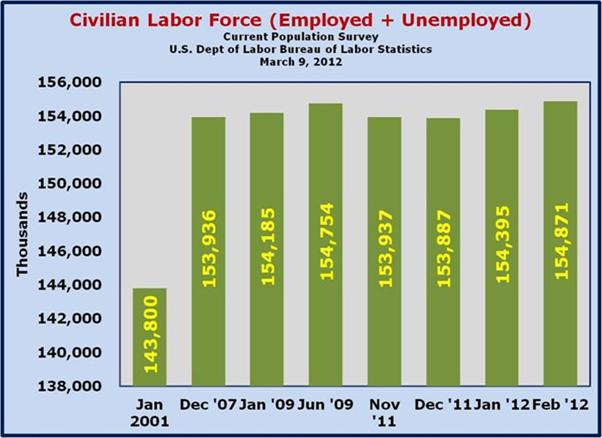
- Civilian Labor Force (those persons employed and unemployed)
- The Labor Force Participation Rate is the relationship between the Civilian Labor Force as a percent of the Civilian Noninstitutional Population.
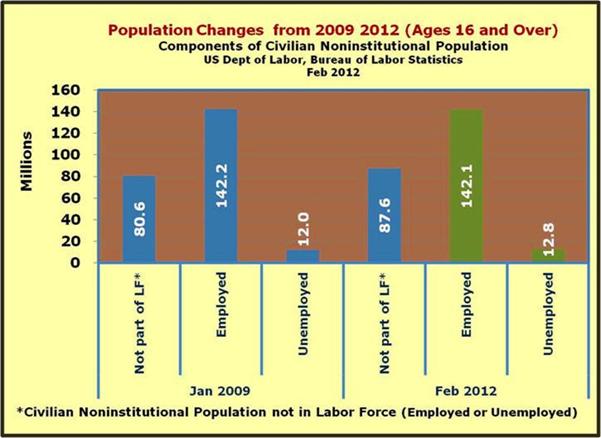
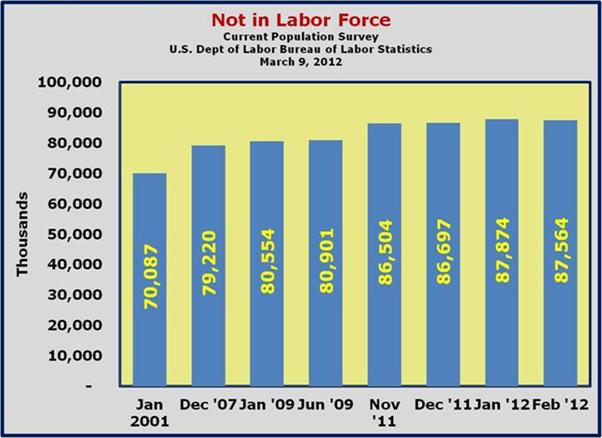
Since January 2009, employment has fallen slightly and Unemployment increased slightly, but the big difference is that 7 million Americans are on the sidelines, removed from the Labor Force!
January 2009
Civilian Noninstitutional Population = 234,739,000
- Labor Force = 154,185,000
- Employed = 142,201,000
- Unemployed = 11,984,000
February 2012
Civilian Noninstitutional Population = 242,435,000
- Labor Force = 154,871,000
- Employed = 142,065,000
- Unemployed = 12,806
Difference (Decrease)/Increase
- Civilian Noninstitutional Population = 7,696,000
- Labor Force = 686,000
- Employed = (136,000)
- Unemployed = 822,000
- Sidelined from Labor Force = [7,696,000 – 686,000] = 7,010,000
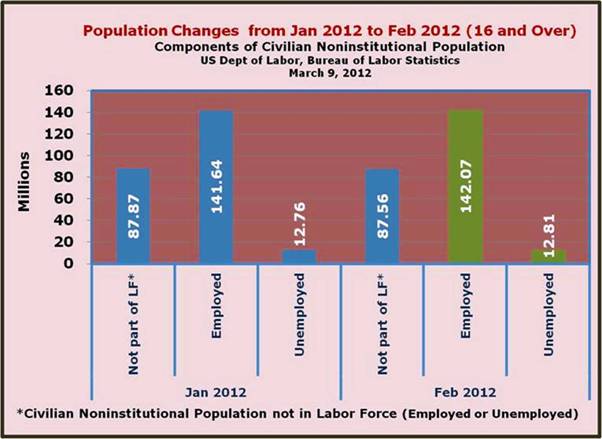
From January to February 2012, of those sidelined, not in the Labor Force 310,000 have moved back into the Labor Force. Employed rose by 428,000, but unemployed also rose by 48,000. How can this be?
- Civilian Noninstitutional Population rose by 166,000
- Civilian Labor Force rose by 476,000 (Civilian Noninstitutional Population 166,000 + 310,000 formerly sidelined [not in Labor Force])
- Employed increased by 428,000
- Unemployed 48,000 = Civilian Labor Force (476,000) – Employed (428,000)
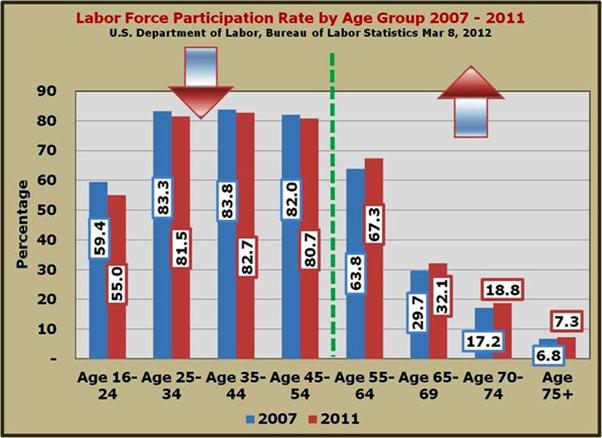
- Changes in the Labor Force Participation Rate
In previous newsletters we noted that while the Labor Force Participation Rate may have fallen off in the very youngest of cohorts (ages 16-24) due in part to more full-time enrollment in postsecondary education, the fact is that the Labor Force Participation Rate has dropped across the board, from age 16 through age 54. The surprising thing is that since 2007, the Labor Force Participation Rate has risen significantly for ages 55 and up.
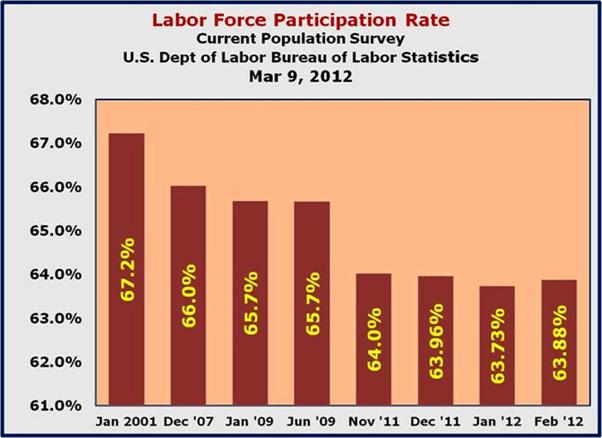
The Labor Force Participation Rate is the relationship between the Civilian Labor Force (those persons employed and unemployed) as a percent of the Civilian Noninstitutional Population (those persons 16 and over not in institutions, e.g., military, prison, etc.). The Labor Force Participation Rate was 63.88% in February 2012; the last time the rate was below 63.9% [prior to January 2012 63.7] was May 1983 (63.7%).
December 5, 2011
Labor force Participation RateThe labor force participation rate represents the proportion of the civilian noninstitutional population that is in the labor force. This measure of labor force activity grew from about 60 percent nationally in 1970 to about 67 percent in 2000, with much of the increase resulting from increased participation by women.
THE CHALLENGE AHEAD
The good news in terms of the overall employment picture is that in spite of increase an in the Unemployment Rate from January (8.26% to 8.27%) the Labor Force Participation Rate grew from 63.73% to 63.88% but consider the following:
In order for the unemployment rate to be at 8%, including a Labor Force Participation Rate of 66%, we would need to have 5 million more people employed. With an average increase in the Civilian Noninstitutional Population of 150,000 per month, it would take 24 months, adding 360,000 jobs every month to reach 8% unemployment and the 66% Labor Force Participation Rate.
