
2012 Volume Issue 12
May 4, 2012
For a downloadable version, click the following:
The Civilian Labor Force Participation Rate (LFPR) and its Continued Impact on the Employment Situation
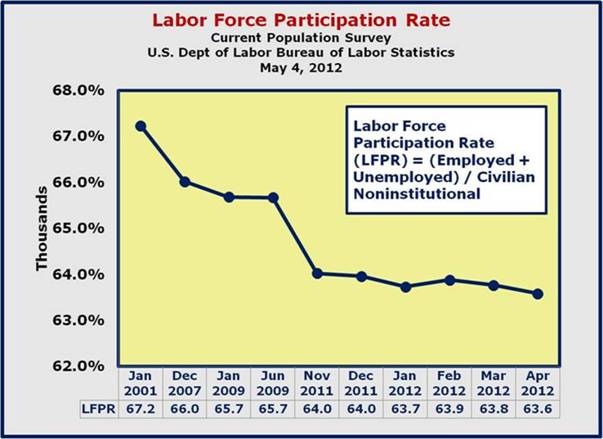
In the Employment Situation Report for April 2012, we find that the Civilian Labor Force Participation Rate (LFPR) came in at 63.6%, falling from the 63.8% LFPR reported in March 2012! The Labor Force itself shrank by an amazing 342,000 and the problem was further amplified by an increase in the Civilian Noninstitutional Population of 180,000. In effect, the ‘not in the Labor Force’ component of the Civilian Noninstitutional Population expanded by 522,000 resulting in the large drop in the Labor Force Participation Rate (LFPR = Civilian Labor Force divided by the Civilian Noninstitutional Population).
Keep in mind that we’ve been reporting on the significance of the Labor Force Participation Rate since May 2010 www.econnewsletter.com/may122010
www.econnewsletter.com/may122010archives
Is Full Employment No Longer A Realistic Goal for this Decade?
In April 2010, the Labor Force Participation Rate (Labor Force as a percent of Civilian Noninstitutional Population) = 65.2%; in December 2007, the rate was 66%.
The Bureau of Labor Statistics (BLS) typically releases the Employment Situation for the preceding month on the first Friday of the following month. As is the case when most reports come out, the media tends to focus on the Nonfarm payroll employment derived from the Current Employment Statistics – which rose by 115,000 in April 2012, and the U–3 Unemployment rate which dropped from 8.2% in March to 8.1% in April, was taken from the Current Population Survey.
The Establishment Survey (Payroll Survey or Current Employment Statistics) http://bls.gov/ces/
“Each month the Current Employment Statistics (CES) program surveys about 141,000 businesses and government agencies, representing approximately 486,000 individual worksites, in order to provide detailed industry data on employment, hours, and earnings of workers on nonfarm payrolls.” Keep in mind that the Current Employment Statistics or Establishment Payroll Survey focuses on larger, more traditional firms that report various statistics to the Department of Labor on a regular basis. Those statistics are used to track productivity, hours worked, etc, in addition to changes in employment. Many small businesses, self–employed, and the like are not included in this survey.
The Household Survey (Current Population Survey)
“The Current Population Survey (CPS) is a monthly survey of households conducted by the Bureau of Census for the Bureau of Labor Statistics. It provides a comprehensive body of data on the labor force, employment, unemployment, persons not in the labor force, hours of work, earnings, and other demographic and labor force characteristics.” The Current Population Survey or Household Survey includes the entire workforce, from the self–employed, farm workers all the way through employees at corporations.
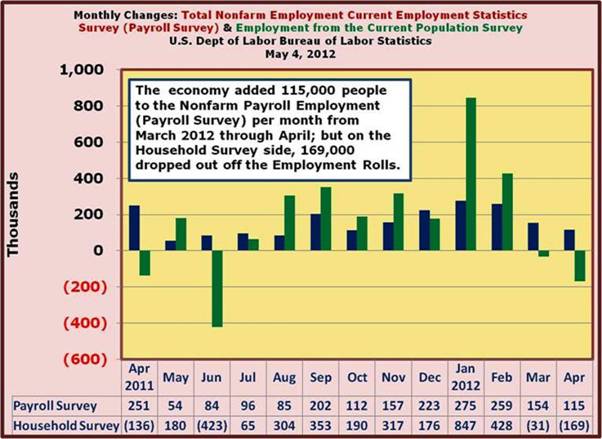
Since the lion’s share of employment ultimately flows through to the Payroll Survey it makes sense to monitor it closely. The problem arises when employment pool shifts toward the self–employed or non–measured portion of the Household Survey.
Comparing monthly employment changes in the Payroll and Household Surveys we find that while Nonfarm Employment rose by 115,000 the Employed in the Current Population Survey actually dropped by 169,000. What this indicates is that while there was growth in employment at traditional firms – good thing, the overall employment picture actually worsened, as employment in the Household Survey actually fell, overwhelming any good news from the payroll side – not a good thing.
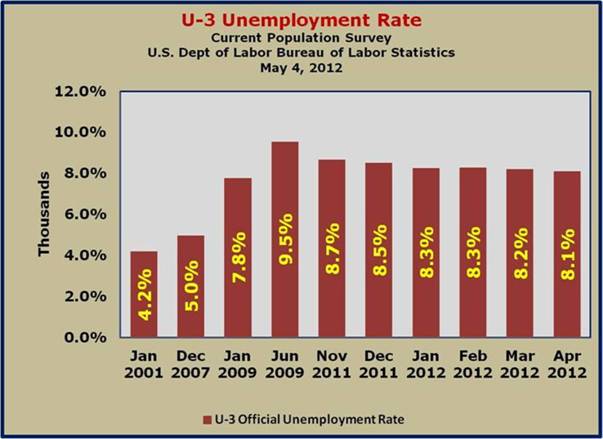
Moving on to unemployment, we found that the unemployment rate dropped from 8.2% in March to 8.1% in April, as indicated from the Current Population Survey. Is there a reason to celebrate? Not at all…

Stepping back one more time and focusing on the larger, more inclusive Current Population (Household) Survey, we will walk through the Employment Situation to sort out some of the mystery behind the numbers.
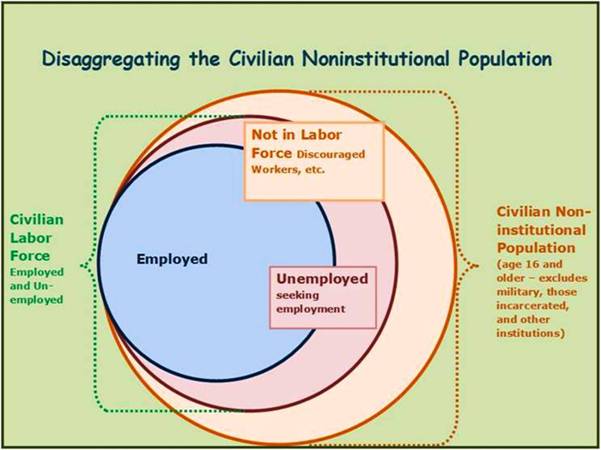
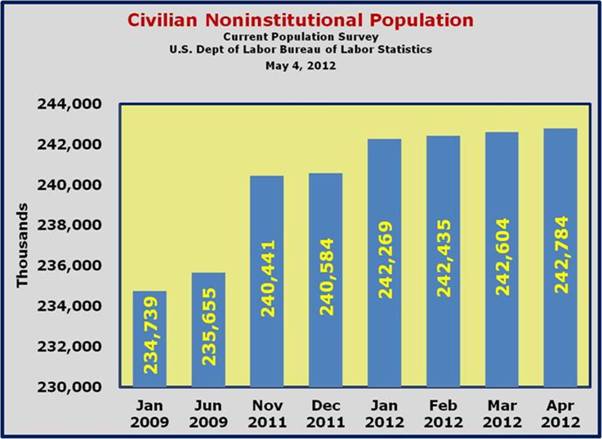
In the preceding chart, starting with the outer ring, we have the Civilian Noninstitutional Population which includes those Americans 16 years of age and older who are not in the military, incarcerated, or in other institutional categories. From March 2012 to April 2012 the Civilian Noninstitutional Population grew by 180,000.
The next ring inside of the Civilian Noninstitutional Population is the ‘Not in Labor Force’ component of the Current Population (Household) Survey. As the name implies, those people 16 years and older who are neither employed nor unemployed (Labor Force) are not counted in the labor force. Between March 2012 and April 2012 that number grew by 522,000 and resulted in a reduction in the Labor Force and likewise a fall–off in the Labor Force Participation Rate.
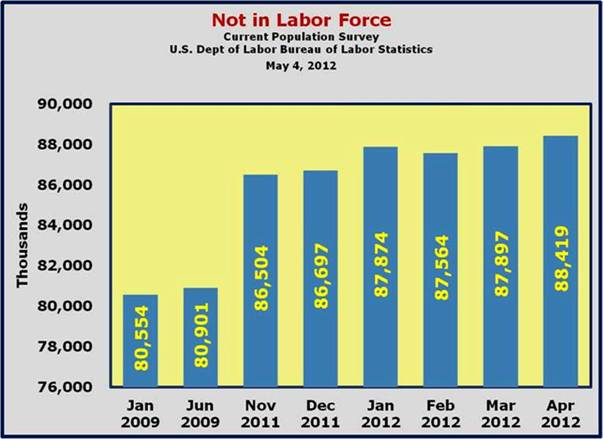
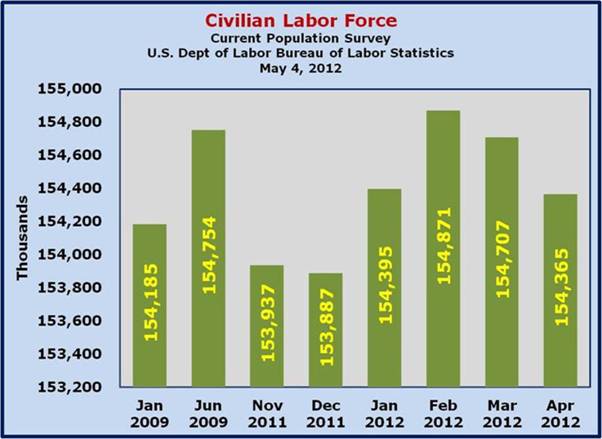
While the Civilian Noninstitutional Population expanded by 180,000 from March 2012 to April 2012 and the Not in the Labor Force grew by 522,000, it’s no surprise that the Labor Force (consisting of the employed and unemployed) contracted by 342,000 (change in Civilian Noninstitutional Population less the ‘Not in the Labor Force’).
As a result of the contraction of the labor force (and expansion of the Civilian Noninstitutional Population) it only makes sense that the Labor Force Participation Rate (LFPR) or the size of the Labor Force as a percentage of Civilian Noninstitutional Population would diminish as well.
In March 2012 the Labor Force Participation Rate (LFPR) was 63.8% and in April 2012 it fell to 63.6%!

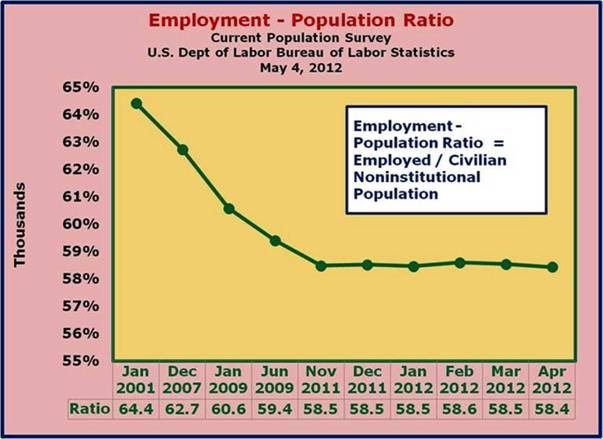
In addition to the shrinking Labor Force Participation Rate, we also have a deteriorating Employment–Population Ratio, which moved from 58.5% in March 2012 to 58.4% in April 2012.
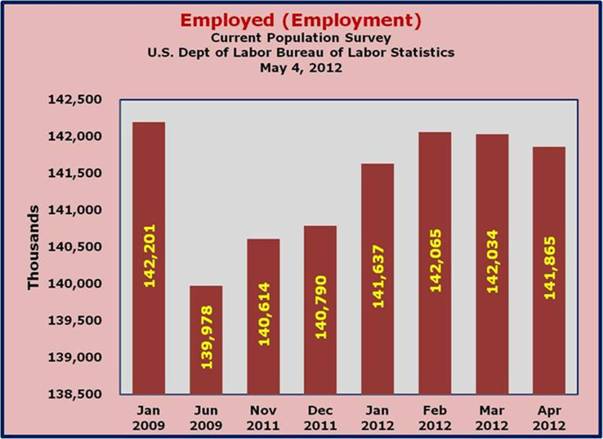
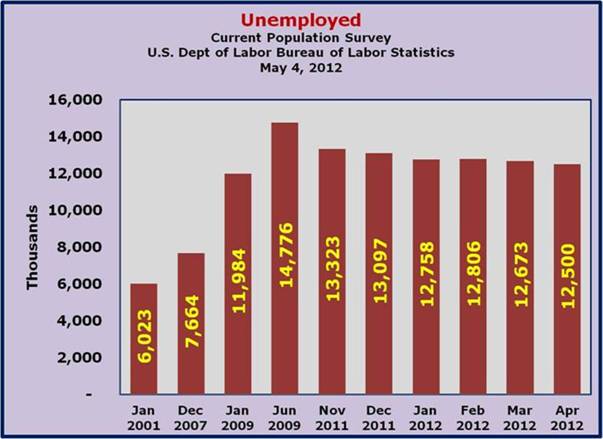
Within the shrinking Labor Force we have the two components from which we derive the U–3, or Official Unemployment Rate. First, we’ll look at the Employed, which dropped 169,000 from March 2012 to April 2012.
The other component of the Labor Force is Unemployment. The seemingly good news here is that the Unemployed dropped 173,000 from March 2012 to April 2012, and since the Employment also fell by 169,000 this combination lowered the Labor Force by 342,000, since the reduction in the unemployed did not translate in a higher employment figure. Again, since the U–3 Unemployment Rate (Official Unemployment Rate) is the unemployed as a percentage of the labor force, this lowered the Unemployment Rate from 8.2% in March 2012 to 8.1% in April 2012.
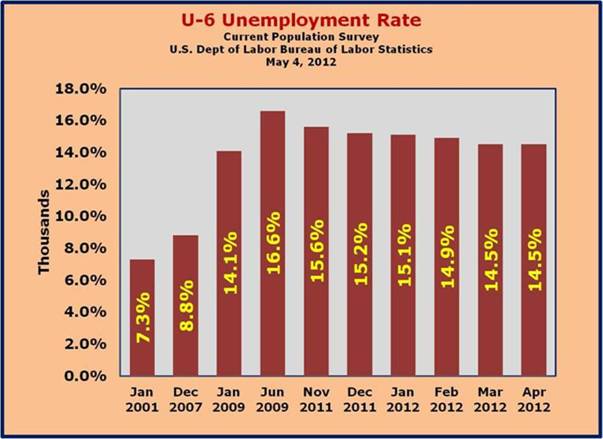
A more accurate measure of the unemployment rate would be to use the U–6 Unemployment Rate, which is defined as: U–6 Total unemployed, plus all persons marginally attached to the labor force, plus total employed part time for economic reasons, as a percent of the civilian labor force plus all persons marginally attached to the labor force.
The U–6 measure of the Unemployment Rate remained unchanged at 14.5% from March 2012 to April 2012.
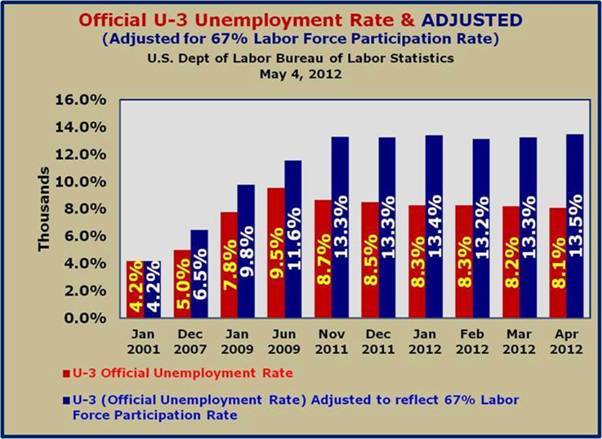
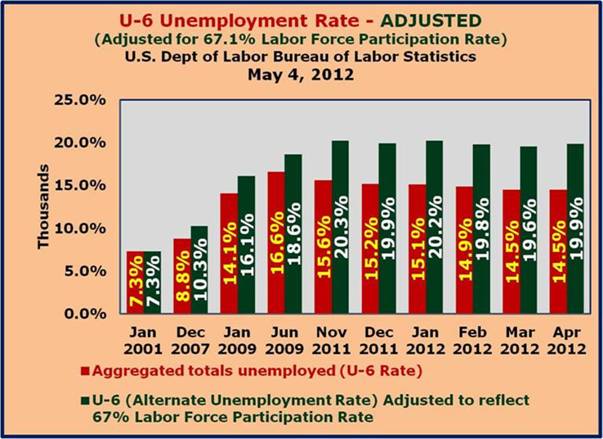
In previous newsletters, we adjusted the unemployment rates to reflect what the U–3 and the U–6 Unemployment Rates would be if the Labor Force Participation Rate was 67% as it was in the early 2000s. The main thrust is that when the Labor Force Participation Rate falls, it moves large numbers of discouraged workers from the labor force into the ‘Not in Labor Force’ portion of the Civilian Noninstitutional Population.
If the Labor Force Participation Rate was 67%, the official U–3 Unemployment Rate would have registered at 13.5% in April 2012.
Likewise, the U–6 Unemployment Rate, which includes marginally attached, underemployed and part–time workers (who would prefer to be full–time), would be significantly higher. The adjusted U–6 Unemployment Rate would have come in at 19.9% in April 2012.
Whether the adjustment is 67% or some other number, the higher rates pick up discouraged workers and those who we refer to as very discouraged workers.
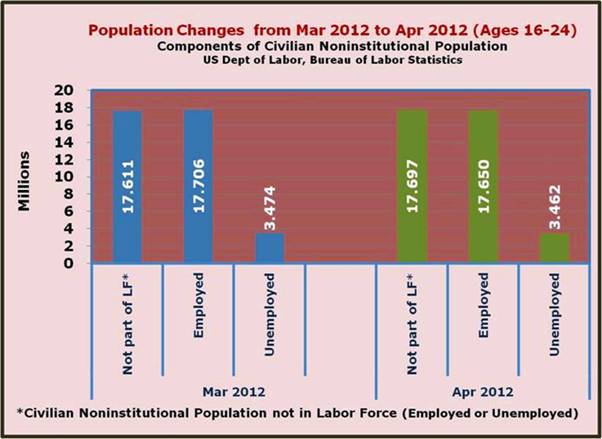
To illustrate this, while the Civilian Noninstitutional Population expanded by 180,000 and many of these people would be in the 16–24 age bracket.
Between March 2012 and April 2012:
- The ‘Not in the Labor Force’ increased by 86,000 ––– since the group is so young, many have never made into the Labor Force at all
- Employment fell by 56,000
- Unemployment fell by 12,000
In summary, while the Current Employment Statistics (CES) (Payroll Survey) is helpful in measuring changes in Nonfarm Payroll Employment, it is actually a subset of the Employment statistics in the Current Population Survey (CPS) (Household Survey) and as such can only be used to gauge changes in employment within the context of the survey. As noted in the April 2012 Employment Situation: Employment increased in professional and business services, retail trade, and health care, but declined in transportation and warehousing. The good news was that Nonfarm Payroll Employment expanded by 115,000.
Looking at the Employment Situation from the Current Population Survey (Household Survey) presents a much darker picture. While the Civilian Noninstitutional Population grew 180,000, the Labor Force (–169,000 Employed and –173,000 Unemployed) fell by 342,000. This swing resulted in a deterioration in the Labor Force Participation Rate from 63.8% in March 2012 to 63.6% in April 2012. Simply put, a continued shrinking labor force does not bode well for the economy. Without an expanding labor force, it is impossible for the economy to grow sufficiently, it is impossible to provide a framework for an equitable income distribution, and it is impossible to provide tax revenue to even sustain current government programs at the local, state and federal level.
We are continuing to move in the wrong direction!
