2012 Volume Issue 24
Economic Newsletter for the New Millennium
November 17, 2012
For a downloadable version, click the following:
…a bit more compressed version of the PDF
Moving the Jobs Needle: Where the heck are we, really? Where do we have to go and how do we get there?
PROLOGUE
There have been many numbers kicked around regarding the state of the employment picture over the last few years. We’ve been focusing on the Labor Force Participation Rate in particular since May 2010.
Is Full Employment No Longer A Realistic Goal for this Decade?
www.econnewslettermay122010blog.com/
We noticed that the Labor Force Participation Rate (LFPR) had fallen from a fairly steady 66% rate prior to the recession and was continuing to deteriorate well after it was over. The LFPR measures the ratio of the Labor Force (Employed and U-3 Unemployed; where the unemployed are those people actively seeking employment) and the Civilian Noninstitutional Population (that portion of the population 16 years and older who are not in institutions: military, incarcerated, etc.).
The significance of the LFPR is that it sheds some light on how many people are actually engaged in the process of either contributing (employed) or attempting to contribute (unemployed) to economic activity in terms of their labor. The importance of this measure reveals itself in good times in that we see a robust LFPR, which was 66% or better from 1989 through 2008, accompanied by a relatively low unemployment rate.
When the economy, and the employment picture is not fairing all that well, you might still see a high Labor Force Participation Rate, but the poorer performance is revealed in the national unemployment rate as it was from 1990 through 1992 when the readings were 6.8%, 7.5%, and 6.9%, respectively. In spite of those relatively high unemployment rates, the LFPR read above 66% for all three years. What this reveals is that while the poor economy displaced many workers, for the most part, those individuals continued to seek employment. The same occurred in 2002 and 2003 when the unemployment rate rose to 5.8% and 6.0%, but the LFPR remained above 66%.
Beginning in 2009, the annual unemployment rate ranged between 8.9% and 9.6% (9.3% 2009; 9.6% 2010; and 8.9% for 2011). In that same time frame, the LFPR went from 65.4% to 64.1%. While the unemployment rate was extremely high, the formerly solid LFPR dropped like a rock from the 66% level. What this means is that millions of Americans simply dropped out of the labor force; they were effectively sidelined because there was no hope of finding employment.
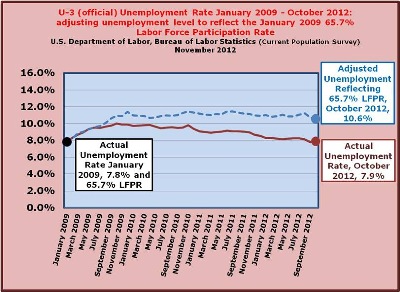
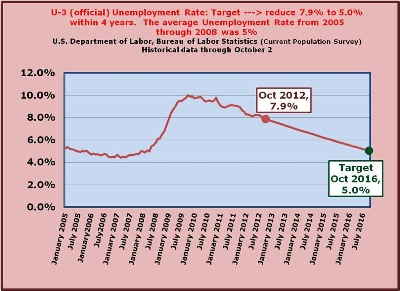
In 2012 the unemployment rate fell to 7.9% in October, but the Labor Force Participation Rate had also fallen below 64% (63.8% in October 2012). By merely adjusting the Labor Force Participation Rate to the January 2009 level of 65.7%, we see that the unemployment rate would have come in at a staggering 10.6%.
EXECUTIVE SUMMARY
The web and traditional media sources abound with pessimism about the economy and the job outlook. We suggest that the reader of this newsletter review the following studies and other very recent releases after reading this newsletter.
Choices for Deficit Reduction November 8, 2012
The fiscal cliff: what’s confronting corporate America? November 14, 2012
Challenger, Gray, and Christmas
OCTOBER JOB CUTS JUMP 41% TO 47,724 November 1, 2012
Fiscal Cliff: What Congress Should Do November 14, 2012
What Are Economists Really Saying About Tax Rate Increases? November 13, 2012
The remainder of this newsletter is an examination of the past and current employment picture as well as what employment growth is needed to attain the pre-recession levels of the employment and unemployment rates, the labor force participation rate and the employment population ratio. We conclude with the divergence of what is needed and what will likely occur in terms of achieving the pre-recession goals.
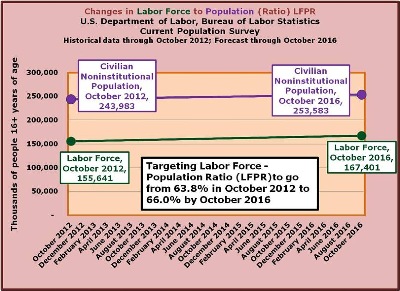
Goals to be achieved by October of 2016
- Unemployment Rate: 5.0% (The average Unemployment Rate from January 2005 through December 2008 was 5.0%)
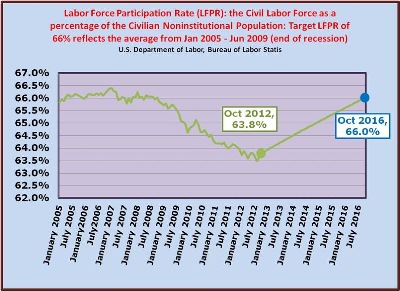
- Labor Force Participation Rate (LFPR): 66.0% (The average Labor Force Participation Rate from January 2005 through December 2008 was 66.1%)
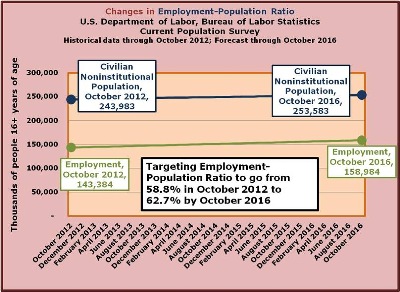
- Employment-Population Ratio: 62.7% (The Employment-Population Ratio rate was 62.7% at the end of 2007)
Labor Report Ratio driver requirements to achieve these goals (through October 2016):
- Civilian Noninstitutional Population 200,000 per month for a total of 9,600,000 per for 48 months
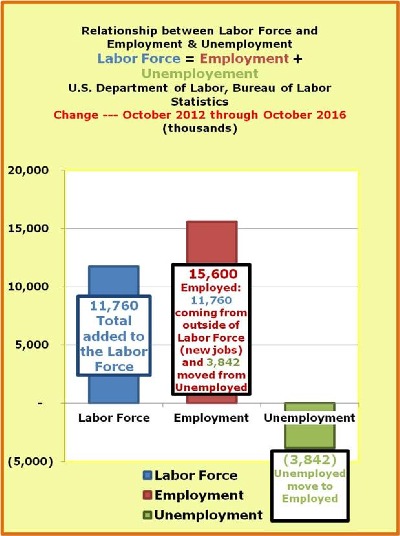
- Labor Force 245,000 per month for a 48 month total of 11,760,000
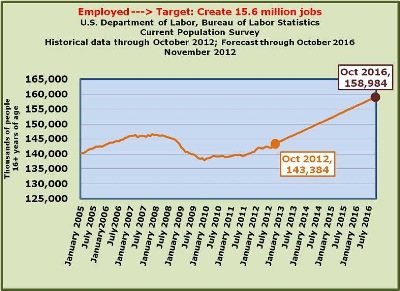
- Employment 325,000 per month for a 48 month total of 15,600,000
- Unemployed dropping by 80,000 per month for a 48 month total reduction of 3,841,000
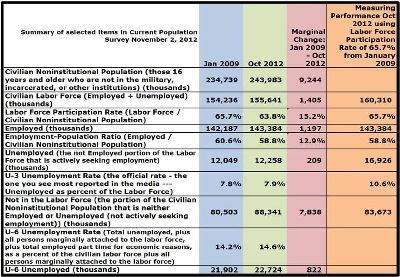
More recent experience - January 2009 through October 2012:
- Unemployment Rate: January 2009 7.8% - October 2012 7.9%
- Labor Force Participation Rate (LFPR): January 2009 65.7% - October 2012 63.8% Note: we experienced a devastating 15.2% marginal Labor Force Participation Rate for that 46 month period from January 2009 through October 2012 (taking 1,405,000 of the Labor Force change and dividing it by the 9,244,000 in the population growth).
- Employment-Population Ratio: January 2009 60.6% - October 2012 58.8%
Labor Report Ratio driver requirements (January 2009 October 2012):
- Civilian Noninstitutional Population 201,000 per month for a total of 9,244,000 per for 46 months
- Labor Force 30,500 per month for a total of 1,405,000 over 46 months
- Employment 26,000 per month for a 46 month total of 1,197,000
- Unemployed rising 4,543 per month for a 46 month total of 209,000
Delving into the data - the employment picture: past, present and where we need to go in the future
In the following, our aim is to layout an overview of what has transpired in the U.S. employment picture over the last few years, highlighting two primary federal government sources used in measuring performance in the labor markets: the Current Population Survey (Household Survey), a monthly report from the Census Bureau sampling 60,000 households; and the Current Employment Statistics (Payroll Survey) from the Bureau of Labor Statistics, which draws data from 140,000 firms (410,000 work sites).
As you go through our presentation, please keep in mind that the objective is to understand the employment situation in terms of where we’ve been, where we are now, and where we would like to be looking forward […where we’re likely to go]. For our presentation we use a 4-year window, targeting a 5.0% Unemployment Rate and a 66% Labor Force Participation Rate (LFPR).
You can re-rack the numbers, or alter the window as you see fit, but just as the so-called fiscal cliff lies directly in front of us, scaling up the other side of the employment escarpment (we’ve already fallen into one side of the employment escarpment/ditch… now how do we get up the other side?) is something that must be addressed as well, and is certainly a major part of the solution in dealing with the fiscal side in the longer term.

There are many reasons why we’ve fallen into this terrible employment situation with high unemployment and an abysmally low LFPR, ranging from structural changes resulting from early retirements (from baby-boomers), increased levels of awarding disability (SSDI) to an unfavorable business climate, where the ‘risk and payback’ of hiring more employees is simply not feasible or responsible for firms.
The point is that you can plug in any numbers you want going forward, but the real issue is how are we going to make this happen? We’ll get to that at the end of the article.
The lay of the land…January 2009 through October 2012 - descending to the bottom of the ditch, but not scaling the other side
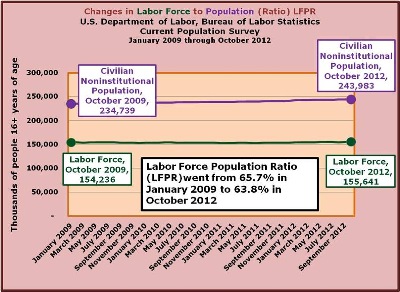
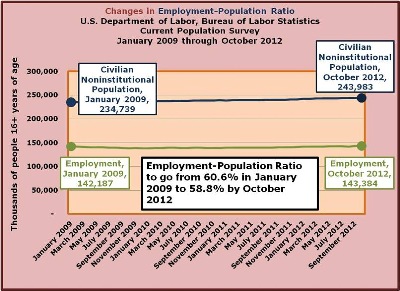
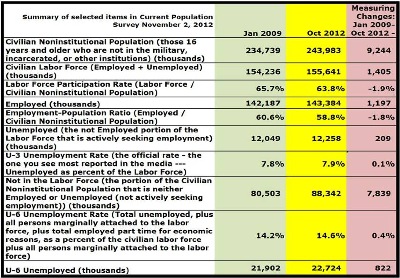
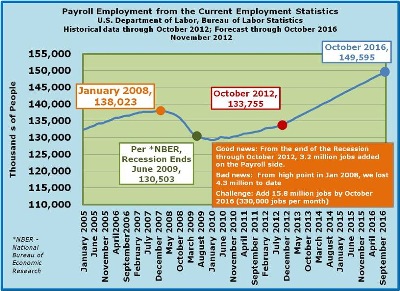
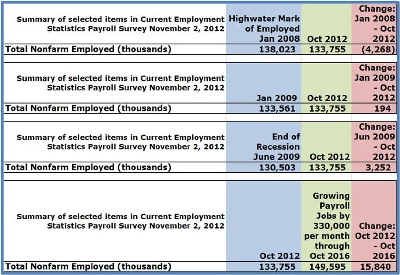
The Noninstitutional Civilian Population stood at 234,739,000 in January 2009. This includes those 16 years and older who are not in the military, incarcerated, or otherwise institutionalized. By October 2012, the Noninstitutional Civilian Population registered 243,983,000 for an increase of 9,244,000 or 201,000 per month [46 months from Jan 2009-Oct 2012]
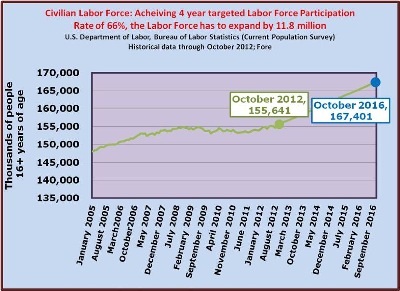
The Civilian Labor Force, which counts those from Civilian Noninstitutional Population that are either employed or unemployed seeking employment was 154,236,000 in January 2009. By October 2012, the Civilian Labor Force included 155,641,000 persons, increasing the labor force by only 1,405,000 (30,500 per month) --- keeping in mind that the above the population grew by 9.2 million.
In April 2010, we first began noticing problems with the Civilian Labor Force Participation Rate (LFPR) which is the relationship between the Labor Force as a percent of the Civilian Noninstitutional Population. It was 65.7% in January 2009 and dropped to 63.8% in October 2012. By focusing on the marginal change in the LFPR, taking 1,405,000 of the Labor Force change and dividing it by the 9,244,000 in the population growth we see a devastating 15.2% marginal Labor Force Participation Rate for that 46 month period from January 2009 through October 2012. In summary, from January 2009 through October 2012, the labor force expanded by 0.91%, while the Civilian Noninstitutional Population grew by 3.94%.
Is Full Employment No Longer A Realistic Goal for this Decade?
www.econnewslettermay122010blog.com/
In April 2010, the Labor Force Participation Rate (Labor Force as a percent of Civilian Noninstitutional Population) = 65.2%; in December 2007, the rate was 66%.
The Employed numbered 142,187,000 in January 2009. It grew to 143,384,000 by October 2012, increasing 1,197,000, or 26,000 jobs per month, well below the required 125,000 new jobs to just to keep pace with average new monthly Civilian Noninstitutional Population entrants numbering 201,000 (the LFPR was 65.7% in January 2009 and dropped to 63.8% in October 2012).
The Employment-Population Ratio, which is the employment number divided by the Civilian Noninstitutional Population, registered 60.6% in January 2009 and dropped to 58.8% in October 2012. Again, by focusing on the marginal change in the Employment-Population Ratio, taking the 1,197,000 improvement in Employment and dividing it into the 9,244,000 in the population growth we see an anemic 12.9% marginal Employment-Population Ratio for that 46 month period from January 2009 to October 2012.
This important ratio [Employment-Population Ratio] is watched closely by the Federal Reserve (among others) to get a feel for the health of the labor markets.
On February 2, 2012 Federal Reserve Chairman, Ben S. Bernanke, Before the Committee on the Budget, U.S. House of Representatives:
www.federalreserve.gov/newsevents/testimony/bernanke20120202a.htm
Nevertheless, as shown by indicators like the rate of unemployment and the ratio of employment to population, we still have a long way to go before the labor market can be said to be operating normally.
Bernanke Seen Not Knowing Jobless Rate Below Fed Forecasts
March 19, 2012
[following excerpt from interview with 59 year-old David Waldrop, unemployed]
"There was certainly nothing in my area at my level," he said. While the right opening might pull him back to employment, for now he sees his exit from the U.S. labor force as permanent. "I don’t see it happening," he said. "I don’t see anything offering opportunities.
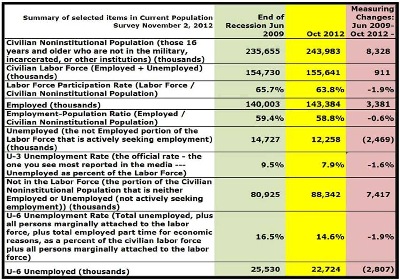
Waldrop is one of millions who have dropped out of the labor market in the aftermath of the deepest recession since the Great Depression, causing the employment-to-population ratio to fall to 58.6 percent from 62.7 percent at the end of 2007. Federal Reserve Chairman Ben S. Bernanke says the decline reflects weakness in the economy that’s causing discouraged Americans to leave the workforce, bolstering his decision to add to his record monetary stimulus in January.
The Unemployed (the not employed portion of the Labor Force that is actively seeking employment) stood at 12,049,000 in January 2009 and would eventually top out at 15,221,000 in May 2010, eleven months after the end of the recession which, according to the National Bureau of Economic Research (NBER) began in December 2007 and concluded in June 2009. The Unemployment Rate (Unemployed divided by the Labor Force) stood at 7.8% in January 2009 and continued to climb to a high of 10.0% in October 2009. While the unemployment rate has dropped back to 7.9% (12,258,000 unemployed) in October 2012, if we were to use the Labor Force Participation Rate of 65.7% from January 2009, this would drive the unemployed number up to 16,926,000 and the Unemployment Rate to 10.6%.
The expression, ‘Not in the Labor Force’ is the portion of the Civilian Noninstitutional Population that is neither employed nor unemployed (not actively seeking employment). In January 2009 it measured 80,503,000 and rose to 88,342,000 in October 2012, a 9.7% increase, or 7.8 million people. These people ‘not in the Labor Force’ include those who merely gave up looking for work, those who opted to retire rather than settling for jobs paying much less (or more likely, the jobs simply were not there), people who pursued and achieved disability status that wouldn’t have otherwise done so in a better job market, many young people who have never really been able to gain traction in such a weak job market, and many more people who lost their jobs, ran through their unemployment benefits and have been out of the labor force for many months, if not years.
At the end of the day, if the Labor Force Participation Rate of 65.7% from January 2009 were to be applied to the October 2012 Civilian Noninstitutional Population, the ‘Not in Labor Force would have dropped by 4.7 million from 88,341,000 to 83,673,000.
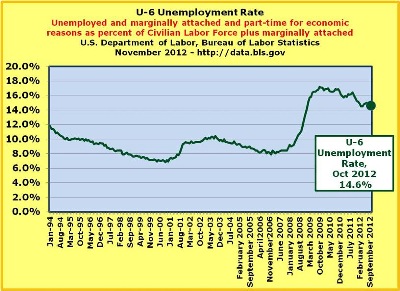
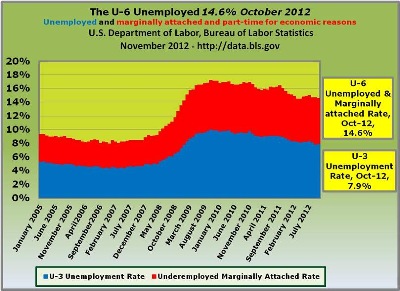
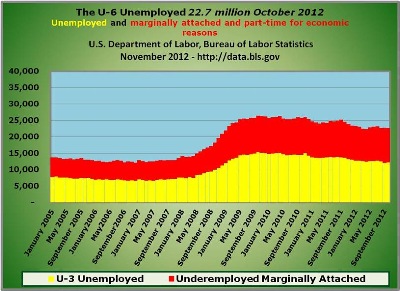
Lastly, the U-6 Unemployment Rate (Total unemployed, plus all persons marginally attached to the labor force, plus total employed part time for economic reasons …and discouraged workers) was at 14.2% which numbered 21,902,000 for the U-6 Unemployed in January 2009. The U-6 rate peaked at 17.6% in October 2009 and the unemployed in this category registered 26.5 million in that same month. The good news is that the U-6 Unemployment Rate came in at 14.6% in October 2012 while the U-6 Unemployed numbered 22,724,000. Just the same, while the October 2012 number is an improvement over October 2009, it is higher than the January 2009 number by a total of 822,000.

As we mentioned earlier, the National Bureau of Economic Research (NBER) declared that the recession ran from December 2007 until June 2009. With that in mind, at first glance it’s interesting to note that since the end of the recession, while employment rose by 3.4 million and unemployment fell by 2.5 million, the Labor Force only grew by 911,000 even though the Civilian Noninstitutional Population expanded by 8.3 million.
What this boils down to is that if the Labor Force Participation Rate had remained at 65.7% from January 2009, rather than falling to 63.8% in October 2012, the Unemployed would have actually risen by 2.1 million, rather than falling by 2.5 million and again, the unemployment rate would have gone from 9.5% to 10.6%.
In formulating a plan for moving forward we have to understand what the road ahead should look like. We put together a similar roadmap in May 2010, where we indicated it would take roughly 15 million jobs added over 6 years (May 2010 through April 2016) to reach 5% Unemployment Rate and 66% Labor Force Participation Rate. Both rates were reasonable readings prior to the recession. The average Unemployment Rate from January 2005 through December 2008 was 5.0% and the Labor Force Participation Rate for the same period was 66.1%.
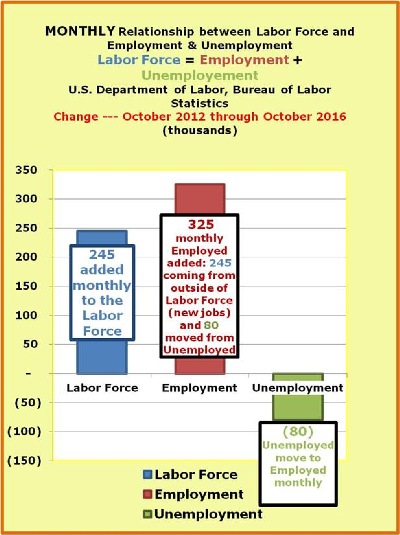
The job growth in the Current Population Survey averaged 244,000 per month from January 2005 through December 2006. We are using 325,000 job growth per month over 48 months from November 2012 through October 2016. While the 325,000 job growth per month seems to be a bar set high, we wanted put the ‘recovery’ into some framework so we picked a four-year window.
On another note - we will discuss this further…the 325,000 growth in Employment becomes more realistic when we consider:
- Labor Force is targeted to grow at a monthly rate of 245,000 per month and reflects total ‘new’ job entrants [coming into the Labor Force].
- Reducing Unemployment by 80,000 per month, which when combined with the 245,000 new additions to the Labor Force per month equates with the 325,000 increase in monthly Employment.
Moving Forward…
October 2012 through October 2016 - the objective is to scale the other side of the labor market escarpment
First - a look at moving the needle on the Labor Force Participation Rate from 63.8% in October 2012 to 66.0% in October 2016
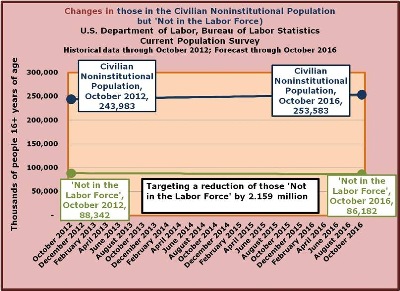
Let’s begin with the October 2012 Noninstitutional Civilian Population of 243,983,000. The assumption is that the economy will on average add 200,000 16+ year-olds per month over 48 months from October 2012 through Oct 2016, for an added 9,600,000 to reach 253,583,000.
The Civilian Labor Force, which counts those from Civilian Noninstitutional Population that are either employed or unemployed seeking employment starts at 155,641,000, and targeting a 66.0% Labor Force Participation Rate, the labor force would have to grow by 11,760,000, or average 245,000 per month over 48 months to reach 167,401,000 in October 2016.
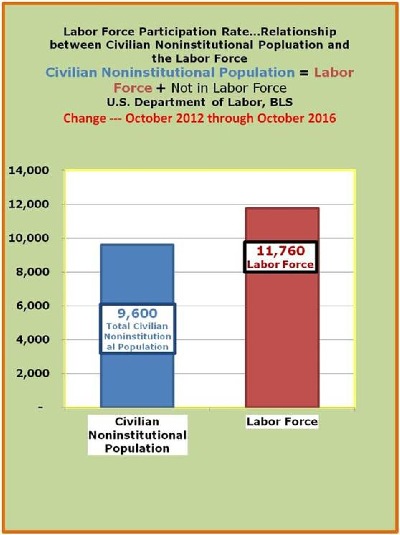
In 2012, the Civilian Labor Force Participation Rate (LFPR) was at 63.8%. We’re targeting a 66.0% rate by October 2016, which would require adding 15.6 million jobs while at the same time reducing unemployment by 3.8 million. Since the Labor Force equals the total of employed and unemployed, we add 15.6 million employed to a negative 3.8 million unemployed to arrive at 11.8 million for the Civilian Labor Force.
Second - moving the needle on Unemployment from 7.9% in October 2012 to 5.0% in October 2016
Again, the Employed number was 143,384,000 for October 2012, and in order to attain the targeted 5% Unemployment Rate, Employment would have to increase by 15,600,000 (325,000 per month) by October 2016 for a total of 158,984,000.
Since the 325,000 per month is well beyond the 245,000 monthly adds to the labor force, the 80,000 per month difference between the two represents the reductions in unemployment. Again, while the job growth (employment) equals 325,000, a total of 80,000 of that number is coming from the unemployed side of the Labor Force.
One more time…keep in mind that the Labor Force is equal to Employed plus Unemployed. In this case, a reduction of the unemployed by 80,000 per month would lower the 325,000 employed per month to reflect the 245,000 per month increase in the labor force.
To make things clear, on a monthly basis, 245,000 participants would be flowing into the Labor Force and combining with the 80,000 moving from the ranks of the Unemployed to the Employed. The net result is that Employment would expand by 325,000 monthly from October 2012 through October 2016.
The Employment-Population Ratio was at 58.8% in October 2012. Noting that the rate was 62.7% at the end of 2007, we felt that was a reasonable number to target for October 2016. On the employment side, this will require an average job growth of 325,000 per month for 48 months. It’s important to keep in mind that the Employment-Population Ratio focuses solely on the Employed as a percentage of the Civilian Noninstitutional Population (ignoring the unemployed portion of the labor force).
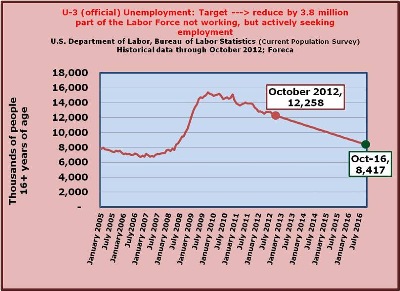
The unemployed or the ‘not employed’ portion of the Labor Force that is actively seeking employment stood at 12,258,000 in October 2012, and the Unemployment Rate (Unemployed divided by the Labor Force) was 7.9%. Going forward to October 2016, using the 66.0% Labor Force Participation Rate and the targeted 5.0% Unemployment Rate, the Unemployed number should fall by 3,841,000 to the 8,417,000, or the 80,000 per month level.
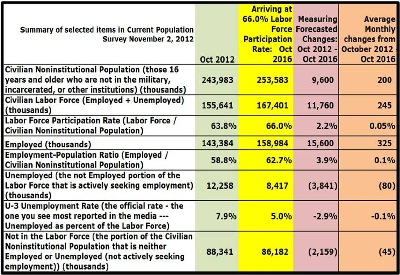
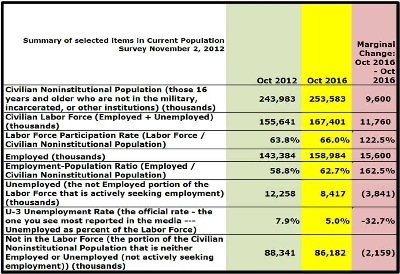
In October 2012 the ‘Not in the Labor Force’ portion of the Civilian Noninstitutional Population (neither employed nor unemployed) stood at 88,342,000. Fast-forwarding to October 2016, that number will have to fall by 2,159,000 (or 45,000 per month for 48 months) to 86,182,000 in order to achieve the 66.0% Labor Force Participation Rate.
How does the Current Employment Statistics (CES) - Payroll Survey fit into this?
The last order of business is to incorporate the Establishment Survey [Current Employment Statistics (CES)], also known as the Payroll Survey, into this story. As we’ve noted on many occasions in previous newsletters, the Bureau of Labor Statistics publishes monthly numbers from two separate surveys: the Current Population Survey, which is primarily used to measure the level of employment or unemploymen;t and the Establishment Survey which is the primary source for monthly employment changes at the firm level.
More specifically, the Current Population Survey (CPS) is a monthly survey of households conducted by the Bureau of Census for the Bureau of Labor Statistics. It provides a comprehensive body of data on the labor force, employment, unemployment, persons not in the labor force, hours of work, earnings, and other demographic and labor force characteristics.
The Current Population Survey, a sample of 60,000 households; data are collected by personal and telephone interviews. Basic labor force data are gathered monthly; data on special topics are gathered in periodic supplements.
The survey is designed so that each person age 16 and over who is neither in an institution (for example, correctional facilities and residential nursing and mental health care facilities) nor on active duty in the Armed Forces is counted and classified in only one group. The sum of the employed and the unemployed constitutes the civilian labor force. Persons not in the labor force combined with those in the civilian labor force constitute the civilian noninstitutional population 16 years and over. (There is no upper age limit.)
Each month the Current Employment Statistics (CES) program surveys about 140,000 businesses and government agencies, representing approximately 410,000 individual worksites, in order to provide detailed industry data on employment, hours, and earnings of workers on nonfarm payrolls.
As it turns out, over time, the two surveys pretty much run parallel, with the Current Population Survey measuring a slightly larger swath of the population due to its coverage of farm workers, self-employed or otherwise small firms not tallied by the Payroll Survey or Establishment Survey (Current Employment Statistics). Historically, the Establishment Survey covers about 94 to 95% of the Current Population Survey. In October 2012 the Establishment Survey only covered 93.3% of the Current Population Survey. It is with this in mind; moving back to at least the 94% range, that we assume job growth of 330,000 per month in the Current Establishment Statistics or Payroll Survey which will be slightly higher than the 325,000 monthly employment growth targeted in Current Population or Household Survey over the next 48 months.
Post 2012 Election Prospects
Since we’ve already addressed what the path up will look like, the question becomes, how do we scale the other side of the employment escarpment (assuming we are poised to do so)?
The just completed election was in effect a referendum on much of the legislation passed in the first two years of the president’s first term including among other things the following: the Affordable Care Act or so-called Obamacare with the associate rise in taxes and expenditures going forward; allowing the so-called Bush tax cuts to expire; and the curtailment of Medicare benefits to the elderly.
The voting majority of the body politic has spoken and we hope the inevitable doesn’t surprise them in an unkindly manner
It is suggested to the reader that they read the Forbes reports on the impact on households of these changes as well as the Heritage Foundation study on some of these legislative enactments. The reader should also review the prediction of the Congressional Budget Office (CBO) (summarized in the Wall Street Journal article) that the fiscal effects of such legislative enactments will lead to recession in short order. It is highly unlikely that given the results of the just completed election that there will be any significant change to the picture in any substantial way, perhaps even if some grand bargain is struck.
Closing Comments on the Labor Force Participation Rate (LFPR) and other measures
A major reason why we have stressed the labor force participation rate or LFPR is that the lower it is the fewer goods and services are available for the population. As it falls it masks this real decline in the potential per capita level of goods and services and hides the effects of rising unemployment as measured by the less inclusive U-3, the widely reported measure of unemployment. The more inclusive U-6 measure of unemployment (going beyond the labor force to capture discouraged workers, etc.), while still somewhat bounded by the LFPR, shows the real decline in our potential for creating goods and services for our population.
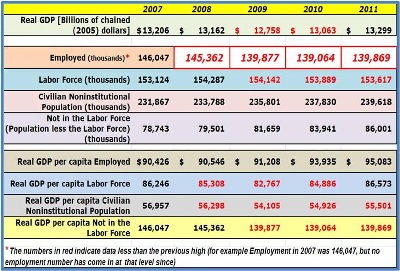
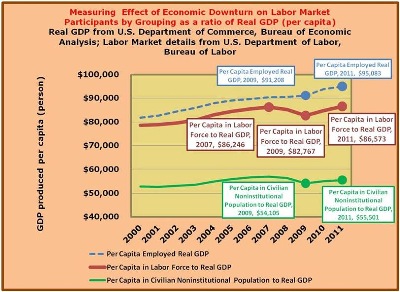
In the following (last graphs) we illustrate the relationship between various labor market groupings and the real GDP.
The first relationship is between those employed (people) and real GDP. What this reveals is the level of GDP produced annually per person. With a stalling economy, fewer people are employed…no surprise there. Just the same, while fewer people are working, they are sustaining relatively high levels of real GDP per capita with respect to those employed.
The rest of the comparisons reveal similarly less than ideal relationships with real GDP…