
2012 Volume Issue 22
October 11, 2012
For a downloadable version, click the following:
…a bit more compressed version of the PDF
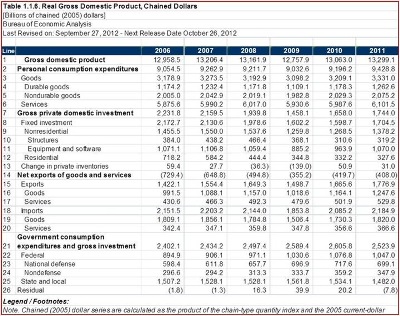
The Restructuring of an Industry: A Case Study of the U.S. Light Vehicle Market
The editors of this newsletter were born and raised in the Metro Detroit area, although the associate editor spent several years in California.
During the Second World War, Detroit was the called the Arsenal of Democracy and in later years, Motown. I remember seeing several musical extravaganzas in the University of Detroit football stadium written and staged by Daniel Lord, a remarkable and multi-talented Jesuit priest. One of these extravaganzas, called "City of Freedom," was held in July 1951 to mark the 250th anniversary of the Detroit's founding was very well received. Nearly every resident in the Detroit metropolitan area at that time was in some way connected to what is now called the light vehicle industry.
My, how times have changed…
The connection to the light vehicle industry has been shrinking ever since. Once in a while, on calm and windless day, I can hear the echoes of the extravaganzas put on by Father Daniel Lord from years gone by.
During most of the World War II era, Detroit's automotive industry, the arsenal of democracy, was producing a large part of the thousands of planes flown by the U.S. military as well as our allies and many of the tanks used by them. I remember seeing and hearing them rumbling down the neighborhood streets where I lived for many years in Southwest Detroit, on their way to the railroad tracks to be transported ultimately to the war scenes.
Research and Innovative Technology Administration (RITA), Bureau of Transportation Statistics
Table 1-15: Annual U.S. Motor Vehicle Production and Factory (Wholesale) Sales
www.bts.gov/publications/national_transportation_statistics/html/table_01_15.html
At the present time, while still a relatively important but rapidly declining part of the local economy, Metro Detroit and the state of Michigan, not unlike other areas of the nation that in past years experienced a variety of restructurings, such as Syracuse, New York, or Youngstown, Ohio, and have also gone through and continue to go through painful transitioning to more diversified economies. The light vehicle industry continues to go through a major restructuring.
It is far from over folks, much more is yet to come…
This newsletter will examine some of the major factors both causing these enormous structural changes and some of the effects it has had on the local, national, and world economies. We will begin with the light vehicle industry but, in some of the newsletters over the coming issues, we will also examine other industries that have had or are now having similar experiences such as steel, financial services, and higher education. There are some common threads of causality running through all of these restructurings, but there are also some causes more specific to each one.
As we all know, change can be painful though necessary and life goes on and as the Brits love to say, 'we muddle through'. Perhaps that is the meaning of the scripturally rooted (Ecclesiastes 1:9-11) French proverb, "the more it changes, the more it's the same thing." "Plus ça change, plus c'est la même chose." Jean-Baptiste Alphonse Karr 1849
Our plan in these newsletters over the following several weeks is to examine the restructuring of several sectors of the U.S. economy. We will have to probe some difficult theoretical concepts such as capital to labor ratios, factor price equalization, comparative advantage, etc. Some of these concepts such as increasing capital to labor ratios have more popular names. The increased capital intensity in the production process is more commonly called, automation. Some structural changes are referred to as outsourcing.
Even for those who have studied a modicum of economics, chances are that many of these concepts were skipped or lightly treated. If they did happen to cross your path in some courses in your days of studying economics, they were probably in connection with international trade, an important but often lightly treated area of economics or in theoretical welfare economics, usually skipped due to time, difficulty, or lack of interest by the instructor.
As we shall see, the basis of international trade is the same as that of all trade, domestic or international trade. The impact of restructuring on the income distribution and the economic welfare of the economy can only be seriously examined with the tools and economic reasoning of (theoretical) welfare economics or else it quickly collapses into endless and bitter partisan political rhetoric or the intellectual morass of ideological wandering. Near the end of each of these articles on various restructurings, we will examine the theoretical economic welfare implications. The term theoretical welfare economics is used to distinguish it from social welfare issues such as income redistribution and specific policies such as food stamps.
The first of the more important causes of the restructuring of the U.S. automotive industry is the replacement of labor with capital or again what is more commonly called automation.
The father of one of my former students owned a party store that was located near my home in metro Detroit. While shopping there one afternoon, the owner began to talk to me about his lunch business. He had acquired quite a solid reputation for the good quality of the sandwiches and salads he sold to workers at a nearby Ford Motor facility. He told me that two-thirds of his business has gradually disappeared due to the continuing conversion of the nearby plant to a more highly automated or capital intensive operation from a more labor intensive one. He eventually sold the party store and opened a new one, less dependent upon lunch business, in a more upscale neighborhood in a suburb of Flint, Michigan (about an hour's travel north of the metro Detroit area).
What is at issue here is the operation of supply and demand in the labor market. Most readers more easily see such forces working in the product markets for goods and services such as energy and recreation markets as seen below in the picture of the Circular Flow of Economic Activity.
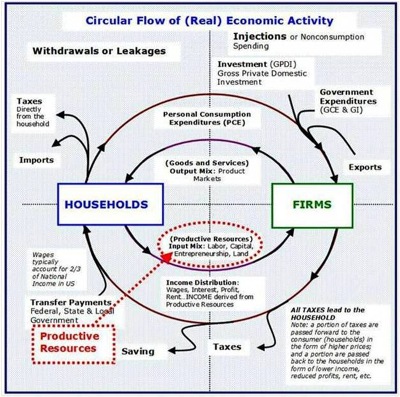
But the markets for productive resources such as labor and capital are equally subject to the forces of supply and demand (the bottom portion of the graphic). The only difference is that there is a reversal of the roles of the firm that employs or demands the productive resources and the households that supply the productive resources such as labor and capital to the firms in the transformation process of production. In the markets for goods and services or product markets (the top portion of the graphic), the firms are the suppliers and the households are the demanders.
The seemingly abstract concepts of factor price equalization and the capital to labor ratio in the production process or an increasingly capital intensive technology of production (automation), are more easily understood by the use of supply and demand analysis, this time in the productive resource markets such as that for labor.
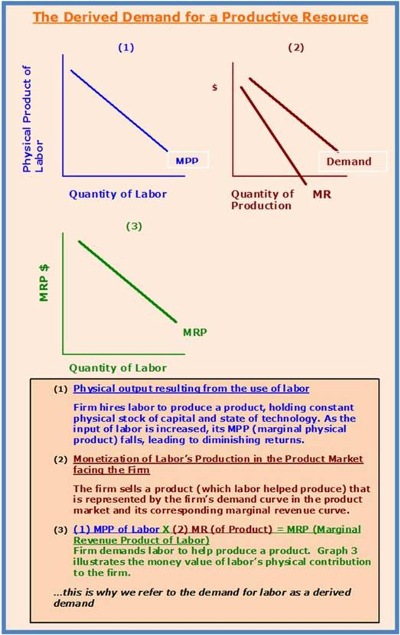
The demand for any productive resource such as labor is a derived demand. It is partly derived from the demand for the products in the form of goods and services demanded from the firms such as personal consumption, business investment in capital goods, collective consumption and investment as dictated by government, and exports to the rest of the world. The demand for these goods and services is met by the firms that produce and supply them by employing the productive resources.
The other determinant for the demand for productive resources such as labor and capital is the physical productivity of the productive resource. The firm employs them to aid in the production of goods and services.
Together they comprise the demand for labor and all other productive resource (i.e., the revenue generating demand for the firm's products and the physical productivity of the productive resources such as labor and capital). In other words, productive resources such as labor and capital are demanded for the revenue generated from the sale of goods and services they help produce in the transformation process called production. The monetary value of these physical products and hence their monetary value to the firm, is determined by the prices these goods and services fetch in the product markets for goods and services.
Since decisions are (usually) made at the margin, the derived demand for labor is called the marginal revenue product. It is the result of multiplying the marginal revenue times the marginal physical product of labor, in this case. The demand for labor is the series of labor compensation rates (the price of labor) at each of the marginal (revenue) products of labor corresponding to the levels of labor hired at each compensation rate. The reasons for the downward to the right slope for the demand for labor (marginal revenue product curve) are twofold. The first is that of diminishing returns to labor. This occurs as the quantity of labor is increased and combined with a fixed quantity of capital, leading eventually to diminishing returns to labor. The greater is the decrease of labor's productivity as the quantity of labor used increases, the steeper is the downward slope of the demand for labor curve; the same goes for the marginal revenue product curve of labor.
An all too often forgotten or ignored result of this inverse relationship determining the demand for labor is that if greater (and increasing) compensation rates are sought, the lesser will be the job security of the labor employed. Automation is one such example of this consequence, as is outsourcing. In fact, as we have seen recently, if automation and outsourcing cannot occur sufficiently and quickly enough, bankruptcy is the result, e.g. Chrysler and General Motors. When Bob Stempel was sacked as the CEO of GM in the early 1990s, he understood this but could not act quickly enough given the political milieu engulfing collective bargaining at that time.
In many ways, that milieu has changed little since then even with the recent bankruptcy of GM.
The second factor determining the shape of the demand for labor curve is due to the decrease in marginal revenue as the amount produced and sold by the firm in the product market increases. Since most if not all markets are less than perfectly competitive, the demand curve for the firm's product (which is the same as the firm's average revenue curve in the absence of price discrimination), slopes downward and to the right.
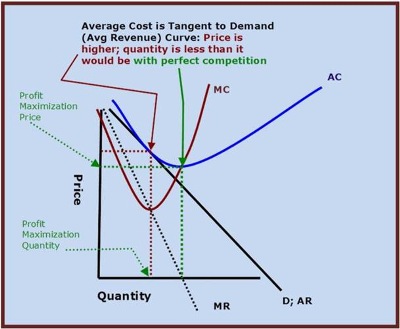
When this occurs, the firm's marginal revenue curve is below or to the left of its corresponding demand or average revenue curve. The law of demand tells us that in order for the firm to sell a greater quantity of its product, the firm must charge a lower price. With no price discrimination, the lower price must be changed to all buyers. Hence, marginal revenue at each price is less than the price at each level of quantity sold and decreases as the quantity sold increases.
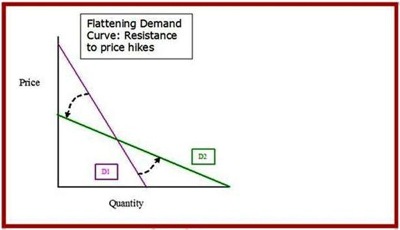
In most cases, the major reason for the above relationship is due to the substitution effect, one of the most powerful forces in all economic behavior. The greater the number of substitutes and the greater is the degree of their substitutability, the greater the substitution effect. As this effect grows stronger, at each level of the price for the product, the less steep (the flatter or more horizontal) is the downward slope of the demand curves facing the individual firms in the market in question and their (counterpart) marginal revenue curves. As competition facing the firms in the product market increases, the demand curve facing the firms rotate toward the horizontal. Buyers defect to the substitutes. This reduces the revenue enhancing effects of a price increase by the firm.
If the firm is selling its product in a perfectly competitive market, the limiting case even though seldom if ever achieved in the real world, the demand curve facing the firm is horizontal or perpendicular to the price or Y axis at the level of the equilibrium market price. The equilibrium market price is that price at which the market demand and supply intersect and the market is cleared.
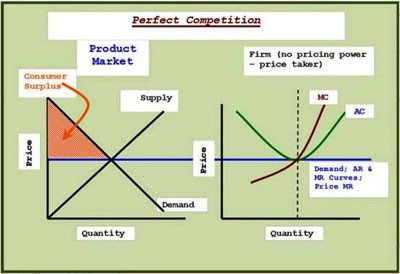
In this case, the demand or average revenue curve and the firm's marginal revenue curve would be coincident, and both horizontal and perpendicular to the price axis at the level of the equilibrium market price. The firm has no price power and accepts the market price, since any price above the market equilibrium price would result in zero units sold and zero revenue. In this limiting case, the firm's demand for labor curve, the marginal revenue product or MRP (marginal revenue X marginal physical product of labor) would equal the value of the marginal product or VMP (price X marginal physical product). Since the limiting case may be approached but in all reality, never reached, the firm's MRP curve or its demand for labor will always be less than or to the left of or below its VMP curve but approaching the demand for labor curve to Value of the Marginal Product curve as competition increases.
These are the real economic facts of life, whether or not the participants in the labor market realize it or not!
Lack of vigorous competition is the major causes of the downward slope of the demand and marginal revenue curves faced by the firms in their product markets and thus a major cause for the downward to the right slope of the firm's demand for labor or marginal revenue product of labor curves.
This was the cause of what Joan Robinson termed, monopolistic exploitation. The word exploitation gives a connotation that is very misleading, but it is the term she chose to use. She also used a term, monopsonistic exploitation, referring to the fact that in most labor markets, the supply of labor cure slopes upward to the right and hence the marginal cost of labor is greater, i.e. to the left or above the supply of labor curve which is also the average cost of labor in the absence of wage or labor compensation discrimination.
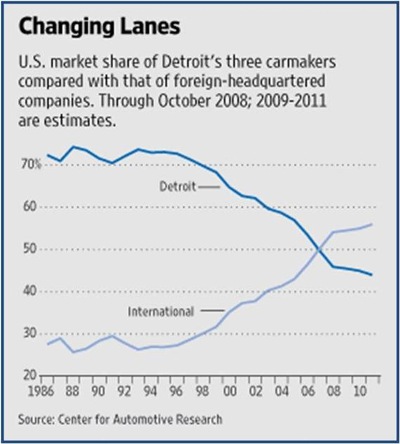
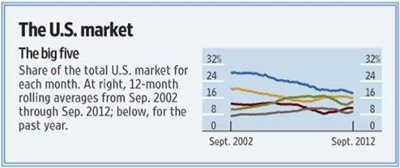
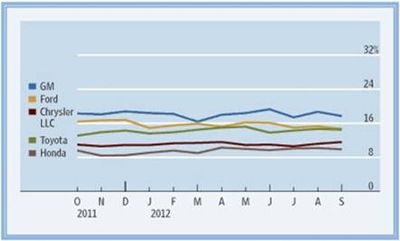
A second major factor causing the restructuring of the light vehicle industry and other industries for that matter, is encapsulated in the term that has come to the forefront the last 30 or so years in the light vehicle industry, outsourcing. This means buying many of the parts formerly manufactured by the firm in question such as those of the Big Three (GM. Chrysler, and Ford Motor) who now purchase many of their parts and sub assemblies from other firms both here and abroad. Additionally, the majority of the light vehicles produced in the U.S. are now produced by companies transplanted here, primarily from Asia (Toyota, Honda, Nissan, Hyundai, etc.)
The result is that a substantial drop in the market share of the traditional Big Three firms, General Motors, Ford Motor Company, and Chrysler. The Big Three's market share has fallen from around 90% of sales just after World War II, to at best, 40% at the current time.
http://online.wsj.com/article/SB122809320261867867.html
http://online.wsj.com/mdc/public/page/2_3022-autosales.html
Why this structural change? Basically, production gradually moves towards locations and technologies to bring about the lowest cost of production, especially when Adam Smith's "Invisible Hand of Competition" intensifies as it did after the Second World War.
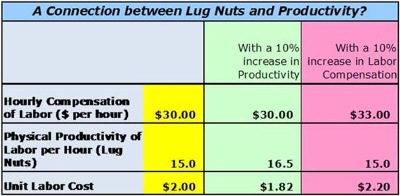
You may have heard in your courses in economics, the term factor price equalization. In a narrow form of this theory, production tends to flow towards areas with lower labor costs per unit and away from those with higher labor costs. The word factor refers to the productive resource in question such as labor. Factor price, in reference to labor, means the compensation rate per hour. Continuing to focus on labor, unit labor costs are determined by dividing the compensation per unit of time (e.g., per hour) by labor's (hourly) physical productivity. Over time, as production gradually moves to the lower labor cost areas, labor compensation rates rise in the area to which production flows, such as the Southeastern U.S. Mexico, or Asia, and fall, at least in a relative sense, in the areas from which production flows, such as the Great Lakes region of the Midwestern U.S., where we have seen this happening over the years.
Do you remember the complaints that cheap Japanese labor after the Second World War led to a U.S. trade deficit with them. That formerly cheap Japanese labor is now among the most expensive in the world, right up there with the U.S. and some European nations. We have seen the same pattern happening to the cost of labor in China and India. Blending in the labor used by the transplants in the U.S. and new hires at the traditional Big Three at the lower tier of compensation rates, labor costs have fallen in the U.S. light vehicle industry, at least in a relative sense.
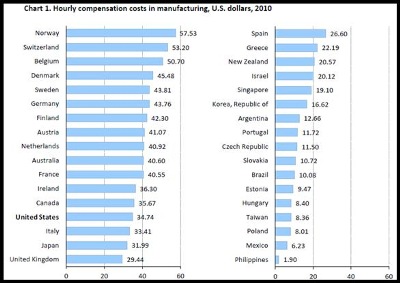
www.bls.gov/news.release/pdf/ichcc.pdf
INTERNATIONAL COMPARISONS OF HOURLY COMPENSATION COSTS IN MANUFACTURING, 2010December 2011
The high compensation rates for labor in the traditional big three auto firms are a result of the enormous power of labor's organized collective bargaining agents, especially the United Autoworkers - UAW. In a thoroughly and impeccably researched and heavily documented study by the Heritage Foundation, it showed that at their peak a few years ago, autoworkers at the traditional Big Three firms in the U.S. auto market received hourly compensation at the basic level of 2,000 hours per year, averaging between $72 to nearly $76 per hour, in other words approaching close to $150,000 a year in total compensation including both wage and non-benefits such as retirement and health care premiums paid by the firms.
Heritage Foundation on Big Three labor compensation in 2008…
UAW Workers Actually Cost the Big Three Automakers $70 an Hour
December 8, 2008
"GM reported an average hourly pay of $39.68 an hour in 2006. About 54 percent of the average UAW employee at GM's earnings came in cash in 2006."
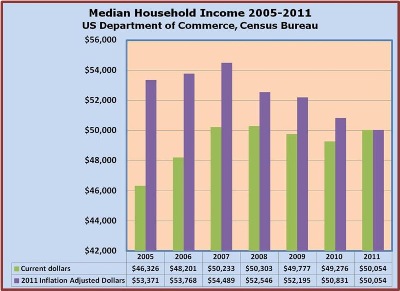
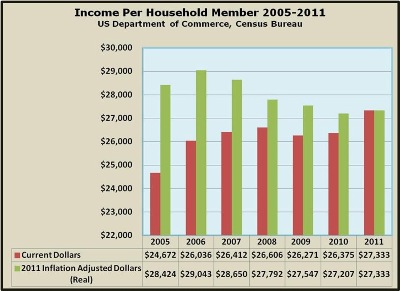
This of course was significantly higher than the average median Household Income at the time and three times the Individual Household Member's earnings. We suggest you read that study cited and if you're skeptical check out the documentation.
There is a real tradeoff between compensation per hour, i.e., the price of labor, and job security; the more of one that is achieved, the less of the other will be the inevitable result. Tradeoffs are an economic fact of life. Ignorance may be blissful but such tradeoffs will ultimately exact their logical result.
Back in the early post-World War II era, imports especially from Asia began to take an increasingly larger market share (of the lower end of light vehicle industry). Both the Big Three auto companies and the UAW lobbied Congress and succeeded in having legislation passed to limit the amount of vehicles imported into the US, especially from Japan. The Japanese, who at the time had a significant cost advantage in the production of smaller and less profitable vehicles, began to go upscale and produce and export to the U.S. units of much greater value added to counter the number of units limited by the import quotas.
Since the higher valued light vehicles were more profitable on a per unit basis to the U.S. auto companies, this transformation of the foreign firms of adding to their production, upscale or luxury autos, especially the Japanese, ultimately caused very significant financial problems to the traditional nameplate American firms in the automotive industry by further reducing their market share, this time in the more profitable luxury segment.
The next restrictive push by the auto industry and the UAW was that of insisting on a minimum of domestic content. This restriction was met by the Japanese auto firms by transplanting to the United States where the production would then be of domestic origin in the U.S. For a variety of reasons, the heart of the American automotive industry, the Great Lakes region, was not chosen as the new home for the transplant firms. Instead they chose areas of lower labor costs. This is factor price equalization working not on the international scene this time, but on the domestic scene. The Motown phenomenon has been shifting its location from the Great Lakes region of the Midwest towards a more southeasterly location in states like Georgia and Tennessee.
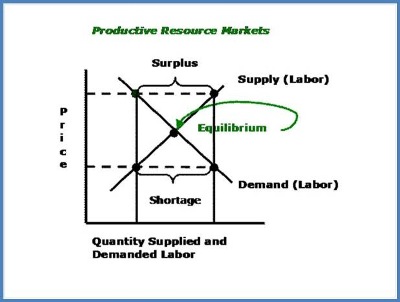
So what does this all mean? Referring back to the graph of the labor market above, as labor through its collective bargaining agent, the UAW and other unions in the automotive industry, demanded higher compensation rates at each level of labor hire, the supply of labor was reduced and one of its effects was the reduction of the quantity of labor employed by the auto firms involved in the bargaining. This quantity reduction in direct labor employment was due to both outsourcing and the replacement of labor by capital or automation.
Like all responses to a price change (termed labor compensation rates in our case), it takes time. This persistent pattern of rising labor compensation rates over time and its corresponding 'sticker shock' gradually led to various forms of outsourcing as well as loss of market share, first to imports and then to the transplants along with increased automation. The outsourcing took various forms including the increasing use of contract labor as well as buying many parts and sub-assemblies instead of manufacturing them in house.
This is the powerful substitution effect occurring. The Big Three substituted outsourcing in place of more traditional use of full time in house employees. The firms also changed technologies and used more capital intensive ones as contrasted with more labor intensive ones. The buyers of light vehicles substituted the products of the transplants instead of buying just the vehicles of the traditional domestic nameplate firms, the Big Three.
Another phenomenon arose due to the persistent rise in labor compensation rates. The increasing use of overtime partly replaced hiring additional employees in periods of rising vehicle sales. Since many of the elements of the non-wage portion of the compensation package are capped at the basic wage rate for straight time, overtime costs per hour to the firm were significantly less than were straight time compensation, even at time and one-half for the wage portion of the compensation package. As long as labor productivity did not significantly fall, unit labor costs on overtime were less than for full time employment. This also tended to reduce the number of employees per unit produced.
When prices are raised, including labor compensation rates, there is also an income effect. In the product markets, most goods are what are called normal goods. This means that for most goods and services, as the income of buyers increase, all else equal, they buy more of the goods and services. As their incomes decrease, they buy less of the goods and services if these goods and services are 'normal; as are most goods and services.
If the price increases for a normal good such a light vehicle, the income effect results in the buying of less of them just as did the substitution effect. Since most goods are normal goods, the income effect reinforces the substitution effect and reduces the revenue enhancing results of a price increase by the firms.
If the price is increased in what is termed the relatively price elastic range of a demand curve, the substitution and income effects are so strong that revenue decreases in response to a price increase. The upper-half of most demand curves in the product markets usually display this characteristic. It is in the lower half of product demand curves where price elasticity is relatively inelastic and price increases result in total revenue increasing (due to relatively weaker income and substitution effects).
In the labor market, a productive resource market, it has been argued at times that the labor supply curve at relatively high compensation rates, turns vertical and as compensation rates continue to increase, the slope (of the labor supply curve) begins to 'bend backward', i.e., it begins to slope upward and to the left. The major reason for this if and when it occurs, is that leisure is a normal good and as income rises, more leisure is demanded and labor desires to substitute leisure for work. Leisure and income are said to be complementary goods. Perhaps resistance to significant and persistent overtime work hours, even the threat of striking over it, is support for this hypothesis (at times).
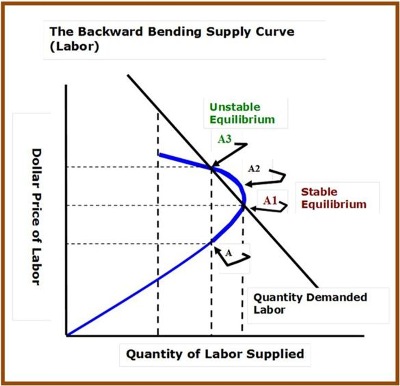
Moving up Y axis Labor Compensation is rising
- Assuming Labor Market is below the equilibrium at point (A)
Moves to (A1) to reach equilibrium
- Assuming compensation rate is above the equilibrium at point (A2)
Moves to (A3) to reach equilibrium
Traditional policy = Higher compensation equates with increased supply of labor; but if you're in the backward-bending portion (price is higher than equilibrium), the opposite occurs.
(Summary)
A = shortage of labor and the dollar price of labor will rise.
A1 = QS of labor (stable equilibrium) = QD of labor
A2 = QS of labor > QD of labor;
A3 = Unstable equilibrium. If you take a price below that intersection, the QS > QD
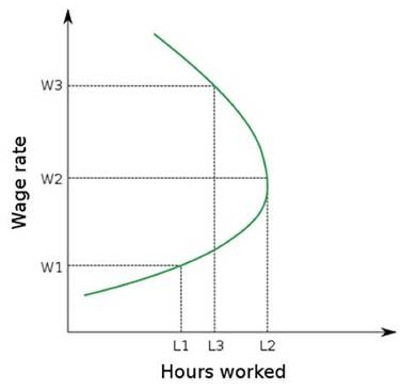
Another look at the same…
Assumption: that leisure is a normal good (when income rises, you demand more leisure)
When you work too much, you can't enjoy the income that the leisure enables you to enjoy (there are only 24 hours in a day).
Will a tax cut raise the quantity supplied of labor? If you are in the upper portion there's a potential for a backward bending supply curve. This means that an increase in hours worked results in lesser leisure.
Moving from W1 to W 2, the worker reaches their maximum in terms of labor (L1 to L2)
Further increases in wages, causes the worker to provide less labor (L2 to L3). This drop in labor is due to the increased demand for leisure.
The economist, Arthur Laffer, posited that cutting tax rates would lead to an increased tax base (more taxes being collected). People would be willing to work more (and pay more in taxes) so long as they kept a larger portion of their pay.
Supply-siders argue that the higher the after-tax real rate of reward to workers, the more they will work.
Cut taxes, the after-tax reward will increase and since the labor curve is upward-sloping to the right (like most supply curves), then workers will work more.
The result of collective bargaining tends to be a decrease in the supply of labor and if the agreement includes an increase in the compensation, a smaller quantity of labor employed occurs (for reasons examined above). A similar result occurs when a legislatively set minimum wage above the equilibrium wage that would occur in the absence of legislative intervention.
Again, the result is one of several possibilities: outsourcing, automation, the cessation of production, or in the case of GM and Chrysler, bankruptcy and bailouts.
Now we can examine such restructurings in the context of theoretical welfare economics. In the limiting case of all product markets for goods and services and all productive resources market such as those for labor and capital being perfectly competitive, the outcomes that occur in both microeconomics and macroeconomics perspectives maximize the economic welfare of society. At the micro level, both equity and efficiency are achieved. At the macro level, both high employment (natural rate of employment) and a reasonable degree of price level stability (A very mild deflation RATE) are achieved.
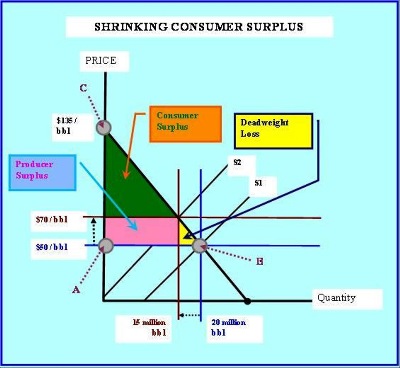
Equity exists when consumers pay the lowest price possible, i.e. the sum of all the costs of all productive resources, subject to the constraint that all productive resources (defined conventionally as being labor, debt and equity capital, entrepreneurship, and land) are receiving just high enough rewards to bring them into employment and keep them there. The productive resources are receiving just what is needed to overcome their opportunity costs, no more and no less. The opportunity cost of a productive resource is the reward or income it would receive from its next best competitive alternative, no more pr no less. This means that the consumer surplus is maximized and the productive resources receive no producer surplus (also called economic rent). In earlier economic literature, the term economic rent was used much more than producer surplus, but they have the same meaning in this context.
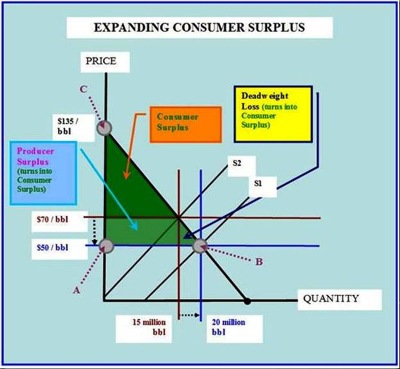
In the preceding graph, the area above the market price bounded by that price, the upper part of the demand curve and the price axis above the market price gives us an estimate of additional expenditures by the consumers that they would pay if they had to in order to receive the same quantity they acquired at the equilibrium market price. The resulting income distribution reflects this condition of equity.
Note that equity is not equality. Productive resources that take more risk, require a greater sacrifice to forgo consumption or leisure, and in the case of labor, embody more human capital and work longer hours, will and should receive higher incomes. But they sacrifice more in serving society's consumers. This is a necessary inequality in order to bring fourth production and ration the scarce resources in order to achieve the greatest material satisfaction for society.
We have shown in other newsletters on this web site that as competition decreases in any market, the market or monopoly power of the supplier increases and as it is exercised, the producer's surplus going to the productive resources increases. However the increase in the producer surplus is less than the loss in the consumer surplus, giving rise to what is called a deadweight loss as a result of this expropriation by the productive resources through the exercise of this monopoly power by the firm employing the productive resources. Labor are capital are two such productive resources receiving at times, far more than they would have received had the firms employing them faced significantly more competition.
This is the essence of what is meant by the violation of equity and a major cause of the excessively unequal distribution of the nation's income and what triggers the call for income redistribution. It would be far more efficient to promote competition in all markets to reduce this income mal-distribution in the first place than to pursue inefficient and economic growth destroying economic policies after the fact.
As product and productive resource markets become less competitive, the welfare conditions such as equity are violated and in the case just discussed, the income distribution becomes excessively unequal. This is so because some productive resources receive a producer surplus from either a lack of competition in the in the productive resource market as in collective bargaining or from an employer that exercises its market or monopoly power in the product markets for goods and services. The few in their role as productive resources receive excessive rewards, such as surplus profits, excess management compensation, surplus labor compensation, etc., at the expense of everyone as consumers and their consumer surplus is expropriated by the exercise of monopoly or market in the product and resource markets with an accompanying deadweight loss. In short, the few gain at the cost of the many. Equity is violated not because the income distribution is unequal but because the income distribution is excessively unequal.
The prolonged anemic recovery in which we are currently wallowing is due in major part to the futile attempt to redistribute that excessively unequal income distribution through threatened and already legislated tax rate increases and already occurring expenditure increases causing a string of annual federal budgetary deficits approaching conditions of sovereign risk.
The cost of these ill-conceived economic policies is the sacrificing economic growth. For whatever reasons, the failure to pursue economic policies that increase competition in all markets is also a significant cause of the growing frustration of the large mass of unemployed, nearly 15% as measured by the vastly superior measure, U-6 (www.bls.gov/news.release/empsit.t15.htm). It is the lack of this vigorous competition that is the basic cause of excessive income inequality in the first place. The market for petroleum products such as gasoline, the market for eyeglasses and sunglasses, as well as many other markets are examples of the failure of the anti-trust agencies and a major cause of the increased recession bias of the economy as the downward price rigidity increases resulting from declining competition in markets.
The policies that increase market concentration whether in terms of manufacturing or in financial services, as for example the forced mergers of small banks into the already excessively large banks and their huge holding companies, exacerbate the excessive inequality in the income distribution, the inefficiency of the firms involved and the introduction a recession bias through the increased downward rigidity of prices as market concentration increases.
Still at the micro level, the economic welfare condition of efficiency is achieved, when for the currently available productive resources and technology, the per capita GDP or Gross Domestic Product is at a maximum. Technically this occurs when the prices of all goods and services are equal to their respective marginal opportunity costs and average opportunity costs are at a minimum.
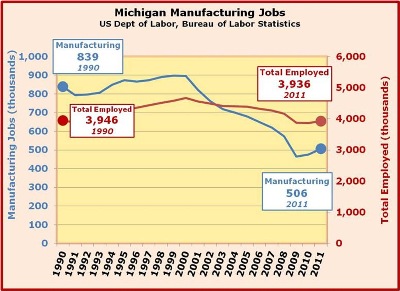
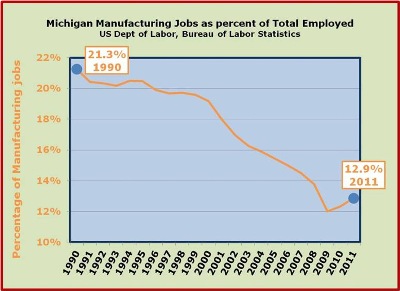
The welfare condition of efficiency is violated as competition in markets decreases and the result is a smaller per capita real GDP than is needed as well as a smaller per capita National income. Such results can be seen in the charts and graphs shown earlier in this article.
From a macroeconomic perspective, economic welfare is reached when the labor markets are cleared and the natural ate of employment occurs. This means that there is no cyclical unemployment and both sides in the productive resource markets possess NO market (monopoly) power. Those households that want to supply productive resources at the going equilibrium price such as the labor compensation rate or the interest rate can supply all they want. Thos firms that demand such resources can demand and employ all they want at those equilibrium rates or prices.
Unfortunately, as markets become less competitive and more concentrated in fewer firms and resource groups such as organized labor (unions), prices become increasingly rigid downward and render markets incapable of performing their vital functions.
The business cycle becomes increasingly recession prone and price instability prone, alternately in form of deflation and inflation (including current form of inflation by DE-CONTENTING which is not being sufficiently captured by the federal agencies measuring it, especially when it is de-contenting by decreases in quality) as well as in fluctuations in the labor force participation rate, and fluctuations in the employment and unemployment rates.
The other macroeconomic welfare condition is that of the existence of a reasonable degree of price level stability. If productive resources such as labor and capital become more productive, their opportunity cost will increase, and their rewards should and will eventually increase commensurate with their increase in productivity. If productive resource compensation increases at the same rate as their productivity increase as would be so in perfectly competitive markets, no upward price pressure need occur on the products they help produce. To the extent that productivity increases are not attributable to individual productive resources, unit costs fall and in highly competitive markets. This increases the supply of the good or service in question and puts downward pressure on the price of that product. Hence, when all markets are perfectly competitive, the result would be a very mild deflationary pressure.
Many of our social welfare policies ignore the economic 'facts of life'. This failure to achieve the economic welfare goals, both micro and macro, is the end result. Such lack of basic understanding of the logic of theoretical economic welfare relationships is one of the major causes of economic behavior that are contributors to the restructurings such as the one we have experienced in the light vehicle industry.
