
2013 Volume Issue 5
April 9, 2013
For a downloadable version, click the following:
…a bit more compressed version of the PDF
Let's take a walk…watch out for the Gaps: Jobs; Growth; and Fiscal

Sinkhole in Guatemala 2010…
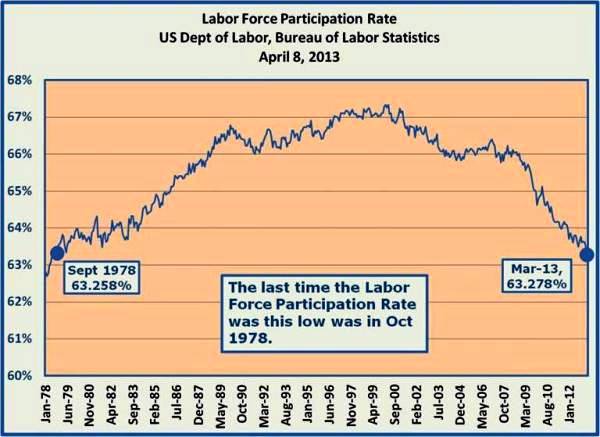
In 2007, we had an economy where the Labor Force Participation Rate was at 66% and the Unemployment Rate was at 4.6%.
By simply making a few adjustments; i.e., using those published rates from the Bureau of Labor Statistics in 2007, we can make some revealing observations about the employment situation that continued to underperform in 2012 (no improvement thus far in 2013). First, we'll turn to 2007 when the labor markets were humming along (for the most part). Looking at those same measurements for 2012, if we then overlay the rates from 2007 we find how badly the labor markets have deteriorated; i.e., it would take us 10.8 million new jobs to get us back to the 2007 level of 66% LFPR and 4.6% Unemployment Rate.
Of course the impact of the loss of 10.8 million jobs (jobs gap) is felt throughout the economy. We also measure a growth gap (nominal GDP/National Income), and the budgetary or fiscal gap, which helps shed some light on the trillion dollar plus federal deficits we have been experiencing for the last four calendar years (2009-2012).
In summary, we estimate that based on the 10.8 million jobs gap:
- There was a ‘Compensation of Employees Gap' of $647,428,000,000 ($647 billion) in 2012 (based on an average compensation of $60,124 per employed (includes wages and fringe).
- Using the same logic, in developing the shortfall in the Compensation Gap, we arrive at a (nominal GDP) Growth Gap of $1,185,503,000,000 ($1.2 trillion) in 2012.
- On the Fiscal Revenue side, this translates into a ‘Current Federal Receipts gap' of $516,726,000,000 ($516.7 billion) note: the deficit was about $1.2 trillion for calendar year 2012.
- On the Fiscal Expenditure side, there was around $200 billion of readily identifiable ‘Income Security' items related to the job shortfall that would bring us back (categories include: Disability; Retirement; Welfare and social services; Unemployment; and Other) to pre-Recession.
In the following presentation, we walk through the work-up used to support the preceding material. Our intention is to help our readers to first understand the rationale we used in identifying the various gaps and then to consider how to close those gaps moving forward (we'll have to wait for the next newsletter article to wade into that topic). We provide a framework for you to see how we developed our analysis; and while there certainly might be different takes on how many jobs we are really short, based on the Labor Force Participation Rate and the U-3 Unemployment Rate from 2007, we've clearly identified the criteria we used in developing our model.
Here we go…
Note: Annual numbers from: U.S. Bureau of Labor Statistics Current Population Survey (Household Survey) Labor Force Statistics including the National Unemployment Rate. Summary table A. Household data, seasonally adjusted
- 2007
Civilian Noninstitutional Population (those 16+ who are not in military, incarcerated, etc.)
- 231,867,000
(Civilian) Labor Force (those that are employed, and those that are unemployed actively seeking employment)
- 153,124,000
Force Participation Rate (Labor Force divided by the Civilian Noninstitutional Population)
- 153,124,000 / 231,867,000
- 66.04%
- Employed
- 146,047,000
- Unemployed
- 7,078,000
U-3 Unemployment Rate (Unemployed divided by Labor Force)
- 7,078,000 / 153,124,000
- 4.62% U-3 Unemployment Rate
Note: Annual numbers
- 2012
Civilian Noninstitutional Population (those 16+ who are not in military, incarcerated, etc.)
- 243,284,000
(Civilian) Labor Force (those that are employed, and those unemployed actively seeking employment)
- 154,975,000
Labor Force Participation Rate (Labor Force divided by the Civilian Noninstitutional Population)
- 154,975,000 / 243,284,000
- 63.7%
- Employed
- 142,469,000
- Unemployed
- 12,506,000
U-3 Unemployment Rate (Unemployed divided by Labor Force)
- 12,506,000 / 154,975,000
- 8.07% U-3 Unemployment Rate
- Now, let's adjust the 2012 data using the 2007 Labor Force Participation Rate and Unemployment Rate
Civilian Noninstitutional Population (those 16+ who are not in military, incarcerated, etc.)
- 243,284,000
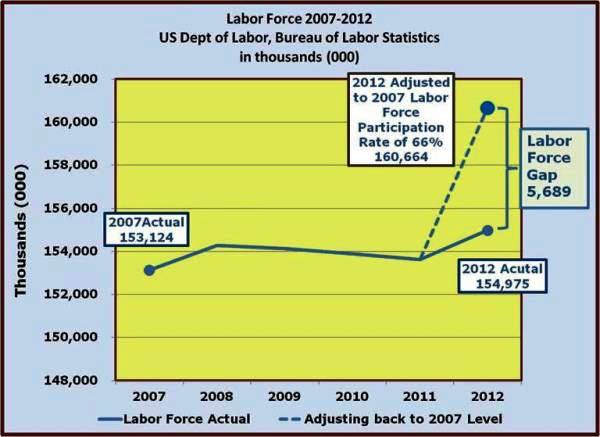
(Civilian) Labor Force (those that are employed, and those unemployed actively seeking employment) adjusted by the 66.04% Labor Force Participation Rate from 2007
- 243,284,000 X 66.04% = 160,664,000
- 2012 Actual = 154,975,000
- Difference = 5,689,000
Labor Force Participation Rate (Labor Force divided by the Civilian Noninstitutional Population)
- 160,664,000 / 243,284,000
- 66.04%
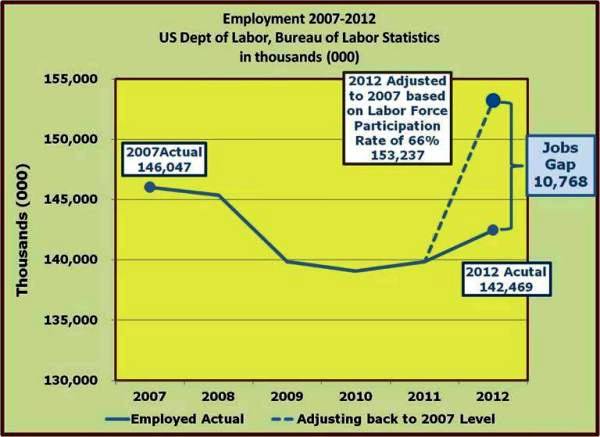
Employed (Labor Force – Unemployed)
- Adjusted Employed = 160,664,000 – 7,427,000
- Adjusted Employed = 153,237,000
- 2012 Actual = 142,469,000
- Difference = -10,768,000
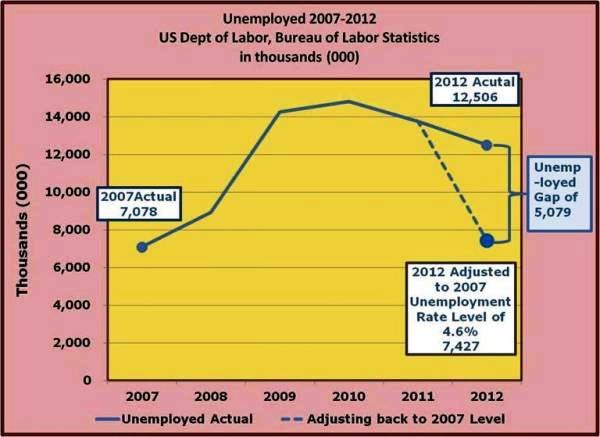
Unemployed adjusted to the 4.62% U-3 Unemployment Rate from 2007 (Unemployed = Labor Force X Unemployment Rate)
- 160,664,000 Labor Force X 4.62% Unemployment Rate
- 160,664,000 X 4.62% = 7,427,000
- 2012 Actual = 12,506,000
- Difference = -5,079,000
Unemployed adjusted to the 4.62% U-3 Unemployment Rate from 2007 (Unemployed divided by Labor Force)
- 7,427,000 / 160,664,000
- 4.62% U-3 Unemployment Rate
What this tells us is that if we adjust the 2012 Employment Situation data to reflect the 2007 66.04% Labor Force Participation Rate and the 4.62% U-3 Unemployment Rate, we would be left with a shortfall of 10,768,000 jobs.
Using this same rationale, if we apply this shortfall in jobs to the other macroeconomic measures we come up with some interesting relationships.
- Compensation of Employees under the National Income breakdown in the Bureau of Economic Analysis came in at $8,565,800,000,000 (that's $8.6 trillion) for 2012. The total Employed for 2012 was 142,469,000. If we simply divide If we simply divide compensation ($8.6 trillion) by the number of employees we arrive at $60,124 per employed (includes wages and fringe).
If we take the 10,786,000 and multiply by the above average Compensation of Employees ($60,124) we would have a compensation shortfall of $647,428,000,000 ($647 billion) in 2012.
Compensation of Employees Gap of $647,428,000,000 ($647 billion) in 2012
Using this same rationale, (nominal GDP) Gross Domestic Product registered $15,684,800,000,000 ($15.7 trillion) in 2012. Since Compensation of Employees was $8,565,800,000,000 ($8.6 trillion), we simply divide that by the GDP of $15,684,800,000,000 ($15.7 trillion) to come up with 54.61%.
We then add the compensation shortfall of $647,428,000,000 ($647 billion) to the actual Compensation of Employees at $8,565,800,000,000 ($8.6 trillion) and we reach a total of $9,213,228,000,000 ($9.2 trillion). When we divide the adjusted Compensation of Employees $9,213,228,000 ($9.2 trillion) by 54.61%, we have an adjusted nominal GDP of $16,870,303 ($16.9 trillion) for 2012. The difference between the actual nominal GPD in 2012 $15,684,800,000,000 ($15.7 trillion) and the adjusted GDP of $16,870,303,000,000 ($16.9 trillion) represents a growth gap of $1,185,503,000,000 ($1.2 trillion).
(Nominal GDP) Growth Gap $1,185,503,000,000 ($1.2 trillion) in 2012
Now let's take a look at fiscal impact of the growth gap…
Reference: U.S. Bureau of Economic Analysis (National Income and Product Accounts)
In 2007 the Current Federal Receipts (primarily Current Tax Receipts and Contributions for government social insurance) were $2,654,700,000,000 ($2.7 trillion) and the 2007 Nominal GDP was $14,028,700,000,000 ($14.0 trillion). The ratio of Current Receipts to Nominal GDP was $2,654,700,000,000 ($2.7 trillion) divided by $14,028,700,000,000 ($14.0 trillion), for a total 18.92%.
In 2012 the Nominal GDP was $15,684,800,000,000 ($15.7 trillion). Adjusting that total GDP by growth gap of $1,185,503,000,000 ($1.2 trillion) we would have $16,870,303,000,000 ($16.9 trillion).
Taking the adjusted nominal GDP of $16,870,303,000,000 ($16.9 trillion) and multiplying it by 18.92% (Current Receipts / Nominal GDP from 2007), we would a total of $3,192,426,000,000 ($3.2 trillion). In 2012 the Current Federal Receipts were $2,675,700,000,000 ($2.7 trillion) or $516,726,000,000 ($516.7 billion) less than the adjusted level. Keep in mind that this is just the revenue side of the equation.
In 2012 the Current Federal Receipts gap was $516,726,000,000 ($516.7 billion) note: the deficit was about $1.2 trillion for calendar year 2012.
Since the latest expenditures are only available until 2011, we just made the following adjustments
From BEA Bureau of Economics
- Table 3.16. Government Current Expenditures by Function
- Federal Government Income Security
- 2007 = $892.5 billion in Income Security (categories include: Disability; Retirement; Welfare and social services; Unemployment; and Other)
- Less $495.8 billion for Retirement
- Total $396.7 billion
2011 = $1,233 billion in Income Security (categories include: Disability; Retirement; Welfare and social services; Unemployment; and Other)
- less $606.6 billion for Retirement
- Total $626.4 billion
- Difference between 2011 and 2007 = $229.7 billion
In this case, we simply reduce the expenditures by $200 billion to bring us back in line with 2007 level of expenditures for Income Security. Keep in mind that a good portion of these expenditures are ‘automatic stabilizers' are designed to kick-in when recession hits, and to draw-down during recovery.
The way out of this mess…is it a revenue problem or an expenditure problem?
The real answer probably lies in the fact that BEFORE the government can collect our money (revenue) and spend it (expenditures) we have to earn it first.
This points to the real problem: by any measure, we are several million jobs short (10.8 million if you want to use the 2007 Labor Force Participation Rate 66% and the 2007 Unemployment Rate 4.6%) of where we need to be to achieve a sustained economic recovery.
We'll address (revisit) the Road to Recovery in an upcoming issue…promise.
Wrap-up
We've discussed these topics on numerous occasions and we will continue to do the same in future. Use this material as a supplement in understanding what is really going on in the labor markets.
