2013 Volume Issue 2
March 15, 2013
For a downloadable version, click the following:
…a bit more compressed version of the PDF
February 2013———the Jobs Report
In the latest Employment Report, on March 8, 2013, the media was focusing on how wonderful it was that the payroll employment had risen by 236,000 and how the unemployment rate fell by two-tenths of a percentage point. On the surface those numbers sound very good, but all you need to do is scratch the surface and you'll find that February wasn't a good month at all for the U.S. Labor Market.
THE EMPLOYMENT SITUATION —FEBRUARY 2013
www.bls.gov/news.release/pdf/empsit.pdf
"Total nonfarm payroll employment increased by 236,000 in February, and the unemployment rate edged down to 7.7 percent, the U.S. Bureau of Labor Statistics reported today. Employment increased in professional and business services, construction, and health care."
As we have pointed out many times in this newsletter, the Bureau of Labor Statistics (BLS), in conjunction with the Bureau of Census, are responsible for the employment data.
The nonfarm payroll data is gathered and compiled by the BLS on a monthly basis from various firms ranging in size from a handful to thousands. The payroll survey (CES – Current Employment Statistics) is submitted to the BLS and is used to determine, among other things, the monthly changes in the firms' employees.
The Household Survey (CPS – Current Population Survey) is used to determine the unemployment rate and a number of other statistics that are reported on a monthly basis, and are compiled by the Bureau of the Census and the Bureau of Labor Statistics (BLS).
Frequently Asked Questions about Employment and Unemployment Estimates
www.bls.gov/news.release/pdf/empsit.pdf
Why are there two monthly measures of employment?
…the household survey has a more expansive scope than the establishment survey because it includes the self-employed, unpaid family workers, agricultural workers, and private household workers, who are excluded by the establishment survey.
What is the Establishment Payroll Survey?
The establishment payroll survey, known as the Current Employment Statistics (CES) survey, is based on a survey of approximately 141,000 businesses and government agencies representing approximately 486,000 worksites throughout the United States. The primary statistics derived from the survey are monthly estimates of employment, hours, and earnings for the Nation, States, and major metropolitan areas. Preliminary national estimates for a given reference month are typically released on the third Friday after the conclusion of the reference week; i.e., the week which includes the 12th of the month, in conjunction with data derived from a separate survey of households, the Current Population Survey (CPS). The CPS is the source of statistics on the activities of the labor force, including unemployment and the Nation's unemployment rate.
Back to the February Employment Report
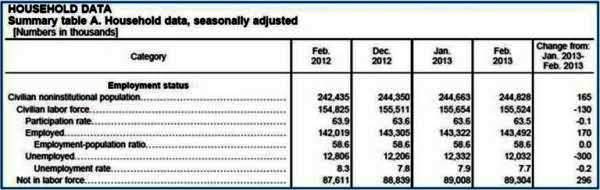
Now, delving a bit deeper into the numbers reported in the employment report, we want to shift our focus to the Household Data Summary Table A. Household Data, seasonally adjusted. The table is typically a few pages into the report (page 4 of the February 2013 report).
In the following presentation we will walk through the monthly changes in the household data (from the Current Population Survey) and then we will take a look back and see how we're doing on a historical basis.
What does all of this mean?
- The Civilian Noninstitutional Population grew by 165,000 a bit low, but relatively normal growth range
(Civilian Noninstitutional Population includes those 16 years of age and older who are not counted in institutions)
- Not in the Labor Force grew by 296,000. This represents the portion of the Civilian Noninstitutional Population that: moved from the ranks of the Employed and Unemployed (Labor Force) into the not in the Labor Force component of the Civilian Noninstitutional Population or entered the Civilian Noninstitutional Population (new entrants by virtue of age, or leaving institutions like the military or prison), but didn't go into the Labor Force.
- The (Civilian) Labor Force dropped by 130,000. This includes those that moved from the ranks of the Employed and Unemployed to the 'not in the Labor Force' portion of the Civilian Noninstitutional Population: this equated to a change in the marginal Labor Force Participation Rate (LFPR) of -78.8% for the month of February.
- Employed grew by 170,000. This means that the newly employed were drawn from the ranks of the unemployed and the 'not in the Labor Force' portion of the Civilian Noninstitutional Population (including drawing from some of those new entrants added into the Civilian Noninstitutional Population).
- Unemployed dropped by 300,000. The unemployed were absorbed into the employed or moved into ranks of the 'not in the Labor Force' part of the Civilian Noninstitutional Population, which again would also include a portion of those recent adds to the Civilian Noninstitutional Population.
So how can growing the employment by 170,000 and reducing unemployment by 300,000 not be such a great thing? First, adding 170,000 to the employed is a good thing. This represents people moving from the ranks of the unemployed, new additions to the Civilian Noninstitutional Population, and people moving directly from the 'not in the Labor Force' component of the Civilian Noninstitutional Population. The unemployed fall-off can be attributed to [at least some of the] 170,000 moving from that category into the ranks of the employed, and an additional 130,000 moving out of the labor force entirely. Seeing 130,000 either giving up on seeking employment, or leaving the labor force for other reasons is not a good thing, especially in light of the fact that this is being viewed as such a good month for the labor markets.
In looking at the 296,000 increase in the 'not in the Labor Force' component of the Civilian Noninstitutional Population, the 130,000 drop outs from the Labor Force are easy to conceptualize, but what about the remaining 166,000 that were added to the number? To arrive at the 'not in the Labor Force' component of the Civilian Noninstitutional Population, you simply add the monthly change from the Labor Force of -130,000 to the change in the Civilian Noninstitutional Population of -165,000 to arrive at the change in the 'not in the Labor Force' component of the Civilian Noninstitutional Population (296,000 due to rounding).
These higher numbers in the 'not in the Labor Force' component of the Civilian Noninstitutional Population are very troubling, especially in light of the double whammy underscored by a fall off in the Labor Force and what amounts to the effective movement of all new entrants into Civilian Noninstitutional Population directly to the sidelines. This is not to say that some of the new entrants didn't find employment, but on a net basis, since the labor force shed 130,000 participants, then the other 165,000 additions to the Civilian Noninstitutional Population had to go somewhere – hence, the expansion of the 'not in the Labor Force' component of the Civilian Noninstitutional Population.
The Bigger Picture (Current Population Survey)
One month of reporting, does not a trend make…
Looking back to the beginning of 2008, in the following graphs we want to illustrate how the various metrics included in the Current Population Survey have performed. Unfortunately, the past five years has not been good at all:
- While Civilian Noninstitutional Population was growing at a fairly healthy rate of around 200,000 per month, the Labor Force (those employed or those unemployed seeking employment) was only growing at around 24,000 per month (with it falling by 130,000 in February 2013 alone) clip.
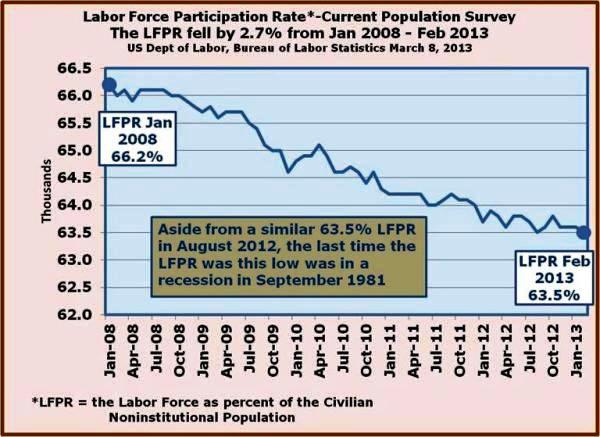
- The Labor Force Participation rate, the ratio measured by the Labor Force divided by the Civilian Noninstitutional Population moved from a respectable 66.2% in January 2008 to 63.5% in February 2013, levels we haven't witnessed since the recession in 1981. The Labor Force Participation Rate for the month of February registered a horrible –78.8% (yes, that's a negative rate) resulting from a change of (130,000) in the Labor Force / 165,000 change in the Civilian Noninstitutional Population.
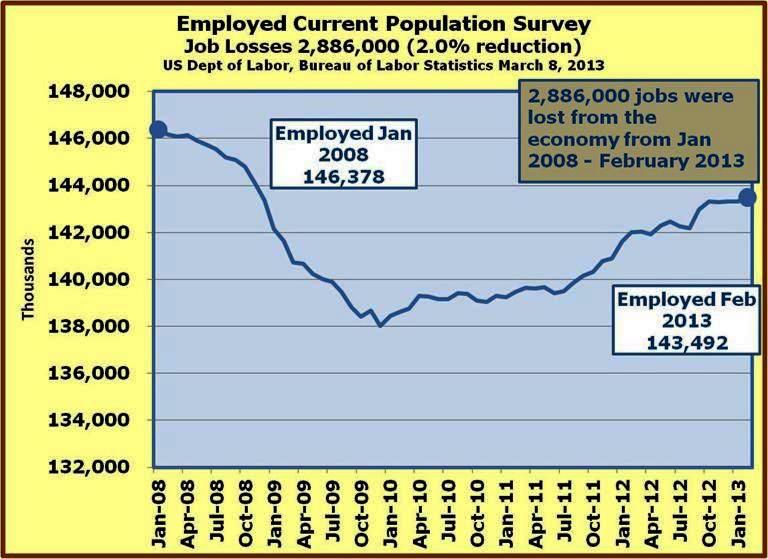
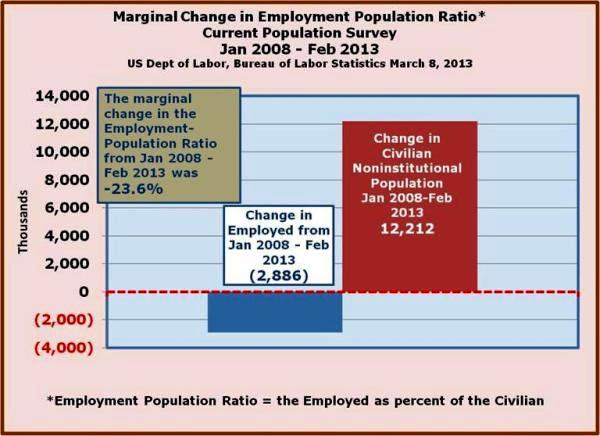
- From January 2008 to February 2013 employment has fallen by 2,886,000. When you couple this with a Civilian Noninstitutional Population growth of 12,212,000, this spells disaster for the Employment-Population Ratio (Employed / Civilian Noninstitutional Population), which came in at a crushing -23.6%. This fall-off drove the Employment-Population Ratio from 62.9% in January 2008 to 58.6% in February 2013.
INVESTOR ALERT…
For all, for you investors out there, keep in mind that the Federal Reserve System (the FED) watches this metric very closely in helping it to guide policy decisions regarding raising the targeted Fed Funds rate. When the employment markets really do start bouncing back, you will hear rumblings from the FED. If and when they take restrictive action interest rates will rise and its negative impact will be felt in both the debt market and the stock market.
Keep in mind the inverse relationship of interest rates and asset prices such as stocks and bonds and even real estate: as interest rates rise, the prices of assets fall and vice-versa.
Why so, you ask? The price of an asset, whether it be a financial or real asset, is the discounted present value of the net cash flow it spins off. The relevant interest rates are the rates used to discount the cash flows in this calculation. As the interest rates (discount rates) rise, the discounted present values of the cash flows fall, resulting in capital losses to owners of these assets.
In one of the next few issues of this newsletter, we will explain how the FED, if it should move to a policy of constraint, brings about a rise in interest rates.
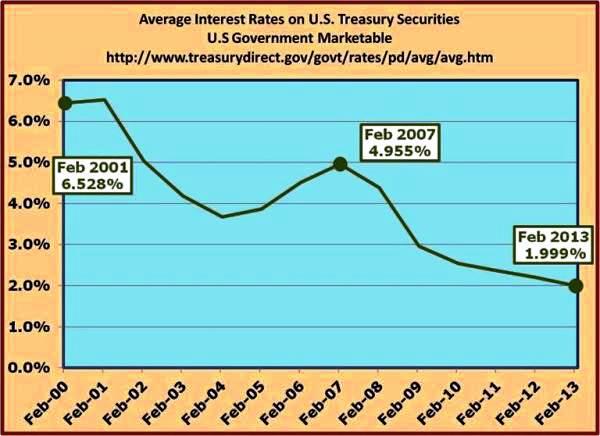
It should also be understood that if interest rates rise, the burden of the debt service on the U.S. Government debt (our National debt) would rise significantly. In the latest Monthly Treasury Report, U.S. Treasury Department, Financial Management Service, the first item under Highlight: "The interest on Treasury debt securities is $16.9 billion, which is 5 percent of the total current month Federal Outlays." The current average interest on the U.S. debt is under 2.0% (www.treasurydirect.gov/govt/rates/pd/avg/2013/2013_02.htm). If rates were to double from the current 1.99% on marketable debt (even 5% is below average), the portion of the Federal Budget dedicated to payment of interest on the debt will certainly double. Again, if interest rates were to rise in the near future the interest payment on the debt would rise accordingly.
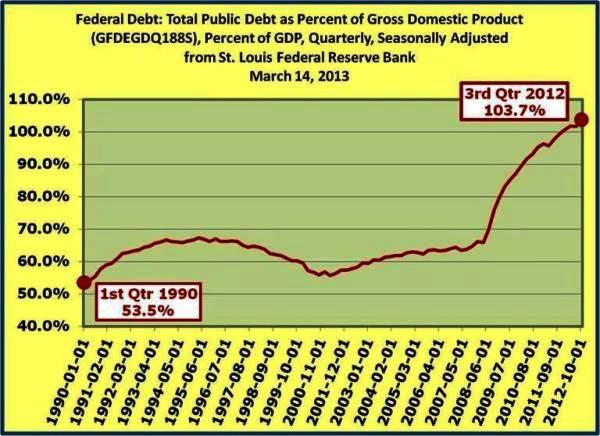
Contrary to what the president is saying, the ratio of our national debt to our GDP is steadily rising and given the puny rate of growth in our GDP, it will not take long for sovereign risk to become a financial nightmare. One only needs to look to our seeming role model, the European Union, for an example of what lies ahead.
http://abcnews.go.com/blogs/politics/2013/03/president-obama-there-is-no-debt-crisis/
Mar 13, 2013
ABC News
President Obama: There Is No Debt Crisis
"We don't have an immediate crisis in terms of debt," President Obama said in an exclusive interview with George Stephanopoulos for "Good Morning America." "In fact, for the next 10 years, it's gonna be in a sustainable place."
- The unemployment picture: while the unemployment rate appeared to have improved, moving from 7.9% in January 2013 to 7.7% in February 2013, it is still far above the 5.0% rate in January 2008. We will also delve further into the adjustments associated with the fall-off attributed to the Labor Force Participation Rate and the other measures of unemployment later in this presentation and in future newsletters.
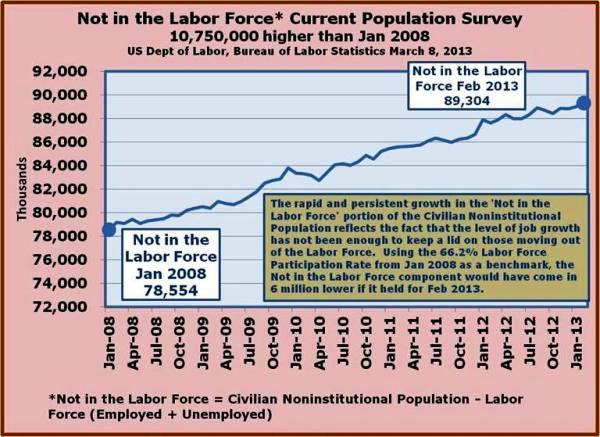
- The last topic we cover regarding the Current Population Survey is the 'not in the Labor Force' component of the Civilian Noninstitutional Population. Since Jan 2008, this segment has expanded by 10,750,000, and by 296,000 in February 2013 alone. While this number should and will continue grow based on a growing population, retirements, permanent disability claims, discouraged workers, etc., it is the stunning rate and persistence of growth in this segment that is so alarming. While a growing Civilian Noninstitutional Population is (and should be) a good thing, since it offsets those people moving into retirement and those permanently disabled, this can only be the case when sufficient numbers of those additions can find employment.
When you couple the difficulties those people have in finding employment (as illustrated by the very low Labor Force Participation Rate) with: growing numbers of retirees – owed in part but not entirely to the aging population (baby boomers…born 1946-1964), but further exacerbated by the horrible job market; an enormous uptick in permanent disability claims; and very long duration of unemployment, it's not hard to understand why the 'not in the Labor Force' component of the Civilian Noninstitutional Population has grown so much.
Mort Zuckerman: The Jobs Picture Is Far Worse Than It Looks
US News and World Reports
February 28, 2013
"Twenty years ago, one person was on disability for every 35 workers; today, the ratio is one for every 16. Such an increase is simply impossible to explain by disability experienced during employment, for it is inconceivable that work in America has become so much more dangerous. For many, this program is another unemployment program, only this time it is without end."
Labor Force
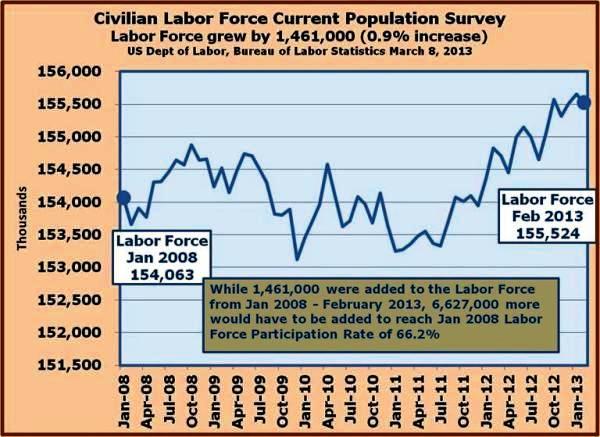
From January 2004 through December 2007, the Labor Force expanded at a rate of around 150,000 per month; while from January 2008 through February 2013, the Labor Force only grew at a rate of around 24,000 per month: the Labor Force Participation Rate averaged only 12% per month.
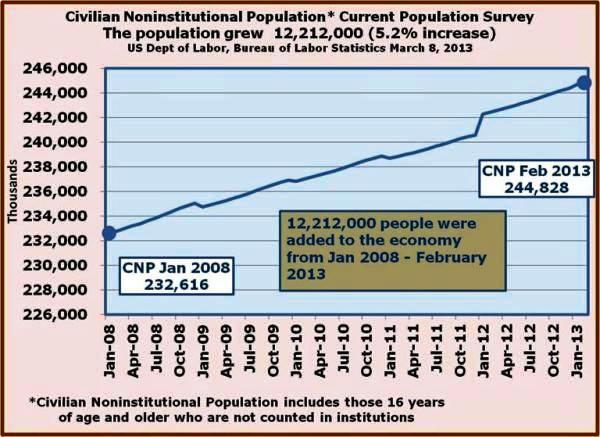
Civilian Noninstitutional Population
From January 2003 through December 2007, the Civilian Noninstitutional Population (CNP) expanded at a rate of around 222,000 per month; while from January 2008 through February 2013, the CNP grew at a rate of around 200,000 per month.
Labor Force Participation Rate
From January 2004 through December 2007, the Labor Force Participation averaged around 67% per month; while from January 2008 through February 2013, the monthly Labor Force Participation Rate averaged only 12% [per month].
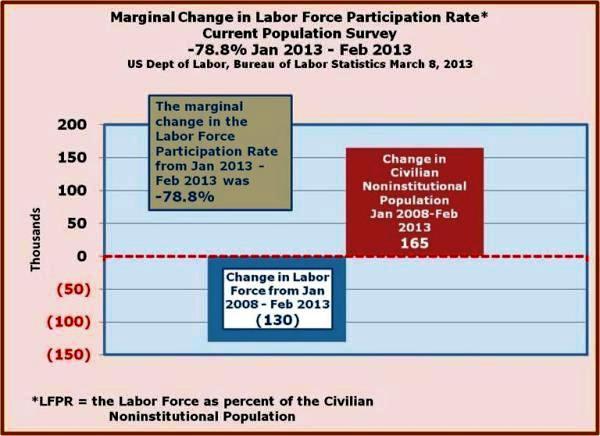
The deterioration in the marginal Labor Force Participation Rate (LFPR) from January 2013 to February 2013 was -78.8%. This monthly figure caused the overall Labor Force Participation Rate to fall from 63.6% to 63.5%. While that one-tenth of one percent might not appear to mean very much, if the Labor Force had expanded by 236,000 (the number reflected in the expansion of jobs in the payroll survey), the unemployment rate would have remained at 7.9%…
Here's how:
Just looking at the month of February…
- 106,000 people added into the Labor Force (rather than falling by 130,000)
- Labor Force is equal to Employed + Unemployed
- Labor Force = January 155,654,000 +106,000
- Labor Force February = 155,760,000
- Employed = 143,492,000
- Unemployed = Labor Force – Employed
- Unemployed = 155,760,000 -143,492,000
- Unemployed = 12,268,000
- Unemployment Rate = Unemployed / Labor Force
- Unemployment Rate = 12,268,000 / 155,760,000
- Unemployment Rate = 7.9%
- Rather than a reduction in the Unemployment of 300,000, there would only be a drop of 64,000 (with those 236,000 people continuing to seek employment).
- The Unemployment number would have moved from 12,332,000 to 12,268,000 (dropping by 64,000).
- The Labor Force would have moved from 155,654,000 to 155,760,000 (rising by 106,000).
- The Unemployment Rate is equal to Unemployed divided by the Labor Force, or 7.9%
In reality what happened was that 130,000 dropped out of the Labor Force; this was the case in spite of the fact that 165,000 were added to the Civilian Noninstitutional Population for the month.
Effectively, the 165,000 new entrants, were never counted in the Labor Force; instead, they moved directly into the 'not in the labor force' component of the Civilian Noninstitutional Population. The total for the 'not in the labor force' portion for the month of February, was 296,000 which equates to the 130,000 dropping out of the Labor Force and the 165,000 new entrants into the Civilian Noninstitutional Population (rounding in the Bureau of Labor Statistics reporting 130,000 + 165,000 appears to be 295,000 in not in labor force component, but is recorded as 296,000).
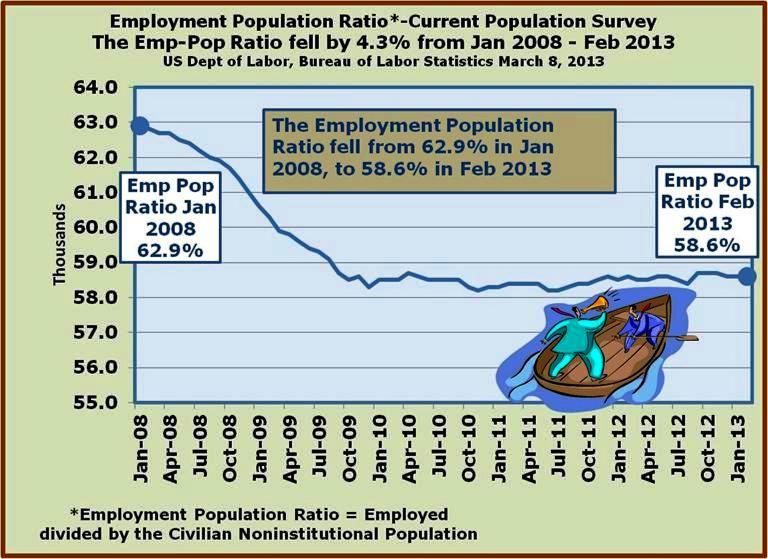
The Employment Population Ratio is one of the labor statistics closely monitored by the Federal Reserve System…note that in February 2013, the Employment-Population Ratio stood at 58.6%. It has been at or around that 58.6% rate since August 2012. Since the Employment-Population Ratio relates the employment numbers to the Civilian Noninstitutional Population; while the number of employed has been on the rise, it is not nearly enough to offset the new (potential) workers coming of age.
2012 Volume Issue 24
Economic Newsletter for the New Millennium
November 17, 2012
www.econnewsletternov172012.com/
This important ratio [Employment-Population Ratio] is watched closely by the Federal Reserve (among others) to get a feel for the health of the labor markets.
On February 2, 2012 Federal Reserve Chairman, Ben S. Bernanke, Before the Committee on the Budget, U.S. House of Representatives:
www.federalreserve.gov/newsevents/testimony/bernanke20120202a.htm
"Nevertheless, as shown by indicators like the rate of unemployment and the ratio of employment to population, we still have a long way to go before the labor market can be said to be operating normally."
Bernanke Seen Not Knowing Jobless Rate Below Fed Forecasts
March 19, 2012
[following excerpt from interview with 59 year-old David Waldrop, unemployed]
""There was certainly nothing in my area at my level," he said. While the right opening might pull him back to employment, for now he sees his exit from the U.S. labor force as permanent. "I don't see it happening," he said. "I don't see anything offering opportunities."
is one of millions who have dropped out of the labor market in the aftermath of the deepest recession since the Great Depression, causing the employment-to-population ratio to fall to 58.6 percent from 62.7 percent at the end of 2007. Federal Reserve Chairman Ben S. Bernanke says the decline reflects weakness in the economy that's causing discouraged Americans to leave the workforce, bolstering his decision to add to his record monetary stimulus in January."
With this knowledge of the FED's (Federal Reserve System) concerns regarding the labor markets, it's pretty clear that – at least from this standpoint, the FED won't be talking about higher interest rates in terms of raising the targeted Fed Funds Rate any time soon.
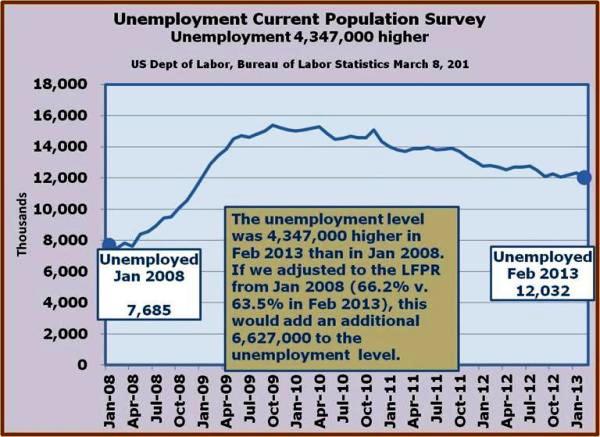
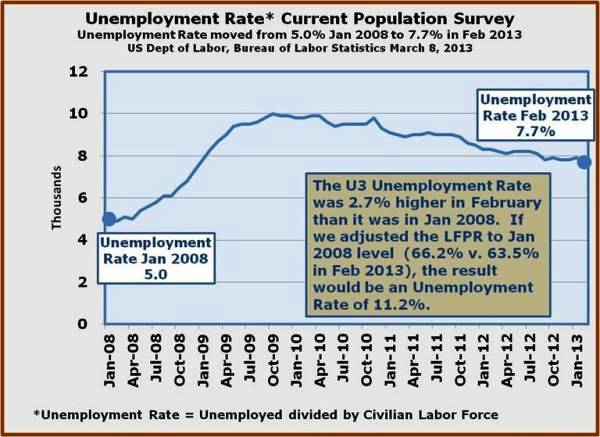
We've stated the fact over and over again that if the Labor Force Participation Rate was anywhere near the 66.2% it registered in January 2008, the unemployment rate would be significantly higher than the current 7.7% registered in February 2013.
Let's walk through it yet again…
- The Labor Force Participation Rate = Labor Force / Civilian Noninstitutional Population
- Labor Force = Employed + Unemployed
February 2013
- Labor Force = 155,524,000
- Employed = 143,492,000
- Unemployed = 12,032,000
- Civilian Noninstitutional Population = 244,828,000
- The Labor Force Participation Rate = Labor Force / Civilian Noninstitutional Population
- The Labor Force Participation Rate = 155,524,000 /244,828,000
- The Labor Force Participation Rate = 63.5%
…if the Labor Force Participation Rate was at 66%
- Labor Force = Civilian Noninstitutional Population X the Labor Force Participation Rate
- Labor Force = 244,828,000 X 66%
- Labor Force = 161,586,500
- Unemployed = Labor Force - Employed
- Unemployed = 161,586,000 – 143,492,000
- Unemployed = 18,094,000
- Unemployment Rate = Unemployed / Labor Force
- Unemployment Rate = 18,094,000 / 161,586,000
- Unemployment Rate = 11.2%
Keep in mind that official or reported unemployment rate, is termed as the U-3 rate. It doesn't include the discouraged workers, the part-time workers who would prefer to work full-time, the underemployed, etc. While the U-3 unemployment rate for February 2013 registered 7.7%, the more inclusive U-6 unemployment rate came in 14.3%
HOUSEHOLD DATA
Table A-15. Alternative measures of labor underutilization
www.bls.gov/news.release/empsit.t15.htm
By simply tacking on the additional 3.5% we added to the 7.7% U-3 Unemployment Rate to compensate for the lower Labor Force Participation Rate, it is entirely conceivable that we would have a U-6 Unemployment Rate approaching 18%.
The 'not in the Labor Force' simply measures the difference between the Civilian Noninstitutional Population and Labor Force.
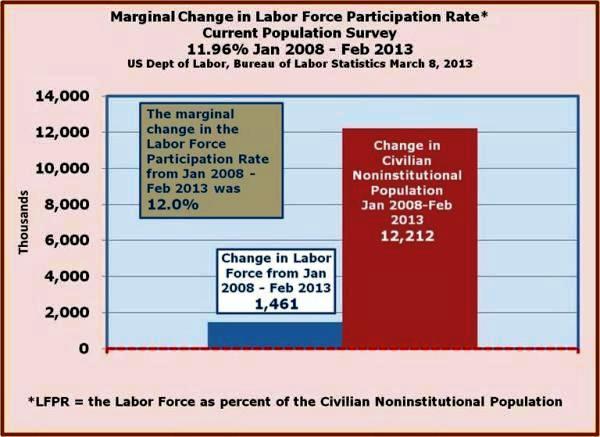
Keeping that in mind, since January 2008, the Civilian Noninstitutional Population (those 16+ who are not in the military, prison, or otherwise institutionalized) expanded by 12,212,000 people, while the Labor Force expanded by 1,461,000. What this means is that of the 12,212,000 people added to the population, only 1,461,000 moved into the labor force. The balance of the people, 10,750,000 (rounding) are not participating in the labor force. So, effectively, 88% of the marginal Civilian Noninstitutional Population (those entering from January 2008 through February 2013) are on the sidelines. This is not to say that all of those people are teenagers and young adults, but it does help to illustrate why so many young people are either not working or have given up on employment all together.
Regardless of the age groups affected, with the 'not in the Labor Force' numbers rising so rapidly, unless this phenomenon is altered, the U.S. will likely have 100,000,000 people not participating in the labor force within five years. This is an important number to watch because it captures those dropouts from the Labor Force and those new entrants (or returning, e.g., vets, those leaving prison, etc.) to the Civilian Noninstitutional Population who are not participating in the production of goods and services.
NOW TURNING TO THE PAYROLL SURVEY DATA
One of the reasons that the Employment numbers in the Payroll Survey (Current Employment Statistics) are a bit higher than those in the Household (Current Population Survey) is that there has been some movement in employment from the non-Payroll portion of the Household Survey to the Payroll Survey portion of the Household Survey. What this simply means is that some people, who were previously self-employed or otherwise working in small businesses simply not counted in the Payroll Survey, have been hired into firms that are included in the survey population.
Thoughts on measuring employment in the Payroll Survey and the Household Survey
www.econnewsletternov172012.com/
"As it turns out, over time, the two surveys pretty much run parallel, with the Current Population Survey measuring a slightly larger swath of the population due to its coverage of farm workers, self-employed or otherwise small firms not tallied by the Payroll Survey or Establishment Survey (Current Employment Statistics). Historically, the Establishment Survey covers about 94 to 95% of the Current Population Survey."
Just keep in mind that both the Establishment Survey and the Current Population Survey (CPS) are published monthly, and while the numbers in the former (236,000 for February 2013) might be higher than the latter (170,000 for February) the CPS is the larger, more inclusive measure in the long-term since the respondents include people covered in the Payroll Survey and those measured outside of it.
Private and Public Sectors in the Payroll Survey
In the following time series presentations, in breaking down employment in the Establishment Survey it is clear that all segments included, ranging from the private sector through the public have all been negatively impacted, that is all of them with the notable exception of the employment at the federal government level which has grown.
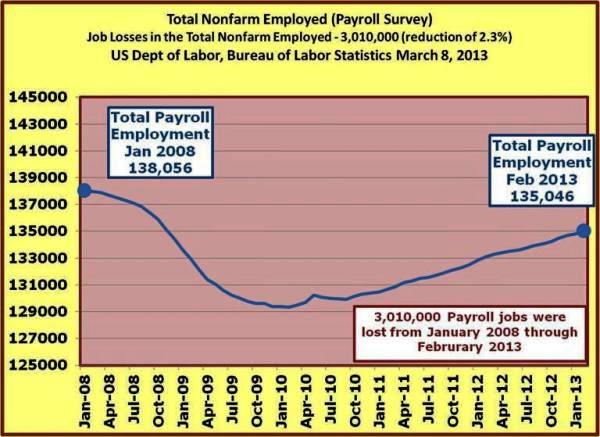
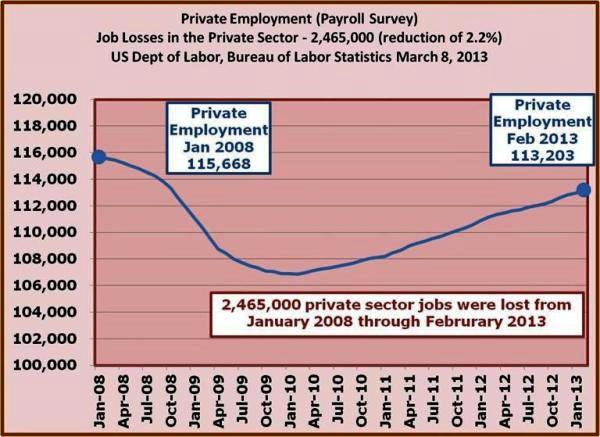
It's a relatively simple to see that the private sector employment has been suffering since 2008, and while it has been clawing its way back to January 2008 levels (still at a 2.5 million job deficit), bear in mind that the population has grown by 12.2 million in that interim.
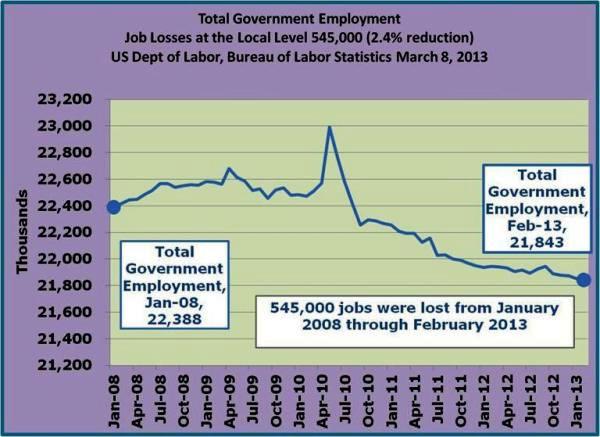
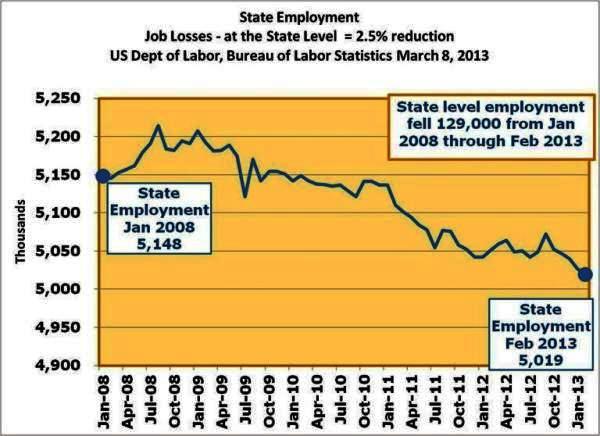
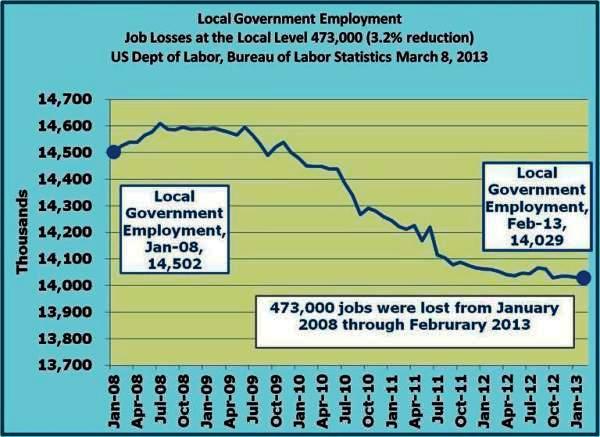
In addition to the private sector, the public sector has been hit very hard as well, especially so at the local and state level. Since it is much more problematic for the local and state jurisdiction to run budget deficits, it is no wonder that the impact on the employment front was felt so much more (and more quickly) at these levels, vis-à-vis the federal level which has in fact grown.
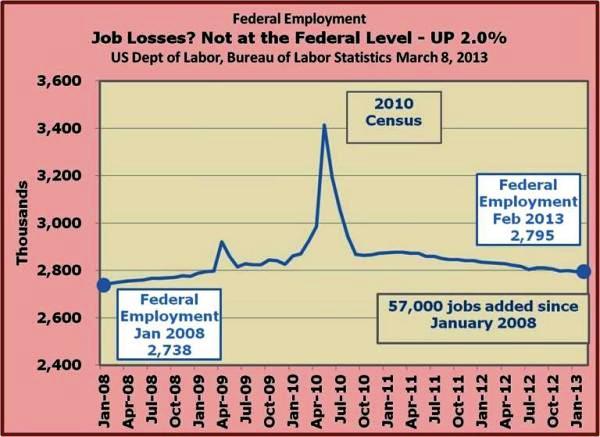
The question begged is how is that the federal level has been able to maintain its employment levels and in fact expanded a bit since January 2008? The short answer is that deficit spending has afforded the federal government to spend at higher levels in general and it is reflected in expansion of the federal employment base more specifically. While we've discussed it extensively in previous newsletters and will do so in future newsletters, suffice it to say that continued deficit spending (adding to the debt level) has its limits. We've seen the effects of budgetary constraints in employment at the state level and more significantly at the local level – certainly driven by the collapse in employment in private sector, but we have yet to see the full effect at the federal level.