
2013 Volume Issue 12
September 18, 2013
For a downloadable version, click the following:
…a bit more compressed version of the PDF
Confusing Trends in the Balance of Payments; Some Ongoing Problems But Is There a Light at the End of the Tunnel?
The business journals and other media sources such as the BBC News have been featuring stories of economics and financial problems for the nation of India. Domestic monetary policies of the U.S. of A. have been pointed to as resulting in large flows of capital and remittances of India’s nationals in the U.S. back to India due to the very low interest rates obtainable here. These are examples of economic and financial behavior that impact the Balance of Payments Accounts (BOPA) and seem to run counter to the old axiom, ‘You can’t have your cake and eat it too.’ In the case of India, the threat of the Central Bank of the U.S. pulling back from its massive and continuing purchases of U.S. Government securities and Mortgage Backed securities with the resulting rise in interest rates in the U.S. has put pressure on the Indian Rupee.
This article will discuss such issues in a more general framework of the Balance of Payments Accounts (BOPA). The examination will utilize the past history of similar problems facing the international community and its growing interdependence.
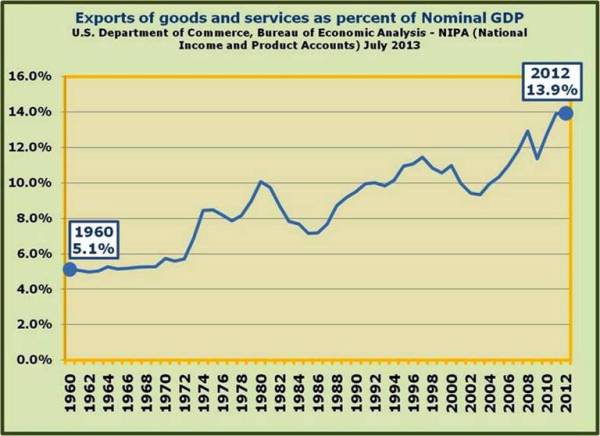
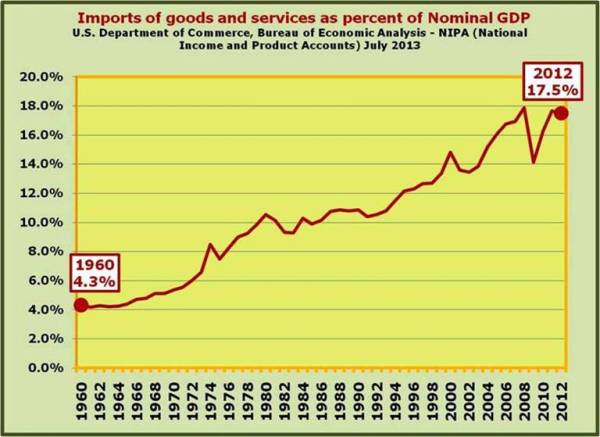
When the Editor of this newsletter began teaching at the college level, U.S. exports were around 5% of GDP. Today they are approaching 15% of GDP and of course the GDP base is much larger now than it was back when I began my professorial career.
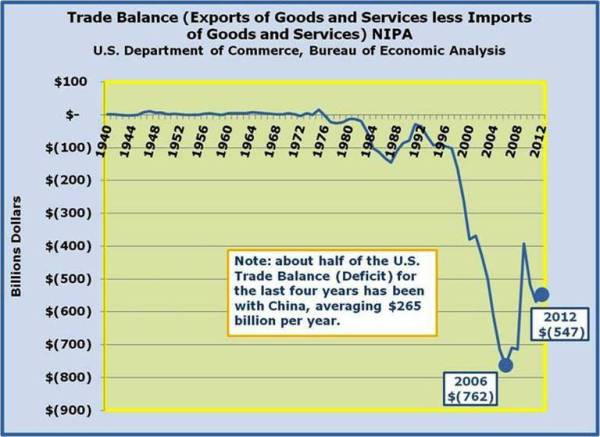
During this same time period, the Trade Balance, technically called the Balance on Merchandise and Services Accounts in the Balance of Payments Accounts (BOPA) alternated between patterns of Trade Balance surpluses to one of Trade Balance deficits. To avoid confusion, be reminded that this same Trade Balance is referred to as Net Exports of Goods and Services or NEGS, in the National Income and Product Accounts (NIPA).
Throughout this alternating pattern of imbalances in the Trade Balance, a major cause of the periodic deficits began with a willingness by the U.S. to allow the (U.S.) Dollar to be overvalued through the fixed exchange rate system – known as the Bretton Woods-IMF fixed exchange rate system, which remained in operation from roughly 1947-1971. Since the abandonment of the Bretton Woods System, the pattern changed to a more or less ‘dirty’ floating exchange rate system.
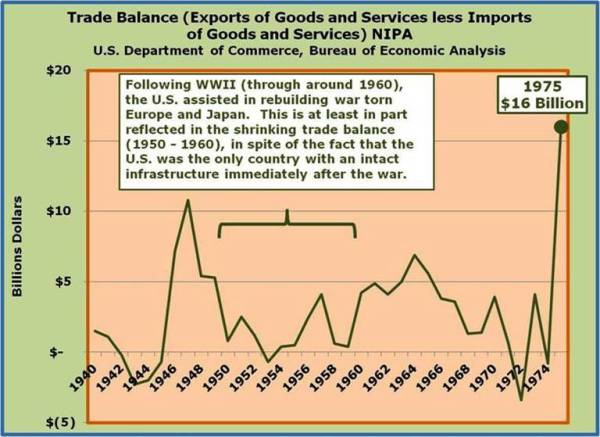
It seems apparent that these periodic patterns of Trade Balance deficits were (and still are) due to our foreign policy of rebuilding war-torn parts of the world, beginning after WWII and moving into its current role in the regional balancing of nuclear powers such as between Mainland China and its neighbors, India, Pakistan, and maybe North Korea.
Other nations have a much higher exposure to international trade and finance than the U.S. relative to the size of their economies. Despite this relatively small international trade sector, in absolute dollars, the U.S. is one of the 900 pound gorillas in international trade.
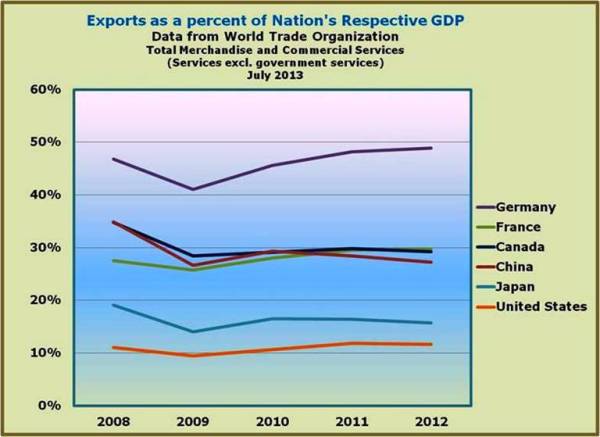
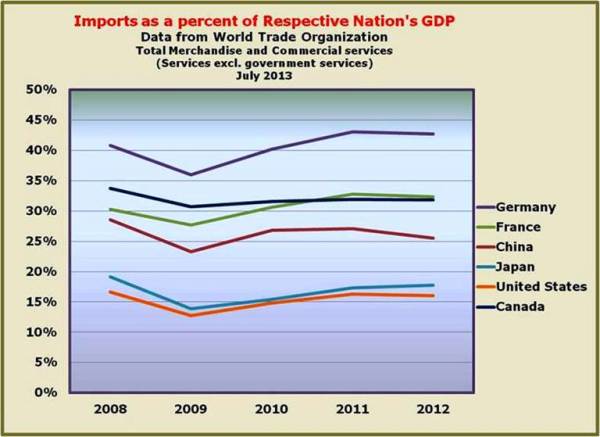
As the accompanying charts show, the U.S. is always right there near the top of the export and import list in absolute dollars or their foreign currency equivalent.
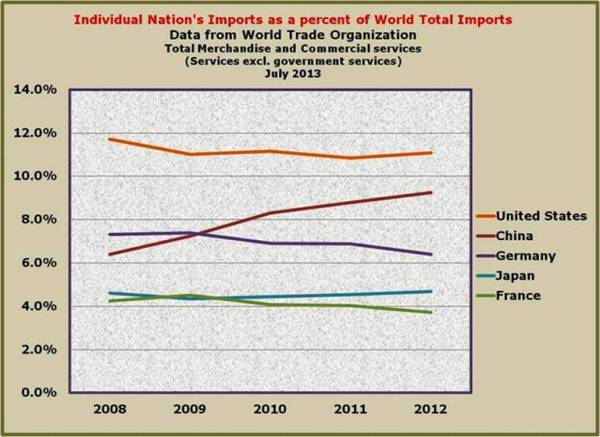
Currently in the U.S., as a percent of aggregate demand, exports are less than Personal Consumption Expenditures or PCE, Gross Private Domestic Investment or GPDI, and Government Consumption Expenditures and Gross Investment or GCE&GI; however, exports loom large in several sectors such as agriculture.
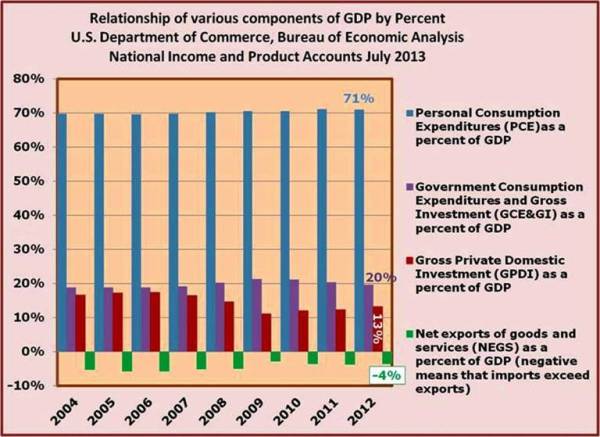
In the National Income and Product Accounts or NIPA, international trade in merchandise (goods) and services is shown on a net basis by subtracting imports from exports, terming it as Net Exports of Merchandise (Goods) and Services or NEGS.
There are several types of balances in the Balance of Payments Accounts (BOPA) of nations. The one having the most direct impact on the overall level of economic activity and the level of average prices is the trade balance, formally referred to as the Balance on Merchandise (Goods) and Services Accounts in the BOPA. Again, in the NIPA, it is referred to as Net Exports of Goods and Services or NEGS.
The biggest driver of imports is the domestic level of economic activity, assuming exchange rates are constant, while the biggest driver of exports is the level of economic activity of a nation’s trading partners, again assuming constant exchange rates between the currencies of trading partners.
As the rate of economic growth in much of the World has slowed down in recent years, imports of many nations shrink which of course are the exports of their trading partners. Much like the balanced budget multiplier effect, the slowdown of international trade adds downward pressure to the already slow recoveries of many nations including the U.S. The danger is similar to what fighter pilots fears in a dogfight, i.e. a stall and fall. While some positive signs that manage to reach the headlines, the past few years should warn us not to become overly optimistic.
As we examined in the previous newsletter on this web site, the usual narrow V-shaped recovery seems to have changed to a Lazy L-shaped recovery over the course of the last three recessions.
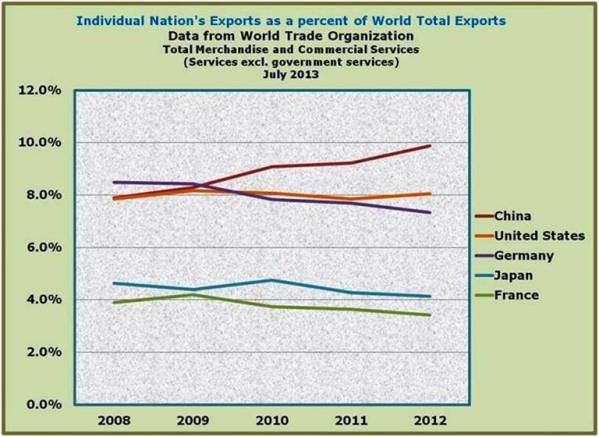
The worsening export picture for neo-mercantilist nations like Mainland China should put U.S. policy makers on guard for a repeat of some of the 'beggar thy neighbor policies'that occur when periods of sluggish growth beset the world economy, such as tariff increases, increased intervention in foreign exchange markets, as well as subsidies to exports of firms.
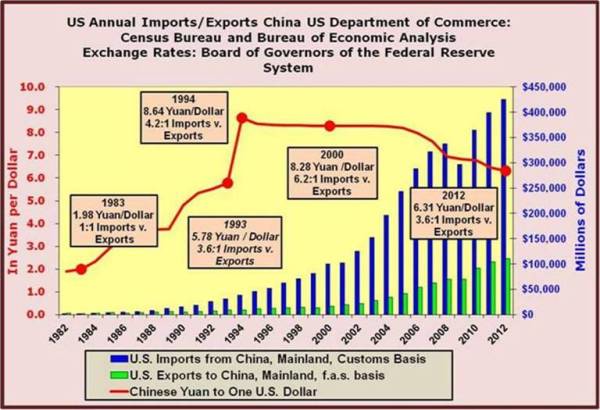
A second significant factor impacting the Trade Balance over time, are the exchange rates. A case in point is the exchange rate between the currencies of Mainland China and the U.S. As late as 1983, the dollar price of the Yuan was around $0.50 per Yuan. Its reciprocal is the Yuan price of one Dollar and was 1.98 Yuan per Dollar. Following the rise of political discord culminating in the student riots in Tiananmen Square in 1989, the Mainland Chinese intervention in foreign exchange markets resulted in appreciating the U.S. Dollar in respect to the Yuan. It eventually stabilized at around $0.125 for 1 Yuan, a decline of around 75% in the U.S. Dollar price of the Yuan. As reciprocals of each other, the Yuan during this period was depreciating in respect to the U.S. Dollar. By 1994, the Yuan stood at 8.64 Yuan per U.S. Dollar, an increase in the Yuan price of the U.S. Dollar of over 300%!
Terms such as appreciation and depreciation of a currency are usually confusing to most people. If a currency such as the U.S. Dollar appreciates, it means that the Dollar price(s) of a foreign currency (currencies) decreases. If the Dollar depreciates, it means that the Dollar price(s) of a foreign currency (currencies) increases. If the currency in question is part of a fixed exchange rate system, currencies of that system are 'pegged’ to each other at a fixed exchange rate. If a currency is devalued, the peg is changed and other currencies in that system become more expensive. In such a fixed exchange rate system, devaluation of a currency has the same effect as depreciation of a currency in a floating rate setting. If a currency is revalued (upward) it has the same effect as appreciation in a floating rate system. To maintain constant exchange rates between the currencies in a fixed exchange rate system, constant intervention, usually by central banks, in foreign exchange markets occurs.
Prior to this ongoing intervention by Mainland China, the U.S. Trade Balance (Balance on Merchandise and Services Accounts in the BOPA nomenclature while being termed NEGS in the NIPA), was pretty much in balance, i.e., our exports of merchandise and services to Mainland China were usually close to equality in dollar terms with our imports of merchandise and services from Mainland China.
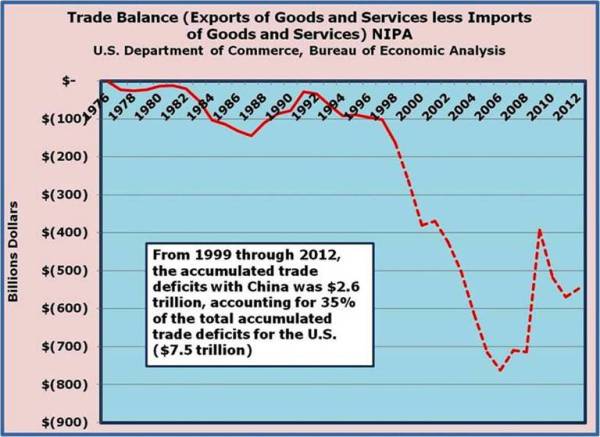
That changed drastically with the Chinese intervention in the foreign exchange markets. As a result of that ongoing intervention, the U.S. Dollar appreciated in respect to the Yuan (pegged for many years at a $0.125 for one Yuan), and the U.S. imports of merchandise and services from Mainland China ballooned relative to U.S. exports of merchandise and services to Mainland China, as the charts shown above clearly show.
As explained above, the appreciation of the Dollar against the Yuan meant that the price of the Yuan was cheaper (about 75% cheaper). As long as the Yuan price of Chinese goods in question remained stable, the U.S. Dollar price of Chinese imports fell by around 75%. By the same line of reasoning, the Yuan price of the Dollar rose and the Yuan price of American imports increased by over 300% and lessened those imports from the U.S. into China relative to what they would have been without such intervention. Chinese imports from the U.S. are the same as the U.S. exports to China and hence our exports to China were also adversely affected.
The result was the development of a large and continuing deficit in the U.S. Trade Balance with Mainland China. While in recent years the Dollar was allowed to depreciate a bit, it is still grossly overvalued with respect to the Chinese Yuan (6.12 Yuan per Dollar, or $0.16 per Yuan Sept 18, 2013).
Since the U.S. could have also intervened and offset the Chinese Government's intervention in the foreign exchange markets and did NOT, we must assume it was our foreign policy to let China run a large surplus in their Trade Balance with the U.S. This of course, is the same thing as a large deficit in the U.S. Trade Balance with China.
A trade deficit of the U.S. gives rise to what is often called a LOCOMOTIVE effect. In this case, the U.S. can be seen as the engine pulling a line of box cars which is the Chinese economy.
Exports add to the level of aggregate demand, and of and by them self stimulate the level of domestic economic activity and can impact the average level of prices at times. Imports have the opposite effect on the domestic level of economic activity and to the behavior of the overall price level, as they add to the aggregate supply of the economy.
In our example above, a major part of the Chinese miracle was the willingness of the U.S. to let China manipulate the exchange rate and enable them to run large trade surpluses with the U.S. This enabled Mainland China to produce a lot more goods and employ a lot more labor than was justified by the level of consumer spending within China.
A similar policy after WWII occurred. In that case, the U.S. allowed its currency to be over-valued with respect to the currencies of nations such as Japan and Germany in the Post WWII Bretton Woods Fixed Exchange Rate System. Much of their 'miraculous recoveries’ were due to our acceptance of the over- valuation of the U.S. Dollar. Talk about 'turning our other cheek to our enemy’…that is exactly what we have often done as a nation.
If you have studied the principles of economics, you have probably encountered the concept of a Production Possibility Frontier or Curve (PPF/PPC) [or Production Possibilities Frontier or Curve]. Just below you will see a picture of such a PPF. Combinations of an economy’s production or output lying on the PPF indicate that the productive resources of the economy are fully and efficiently employed. Production or output combinations lying within the PPF indicate that the productive resources of the economy are either inefficiently employed or are less than fully employed.
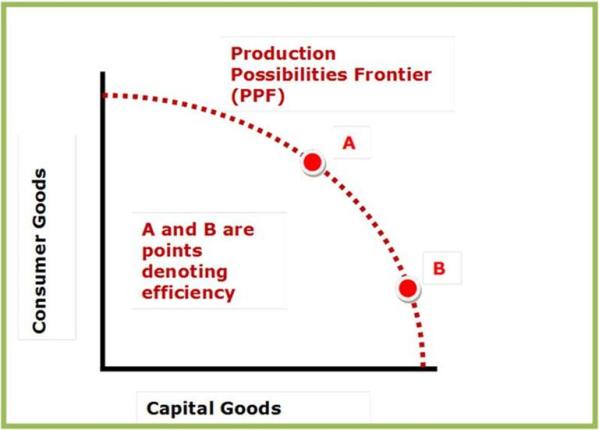
CONSUMPTION – INVESTMENT POSSIBILITIES CURVES
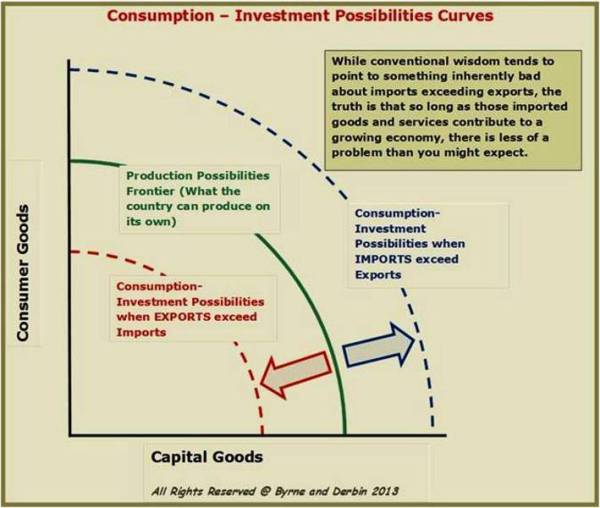
Again, in first of the two previous charts, we touch upon a very important topic in economics: Production Possibilities Frontier (PPF) or Production Possibilities Curve (PPC). To put it simply, if a nation produces anywhere along the curve, whether there is a bias toward consumer goods or capital goods (investment), that country is operating at an efficient manner. That is to say, if the country is operating within (inside or closer to the origin), then it is not efficiently employing one or more of its productive resources (labor, capital, entrepreneurship, and land). Since the PPF or PPC line represents the full utilization of its resources, it cannot produce at a point outside of the line. In order to produce beyond (outside) of its PPF or PPC, it must grow its economy or develop and institute those new technologies.
Expanding upon the concept of the PPF/PPC – aside from growing the economy internally (thus pushing the PPF/PPC outward), we have the opportunity through international trade, to push beyond the PPF/PPC level of goods and services available from the domestic economy’s own productive efforts. This ability to consume and/or invest beyond our PPF/PPC constraint is a very important reality. International trade, speaking specifically to imports in this case, affords a country to effectively expand the availability of consumer or capital goods available for the nation. This is the situation the U.S. has found itself in going back several years (as reflected in the longstanding and recurring trade deficits). So long as the country is able to grow its economy at a reasonable rate, the imbalance of trade (deficits) in terms of the U.S. can prove to be beneficial.
This is especially the case when, for example, the imports are of the consumer goods variety, which would presumably enable less domestic production of consumer goods (due to their replacement by imported consumer goods). In this case, the domestic economy would be able to shift more production toward capital goods.
It is definitely not the case if the imports are of the variety that are often the scourge of developing nations, i.e., conspicuous consumer goods like Mercedes and expensive champagnes.
Simply put, this expanded consumption can come in the form of importing consumer goods or capital goods (investment) and can allow the country to consume beyond its production possibilities frontier (PPF) or production possibilities curve (PPC). It must not be forgotten that the trade deficit for good or ill, must be financed by net unilateral transfers and/or foreign long and short-term investments from abroad.
The flipside to this discussion concerning the CONSUMPTION – INVESTMENT POSSIBILITIES CURVES speaks to countries that have trade surpluses such as Mainland China…the goods and services (consumer goods and/or capital goods) are denied to the domestic country, thus effectively reducing the availability of those items to the domestic consumers. For example, while China has been exporting more goods and services to the U.S. for many years, it has reduced its domestic CONSUMPTION – INVESTMENT POSSIBILITIES.
Onward…
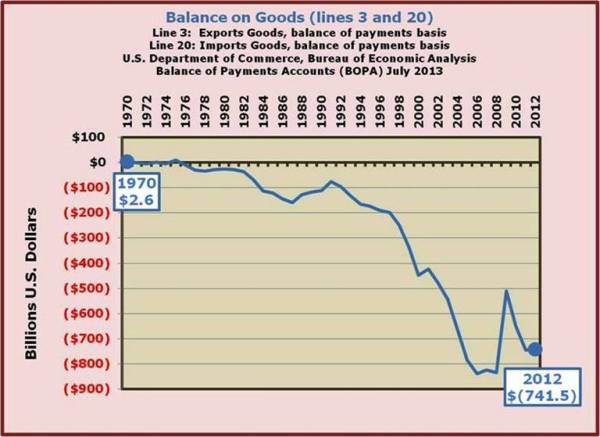
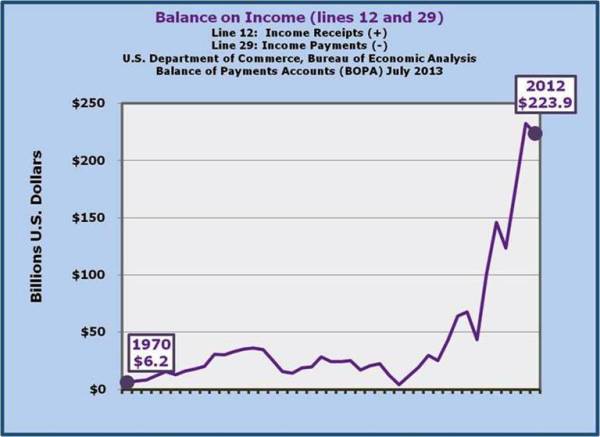
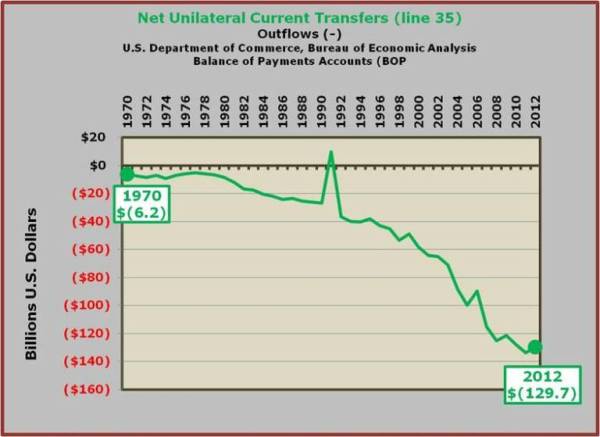
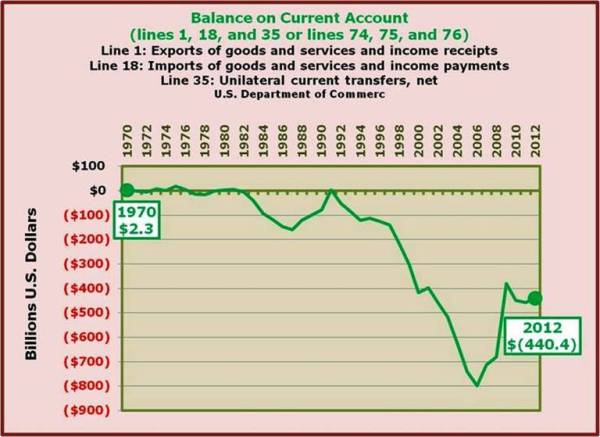
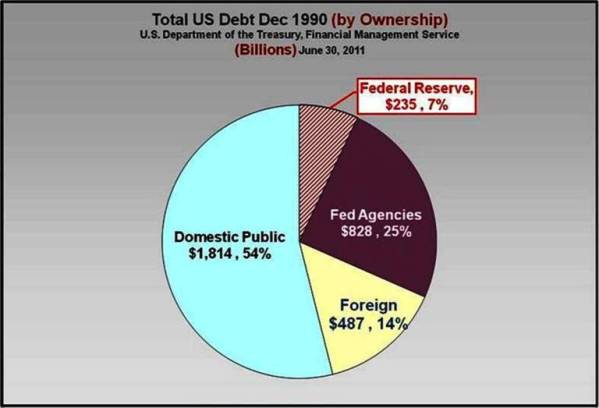
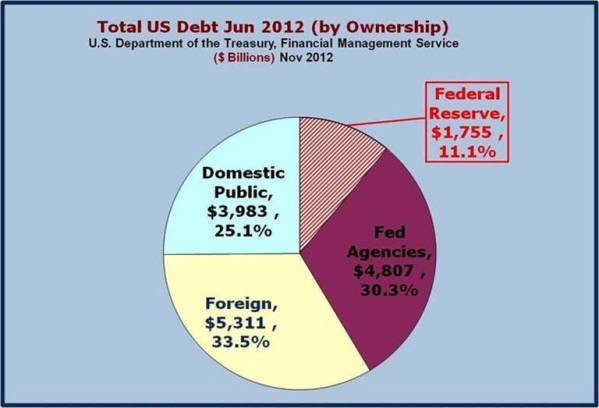
The following charts display the behavior of the U.S. Trade balance with the Rest of the World along with the component parts of that Balance. They also show the behavior of Unilateral Transfers which when added to the Trade Balance result in the Current Account balance. The Current Account Balance, when negative, indicates the need for the U.S. to finance it with funding denominated in the currencies of the nation with which the deficit in the Current Account Balance exists. That sum so needed, gives rise to a Combined Capital Account Balance that is termed a surplus on Combined Capital Account basis. The Combined Capital Account includes both Long-term and Short-term Capital Accounts on a net basis and both in the form of debt and equity investments. This explains why we have such a large 'debt’ to Mainland China!
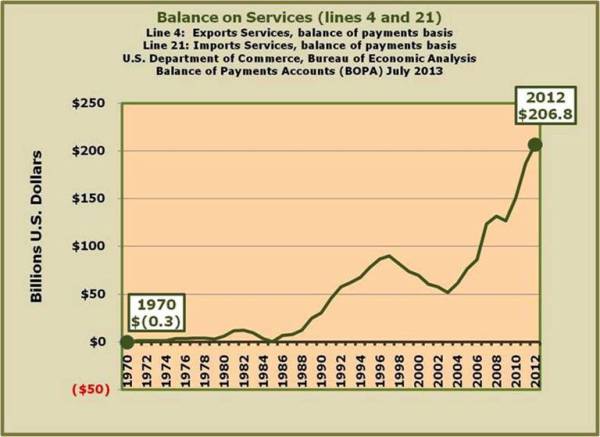
Note that the U.S. has a surplus on Services Account during the more recent years when it was developing a trade balance deficit. This can be confusing but the Services balance is combined with the Goods of Merchandise Account to form the Trade Balance (or Balance on Merchandise and Services Accounts). The Services Account is a relatively small account dollar wise but it is also a very complex account including such things as the repatriation of profits and interest on past investment by the U.S. economy in the rest of the world. The international investments themselves when they occur are included in the Capital Accounts of the BOPA. Without the Services Account, the Trade Balance would have shown even larger deficits over the past twenty-five years or so.
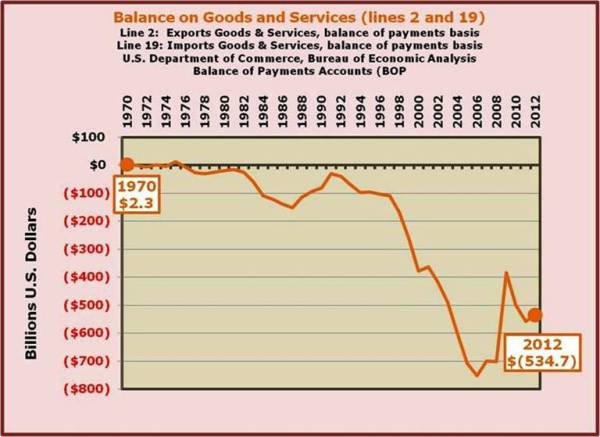
The net effect on the overall level of economic activity and its average price level is reflected in the Trade Balance, i.e., a nation’s exports less its imports or its Net Exports of Goods and Services (NEGS). Deficits in our Trade Balance depress our overall level of economic activity and have a disinflationary impact on our price levels, assuming constant exchange rates. This is a cost of 'turning our cheeks to our enemies’.
Besides the Trade Balance, there are several other balances in our Balance of Payments that also have some significant effects. As pointed out in earlier newsletters on this web site, there are 5 accounts in the Balance of Payments (BOPA). These five accounts are the merchandise (or Goods) account, the services account, the unilateral transfer account, the long-term capital account, and the short-term capital account.
For certain purposes some of these accounts, in particular the short-term capital account, are further divided into component parts. For example, for certain reasons we might want to distinguish between non-liquid and liquid (sometimes referred to as 'hot money’ often based on speculative motives) short-term capital flows giving rise to a Net Liquidity Balance. For other reasons, we might want to distinguish between official governmental causes of short-term capital flows and those emanating from private sector causes. This is what is done in generating the Official Settlements Balance.
If correctly accounted for with nothing left out, the BOPA must balance as it is a double entry bookkeeping system and the sum of the debits must have a dollar value equal to the sum of the credits.
Then how do deficit and surplus balances occur, you ask? One or more of the accounts or parts of some accounts are left out and this gives rise to the possibility of imbalances. By including only some of these five accounts and leaving out others, we can focus on some interesting balances having significant consequences on both the global and domestic economies.
Let's consider what we call the current account balance. That balance includes three of the five accounts, the Merchandise sometimes called Goods Account, the Services Account, and the Unilateral Transfer Account, when taken together, excluding the Long and Short-term Capital Accounts, we end up with the Current Account Balance or the Balance on Current Accounts. When the imbalance has an arithmetically positive sign, which means that exports of goods and services plus foreign gifts (unilateral transfers) both governmental and private remittances to the U.S. sum up to a greater dollar amount than do our imports of goods and services and unilateral transfers or gifts from the U.S. to the rest of the world both in the form of government aid and private remittances, a surplus balance is the result.
As explained earlier in this article, if the U.S. experiences a surplus in its current account it means that the rest of the world has a deficit in their current account with the U.S. The rest of the world must finance their deficit by 'borrowing’ long and short-term from the U.S. To the extent that such long and short-term credit is relatively scarce, it may affect exchange rates as well as interest rates both here and abroad
How does this differ from the Trade Balance (the Balance on Merchandise and Services Accounts)? A trade surplus of the U.S. with the rest of the world means that the rest of the world has a trade deficit with the U.S. The rest of the world must finance their trade deficit in one of three ways; it can beg, so to speak, by seeking net unilateral transfers such as foreign aid or private remittances from the U.S., or it can 'borrow’ long-term from the U.S. on a debt or equity basis, or finally they can borrow short-term from the U.S. Obtaining financing long-term includes both debt and equity sources, even though the term borrowing is used.
Note that in financing a current account imbalance only net international long and short-term are available to finance the imbalance.
Why you ask is this the case? Because unilateral transfers are included in determining the Current Account Balance but are excluded in determining the Trade Balance (the Balance on Merchandise and Services Account as it is more formerly called).
And even more inclusive balance is called the Basic Balance which includes Merchandise, Services, Unilateral Transfers, and the Long-term Capital Accounts. Should the rest of the world have a deficit in its Basic Balance with the U.S., the only source of financing that Basic Balance deficit is short-term capital flows. Such a Basic Balance deficit is more dangerous to those experiencing it because reliance on short-term capital flows are usually riskier tam if long-term capital flows were also available. It is much like the distinction of financing your home with a credit card versus a 30 year mortgage!
Other uses have been made of the data found in the Balance of Payments for the U.S. When Monetarism was riding high prior to the recession of 1980-82, the international data was arranged to focus their impact upon the monetary base of the United States. Recall that for monetarism to be valid in explaining price level changes such as inflation or deflation, the linkages between the monetary base and the monetary aggregates must have a reliably predictable relationship that is referred to as the velocity of the monetary aggregate in question. Since the monetary aggregates such as M1 and M2, and at that time M-3, M-4 and M-5, to be useful policy tools in the attempt to control the rate of price level change, control of variables such as the monetary base were heavily relied upon in guiding monetary policy as influenced by Monetarism. With the demise of Monetarism as the guiding light of monetary policy, the FED has dropped the reporting and targeting of M-3, M-4, and M-5.
Let's now examine some changes that are occurring throughout the global economy that impact the U.S. as seen in its various balances in the BOPA.
An increasingly bright spot has emerged that shows strong signs of once again turning the pattern of deficit trade balances into surpluses in the Trade Balance. It is due to the rapid advances in 'fracking’ technology that will soon make us energy independent and perhaps a net exporter instead of being held hostage by market culprits such as OPEC. That is, if two things do not occur. The first of the two potential ambushes to energy independence and the end of Balance of Payments deficits of which I speak is a resurgence of 'Al Gore style’ environmentalism. Such policies as subsidies to farmers for corn and for ethanol production have caused much higher prices for corn based products and other crops that land has been given over to increased corn production. The second potential ambush is the occurrence of gaining control by BIG OIL over the shale fields where the fracking occurs for both oil and natural gas.
Do not think that either CANNOT happen. Recall the recartelization of the American segment of the crude oil industry during the period from about 1993 to 2003. For several years running now, we have been experiencing average crude oil prices around $100 per barrel instead of $30 which was the price prior to the completion of the recartelization of the American segment of the crude oil market around 2003. The anti-trust agencies did not stop it then, so don’t expect them to do so now if BIG OIL attempts to take over the majority of 'fracking’ firms, most of which are now relatively independent. The current prices for a barrel of crude oil are around $105-$110 per barrel for Brent Crude, West Texas Intermediate, etc.
As Lord Acton said many years ago, "Power tends to corrupt, and absolute power corrupts absolutely. Great men are almost always bad men."
