
2014 Volume Issue 6
June 3, 2014
For a downloadable version, click the following:
June 3 April vs March Jobs Reports
…a bit more compressed version of the PDF
The APRIL Jobs Report vs. the MARCH Jobs Report
In our last article, we discussed the overall state of the labor markets for the 16+ year old age group. There are of many ways of slicing and dicing and presenting the data available through the US Dept of Labor, Bureau of Labor Statistics, but for this article, we’ll stick with two areas of note: first, we’ll glance at the two surveys used to measure changes in the employment picture; and second, we will delve into the monthly employment summaries for March and April 2014. In our next articles, after revisiting the aforementioned topics, we will focus on the various populations segments (cohorts) to see how those groups have fared over the last several years and we will also explore the qualitative aspects of the employment pictures, e.g., part-time employment versus full-time employment.
A tale of two surveys…
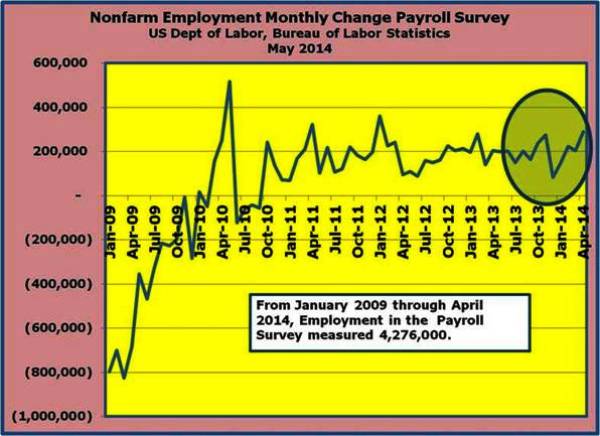
As the name implies, the Nonfarm Payroll Survey is a monthly survey performed by the Bureau of Labor Statistics, measuring changes in employment characteristics at establishments (firms/government entities). The sampling size of the survey includes about 554,000 business establishments covering approximately one-third of total nonfarm employment (effectively, a smaller subset at about 95% of the larger universe covered by the Household Survey). The Household Survey, performed by Census Bureau (US Dept of Commerce) for the Bureau of Labor Statistics is larger in terms of coverage (16+ year old Civilian Noninstitutional Population), but smaller in terms of sample size, approximately 60,000 households. The respondents are contacted directly in phone interviews.
For further explanation on the differences between the two surveys, please take a look at the following link from the Bureau of Labor Statistics:http://www.bls.gov/lau/lauhvse.htm#hvse
“Coverage. The household survey definition of employment comprises wage and salary workers (including domestics and other private household workers), self-employed persons, and unpaid workers who worked 15 hours or more during the reference week in family-operated enterprises. Employment in both agricultural and nonagricultural industries is included. The establishment survey covers only wage and salary employees on the payrolls of nonfarm establishments.”
Employment from the BLS household and payroll surveys: summary of recent trends – May 2, 2014
www.bls.gov/web/empsit/ces_cps_trends.pdf
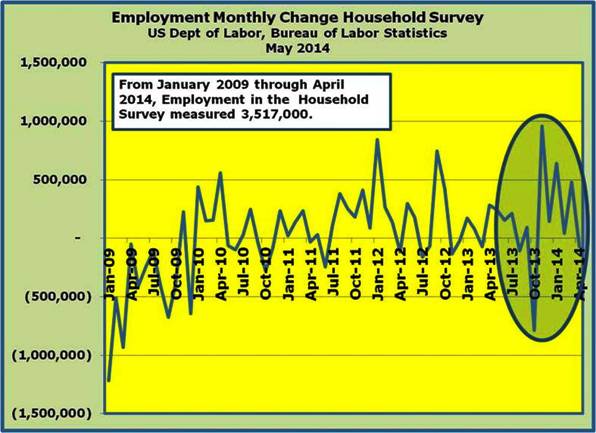
At issue – one could put forth regarding the two surveys, is which one really provides us with the best or more important data? For whatever reason, the media touts the results from the Payroll Survey, perhaps it has to do with the Bureau of Labor Statistics keying in on that data early on in its monthly summary; or perhaps it is has to do with what appears to be a smoother, or less varied monthly changes; or perhaps it has to do with the sample size being so much larger in the Payroll Report. At any rate, let’s just say that it is the Household Survey data that provides us with the more important data associated with the Labor Markets in the context of measuring unemployment, labor force participation, employment-population, etc.
Now in March 2014, we saw an Employment Summary Report (Household Survey) that was an ideal snapshot of how a healing and healthy labor market should look.
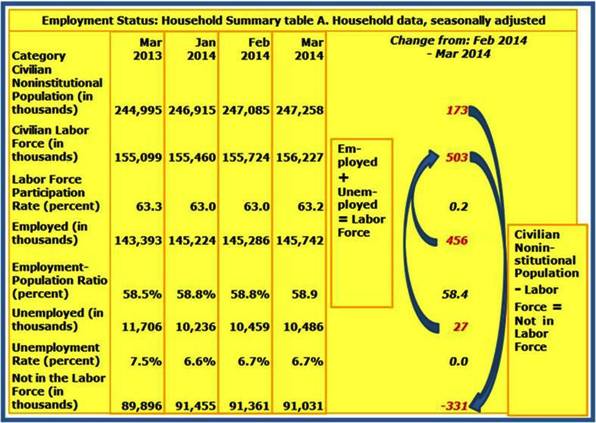
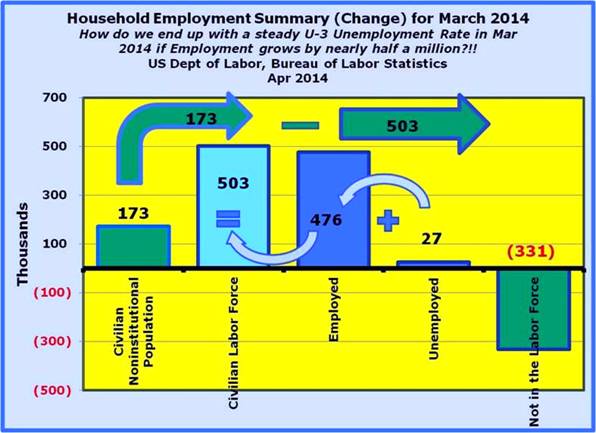
Monthly Changes for March 2014
www.bls.gov/news.release/archives/empsit_04042014.pdf
- Population growth of 173,000 - Population refers to the Civilian Noninstitutional Population (CNP) which includes all people 16 years of age and older who are not in the military, prison, or other institutions.
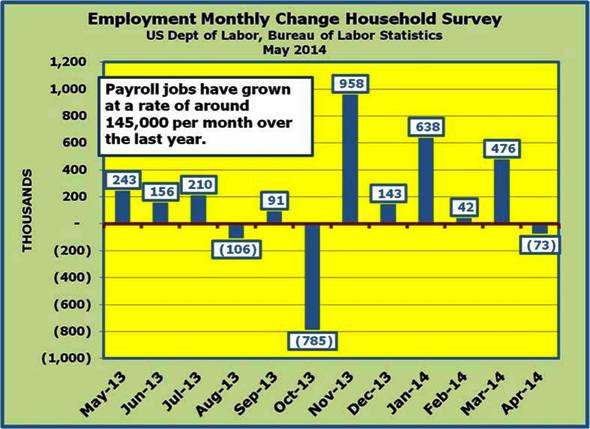
- The Labor Force growth of 503,000: Employed 476,000 plus those Unemployed (actively seeking employment) 27,000.
- The Labor Force Participation Rate or LFPR of 291% is the Labor Force 503,000 divided by the Civilian Noninstitutional Population 173,000.
- Employment measured in this survey differs (as noted previously) from that measured in the Payroll Survey. The Population refers to the Civilian Noninstitutional Population.
- The Employment-Population Ratio of 275% is the relationship between those Employed and the Civilian Noninstitutional Population (476/173). This ratio is on the radar of Federal Open Market Committee or FOMC in their policy making deliberations about every six weeks as seems to be a significant factor in determining when the FED will decide to act on raising the targeted Federal Funds Rate.
- As the phrase implies, the ‘Not in the Labor Force’ measures the difference between the Labor Force and the Civilian Noninstitutional Population. This group includes (among others) retirees and those who have given up seeking employment altogether. The ‘not in the labor force’ fell by 331,000, which meant that people were flowing back into the labor force --- a very good thing.
By these labor market measures, the month of March was outstanding. The downside was that the U-3 unemployment rate didn’t budge, remaining at 6.7%. Just the same, the Labor Force Participation Rate went from 63.0% to 63.2% and the Employment-Population Ratio went from 58.8% to 58.9% and those ‘encouraged’ workers flooded back into the market as illustrated by the 331,000 drop in the ‘not in the labor force’.
Moving on to April, we saw an Employment Summary Report (Household Survey) that was applauded for a large Employment increase in the Payroll Report of 288,000 and an unemployment figure plummeting 6.7% to 6.3%. As we noted in our last newsletter article (www.econnewsletter.com/may212014), the real problems were revealed when we drilled down on the Household Survey.
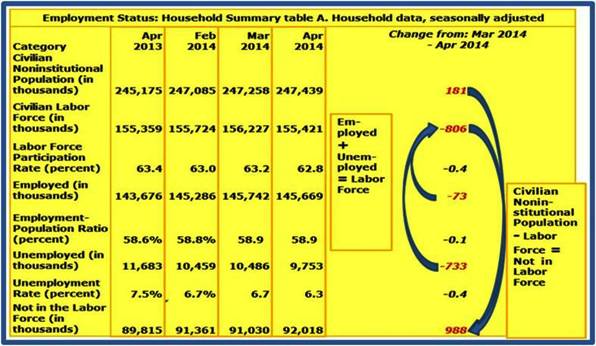
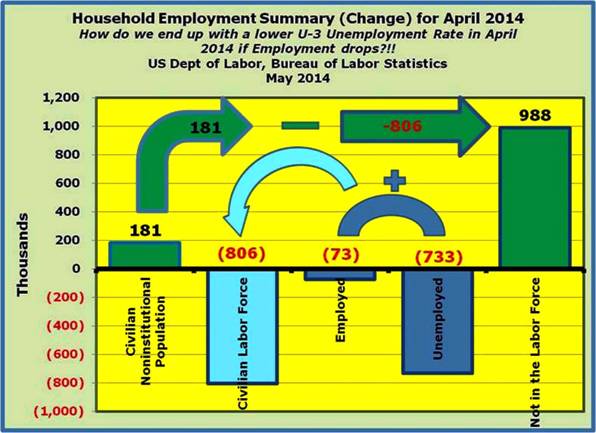
Monthly Changes for April 2014
www.bls.gov/news.release/archives/empsit_05022014.pdf
- Population growth of 181,000 - Population refers to the Civilian Noninstitutional Population (CNP) which includes all people 16 years of age and older who are not in the military, prison, or other institutions.
- The Labor Force fell by 806,000: Employed -73,000 plus those Unemployed (actively seeking employment) -733,000.
- The Labor Force Participation Rate or LFPR of -445.3% is the Labor Force -806,000 divided by the Civilian Noninstitutional Population 181,000.
- Employment measured in this survey differs (as noted previously) from that measured in the Payroll Survey. The Population refers to the Civilian Noninstitutional Population.
- The Employment-Population Ratio of -40.3% is the relationship between those Employed and the Civilian Noninstitutional Population. This ratio is on the radar of Federal Open Market Committee or FOMC in their policy making deliberations about every six weeks as seems to be a significant factor in determining when the FED will decide to act on raising the targeted Federal Funds Rate.
- As the phrase implies, the ‘Not in the Labor Force’ measures the difference between the Labor Force and the Civilian Noninstitutional Population. This group includes (among others) retirees and those who have given up seeking employment altogether. The ‘not in the labor force’ segment of the survey exploded by 988,000, which meant that people were leaving the labor force in droves, reducing the Labor Force at a 7.6% annual rate.
By these labor market measures, the month of April was catastrophic. While the U-3 unemployment rate fell from 6.7% to 6.3%, it only did so because of the 988,000 people left the labor force, including 733,000 from the ranks of the unemployed. The Labor Force Participation Rate went from 63.2% to 62.8% and the Employment-Population Ratio remained at 58.9%.
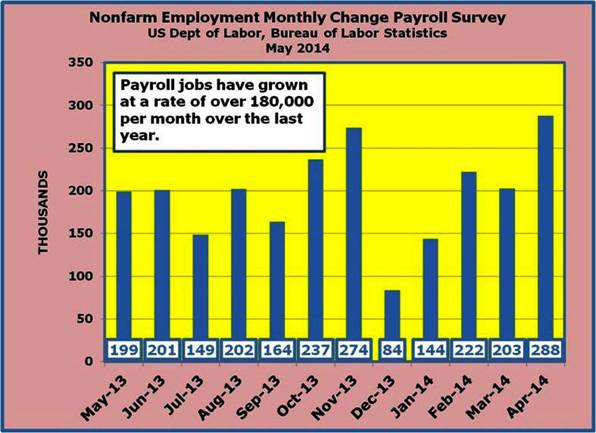
The lesson to be learned from this short presentation is that the reader has to look beyond the typical monthly snapshot of data as presented by the media. One need only look at the lukewarm view of the March Employment Report versus the fairly jubilant celebration over the April report. In March, the Payroll Employment report registered a healthy 203,000 growth, but was accompanied by an unchanged U-3 Unemployment Rate at 6.7%. Of course what was overlooked was the expanding labor force accompanied by the shrinking ‘not in the labor force’ segment. All in all, March was a great month. In April, Payroll Employment came in at 288,000 and the Unemployment Rate dropped from 6.7% to 6.3% - great stuff. The problem of course was that the Labor Force cratered, dropping 806,000 and the ‘not in the labor force’ segment fell by a whopping 988,000!
It will be interesting to see what comes out in the May Employment Situation on Friday, June 6, 2014. It’s clear that while there has been a good deal of fluctuations in the labor market of late, we have yet to see a sustained recovery in either the Labor Force Participation Rate (LFPR) or the Employment Population Ratio. Until we see improvement in the labor markets, there is no way we will realize meaningful, widespread economic growth, whether you want to measure it in terms of household income (real median Household Income has fallen over the past few years) or income disparity which continues to worsen.
Next up on our list is to look into the various labor market metrics by age group. Stay tuned.
