2014 Volume Issue 7
June 20, 2014
For a downloadable version, click the following:
June 20 Jobs Report Age Group PDF
…a bit more compressed version of the PDF
Changes in the Employment Picture by Age Group: So much for the Assertion that the Fall-off was primarily due to the Baby-Boomers rolling past age 65
Austan Goolsbee, former Chair of Economic Advisers to the president, 2010-2011, on the Sean Hannity Show, April 9, 2013
“Well, the labor force participation rate has gone down about 55 to 60 percent of it from aging of the population, about 40 percent from discouraged workers.”
The Index of Missing Economic Indicators; The Unemployment Myth
By Austan Goolsbee
Published: November 30, 2003 NY Times Op-Ed
“But the unemployment rate has been low only because government programs, especially Social Security disability, have effectively been buying people off the unemployment rolls and reclassifying them as ''not in the labor force.''”
Yes, that was 2003, around the time when the media began referring to the recovery from the Recession of 2001 as a ‘Jobless Recovery’:
The Jobless Recovery
Suffering from the recession’s aftershocks, labor market conditions continue to worsen
“Though the recession that began in March 2001 has not yet been declared officially over, most economists believe it ended early in 2002. However, the labor market downturn is far from behind us. Today’s labor market is much weaker than it was one or even two years ago, and the “jobless recovery” grinds on.”
By Jared Bernstein
March 25, 2003…Economic Policy Institute
On the Causes of Declines in the Labor Force Participation Rate
Shigeru Fujita
Federal Reserve Bank of Philadelphia
Revised: February 6, 2014
The main findings are summarized as follows.
- Between the first quarter of 2000 and the final quarter of 2013, the participation rate declined more than 4 percentage points. Roughly 65 percent of the decline is accounted for by retirement and disability. The increase in nonparticipation due to retirement has occurred only after around 2010, while nonparticipation due to disability has been steadily increasing over the past 13 years. Similarly, nonparticipation due to schooling has been steadily increasing and has been another major contributor to the secular decline in the participation rate since 2000.
- The number of those who did not look for a job (thus being out of the labor force) even though they wanted a job increased significantly between the fourth quarter of 2007 and the end of 2011. This group of “discouraged workers” explains roughly 30 percent of the total decline (around 2 percentage points) in the participation rate over the same period. Between the first quarter of 2012 and the fourth quarter of 2013, the participation rate of this group has been roughly flat.
- Almost all of the decline (80 percent) in the participation rate since the first quarter of 2012 is accounted for by the increase in nonparticipation due to retirement. This implies that the decline in the unemployment rate since 2012 is not due to more discouraged workers dropping out of the labor force.
- The likelihood of those who left the labor force due to retirement or disability rejoining the labor force is small and has been largely insensitive to business cycle conditions in the past, suggesting that the decision to leave the labor force for those two reasons is more or less permanent.
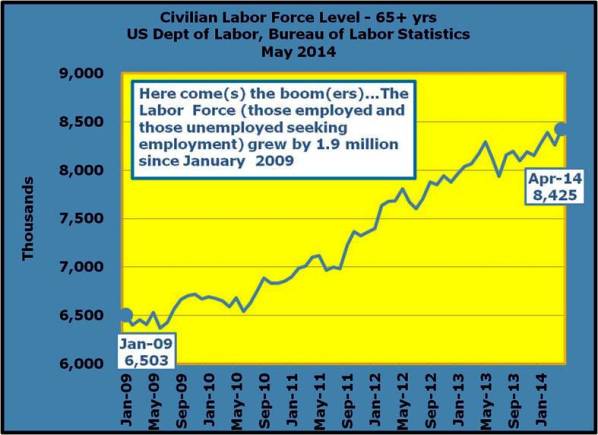
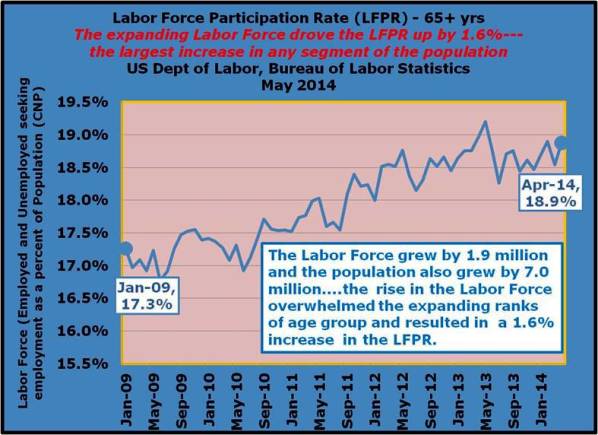
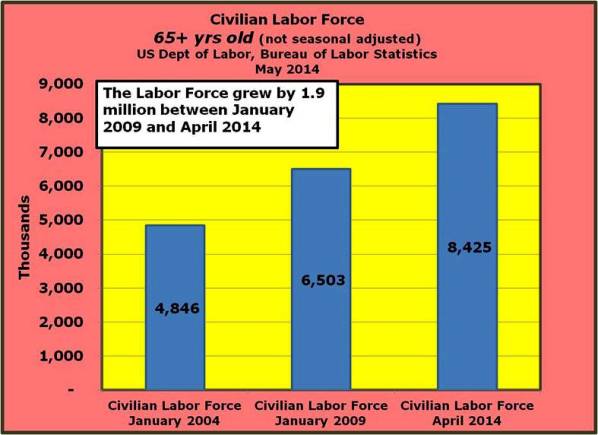
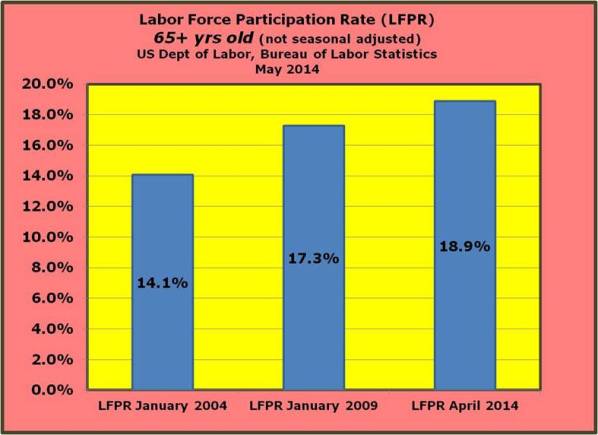
As we’ve noted in numerous articles, there has been a ‘disconnect’ in terms of employment characteristics or behavior when comparing the various age groups or cohorts over the last several years. We first noticed that while the 65+ age group had a low Labor Force Participation Rate relative to the younger cohorts, coming in at 18.9% in April 2014, that rate was 17.3% in January 2009 and 14.1% in January 2004. Unlike any of the other age groups, the 65+ set has grown in terms of the size of the Labor Force, Labor Force Participation Rate, and Employment Population Ratio.
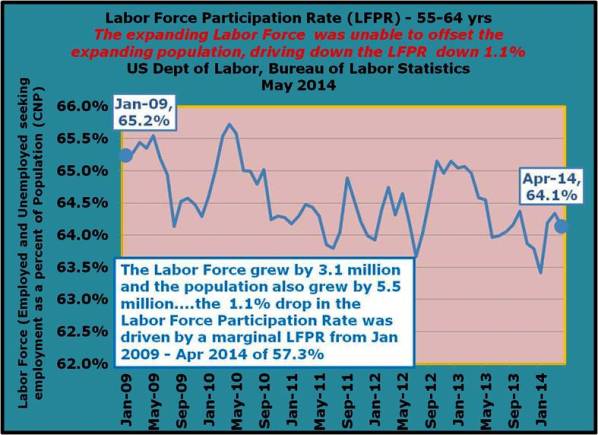
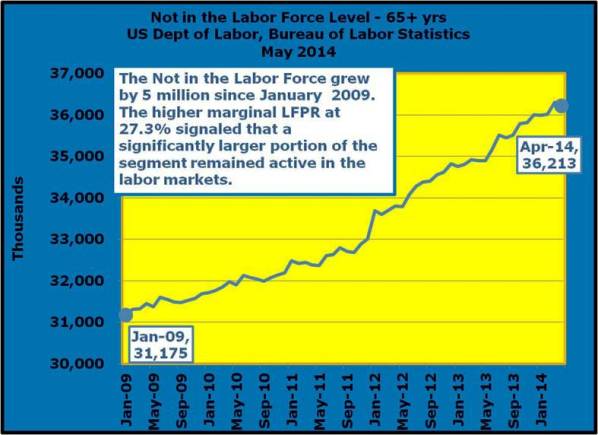
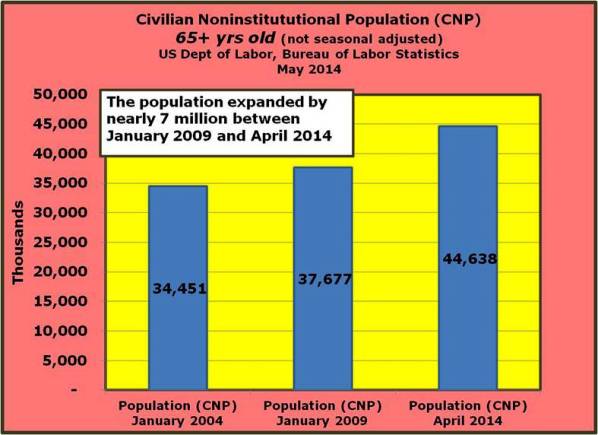
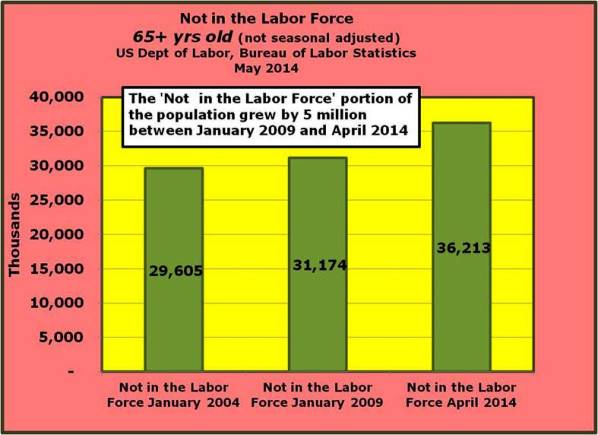
Just the same, as the Baby-Boomers (born 1946-1964) continue to swell the ranks of the 65+ age group, the ‘not in the Labor Force’ portion is also growing rapidly, increasing by 5 million from January 2009 to April 2014. The significant thing to note is that the conventional wisdom seems to point to the aging population as the major cause of the fall-off in the Labor Force Participation Rate [Labor Force (employed + those unemployed actively seeking employment) divided by Population (Civilian Noninstitutional Population: those 16+ who are not in the military, in prison, or otherwise institutionalized)]. It’s difficult to understand how it is that the Labor Force Participation Rate, among other measures of the employment, points to a continued and growing presence for the 65+ segment while the rest of the groups continue to underperform.
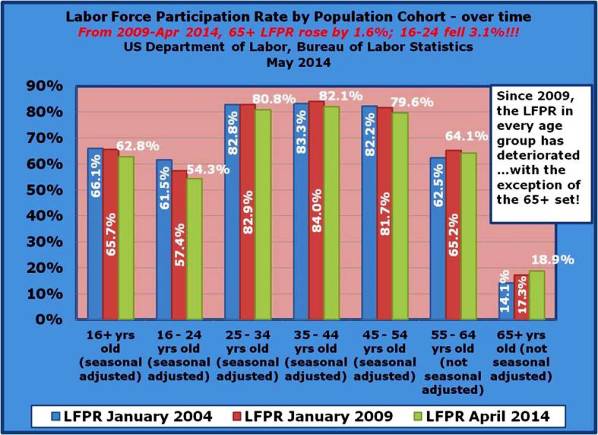
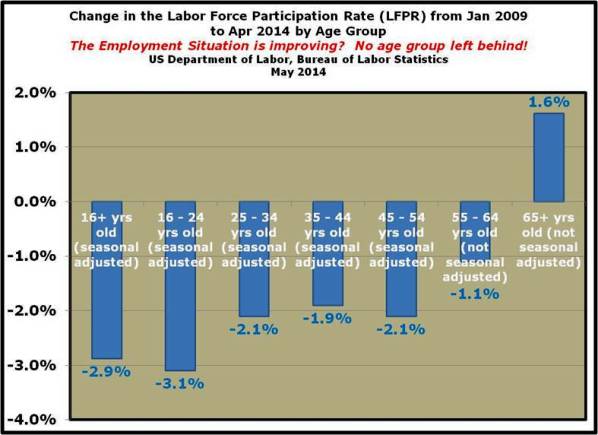
While we’re focusing on the youngest group (16 – 24) and the oldest at 65+, it’s important to understand that ages 16 through 64 experienced a decline in the Labor Force Participation Rate since 2009. This means that we continue to underutilize people who are in their prime earning years. It’s clear that as the Baby-Boomers move into their retirement years, you would expect the earlier age groups to pick up any slack in the labor markets. This is clearly not the case at the moment and it has actually been worsened since 2009. Without wading into the political morass, it’s clear that the disability rolls are elevated today, in much the same way that Austan Goolsbee declared was the case in 2003. It’s also clear that while the older set (65+ years old) are retiring; they are doing so at a slower rate, a much slower rate.
It makes sense on one hand for people to keep working beyond age 65, especially considering increased life spans and the pervasiveness of less physically demanding jobs. Where once a person would die within a relatively short period after they retired, today, it’s increasingly likely that they will outlive their retirement savings. When you couple that with the fact that it has been a tough sledding in the labor markets as well as the financial markets over the past several years, it is no wonder that you see people working well beyond the 65 year mark.
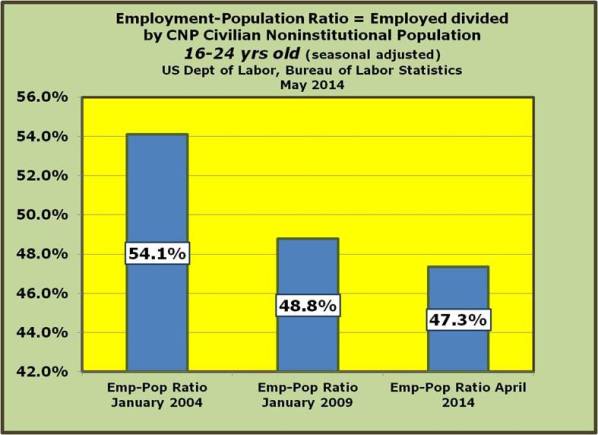
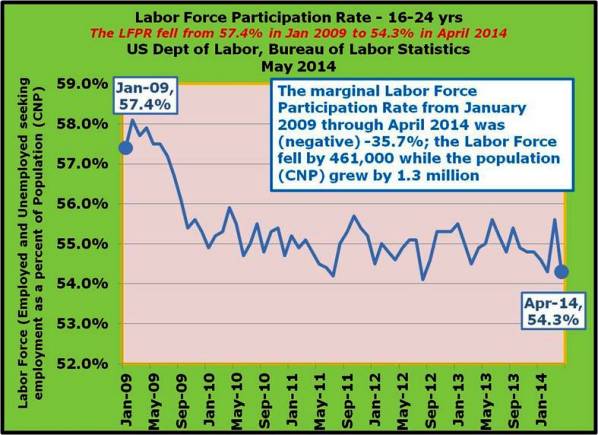
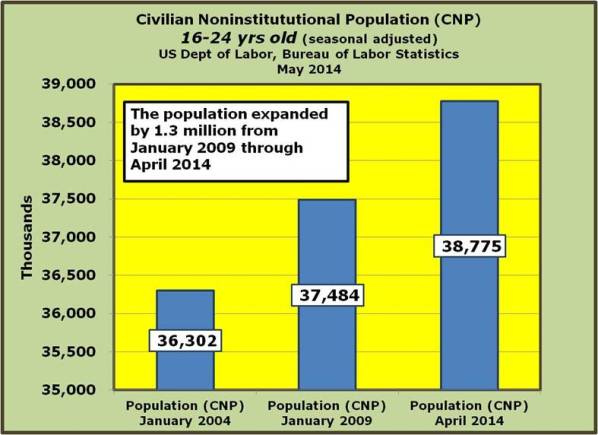
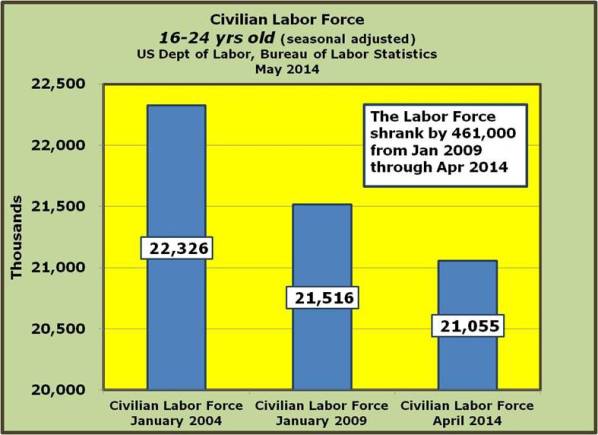
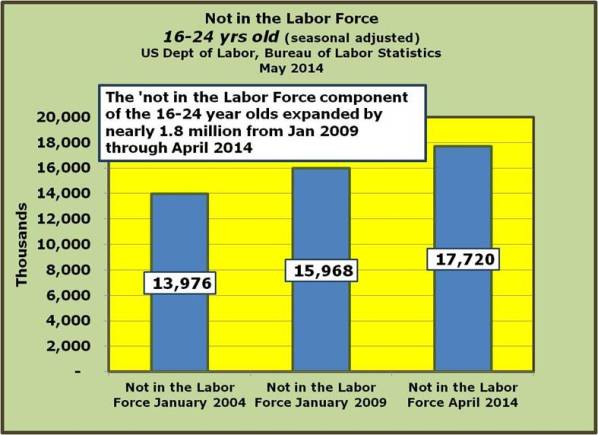
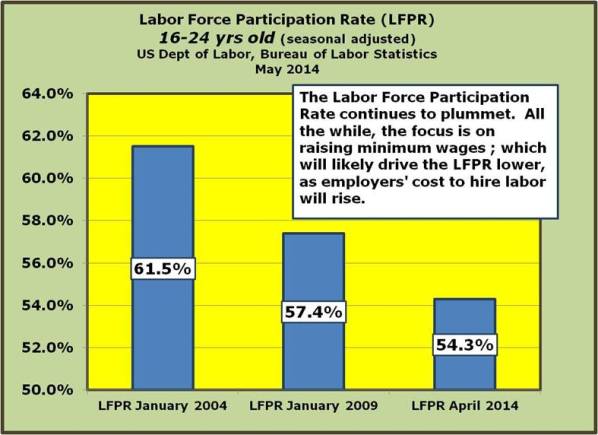
It’s also evident that such things as efforts to raise the minimum wage can be fraught with peril and unintended consequences. Since most of those affected by an increase in the minimum wage are in the ‘under 25 years of age’ category, it makes sense that any reduction in employment related to an inability of employers to maintain their workforce at the higher minimum wage will impact the younger workers more severely. Unfortunately, the 16-24 year old labor force is already stressed in the labor markets. This will only serve to compound the problem as reflected in the falling Labor Force Participation Rate.
Characteristics of Minimum Wage Workers: 2012
www.bls.gov/cps/minwage2012.htm
US Dept of Labor, Bureau of Labor Statistics
“Minimum wage workers tend to be young. Although workers under age 25 represented only about one-fifth of hourly paid workers, they made up about half of those paid the Federal minimum wage or less. Among employed teenagers paid by the hour, about 21 percent earned the minimum wage or less, compared with about 3 percent of workers age 25 and over.”
Another issue that under performing labor markets are bringing to the surface is that if in fact the Baby-boomers are exiting the labor force en masse to enjoy their golden years, you would think that in an even somewhat healthy labor market, there would be increasing levels of employment as the younger workers are back-filling those left by the retirees. The result of course would be higher Labor Force Participation in the younger age groups. This is clearly not happening.
With that in mind, again, keeping away from the political aspects of this, how does this lower Labor Force Participation Rate lend any support to the conventional wisdom that the US needs to swing wide the doors for amnesty? This is not to say that immigration is not an important aspect of our current population – it certainly is.
Employment outlook: 2010–2020
www.bls.gov/opub/mlr/2012/01/art3full.pdf
US Dept of Labor, Bureau of Labor Statistics
February 21, 2012
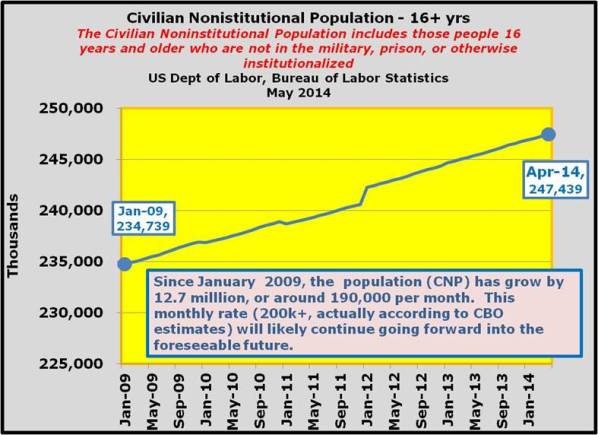
“According to the Census Bureau’s population projections used in the 2010–2020 projections of the labor force, net immigration to the United States is expected to add 1.4 million people annually to the U.S. resident population. This figure is a sharp increase over the roughly 800,000 immigrants per year projected in 2004 by the Census Bureau’s previous long-term projections of the resident population.”
Keep in mind that the overall Civilian Noninstitutional Population is currently growing at around 2.0 to 2.5 million per year. It stands to reason that a large portion of the additions to the working age population are coming from the ranks of the foreign born.
To reiterate the obvious, the labor markets are currently underperforming as has been revealed by the Labor Force Participation Rate and the Employment-Population Ratio. As we’ve noted before, the only solution to this problem is via policies promoting economic growth.
www.bls.gov/news.release/archives/empsit_06062014.pdf
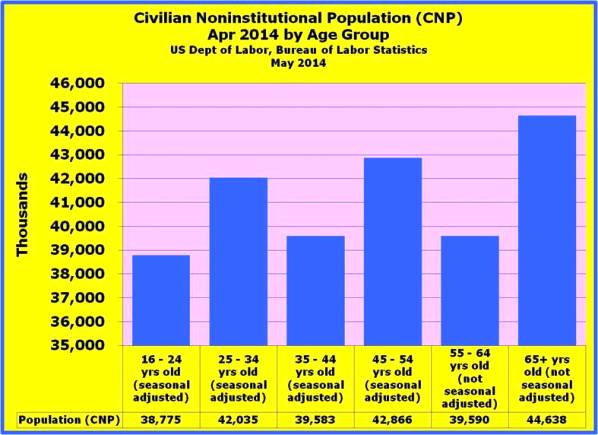
Those 65 and older represent the largest cohort of all the age groups and will maintain that position for some time to come as the Baby Boomers continue to roll past age 65. As we’ve already noted and as can be seen in the following graphs, the employment picture for the various age groups has proven to be disastrous for all age groups aside from the 65+ cohort. Let’s begin by taking a look at the oldest cohort (65+ years of age) and the youngest cohort (16-24 years of age).
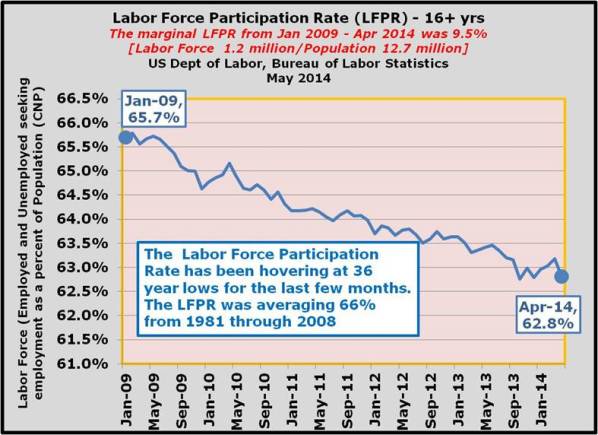
It’s easy to see how many people have arrived at the conclusion that the decline in the Labor Force Participation Rate (LFPR) is primarily an issue associated with an aging population. In fact, there were about 5 million people added to the roles of the ‘not in the labor force’ for this age group. If you simply added 5 million back into the current labor force, this would raise the Labor Force Participation Rate up to 64.8% a full two percentage points higher than where it is currently at (62.8% in April and May 2014). So the question becomes this: since so many people are leaving the labor force in the oldest age group, why haven’t the other cohorts picked up the slack? If the 16 through 64 age groups had merely returned to the January 2009 levels, this would have bumped up the labor force by nearly 4.2 million people and moving the LFPR to the 64.5% level.
In the following graphs we have laid out the employment situation statistics for the 65+ age cohort, followed by the 16 – 24 year old age group.
In this last series of graphs we present employment statistics’ time series for the various age groups from 16 year of age and up (see how your age group has fared):
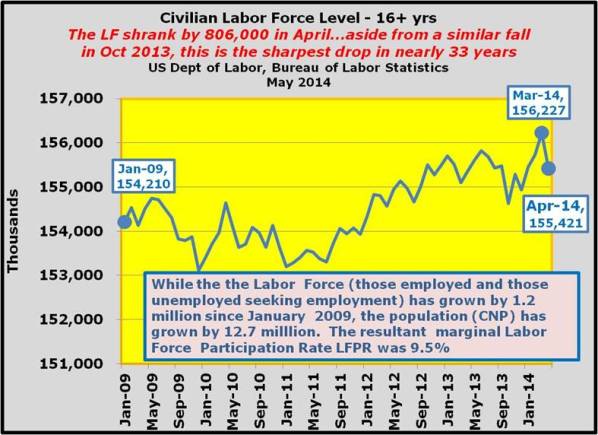
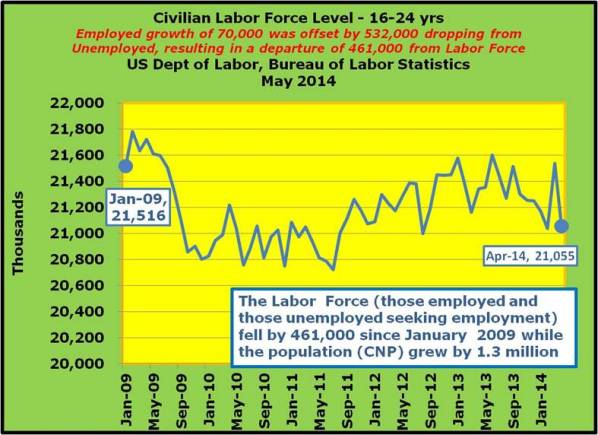
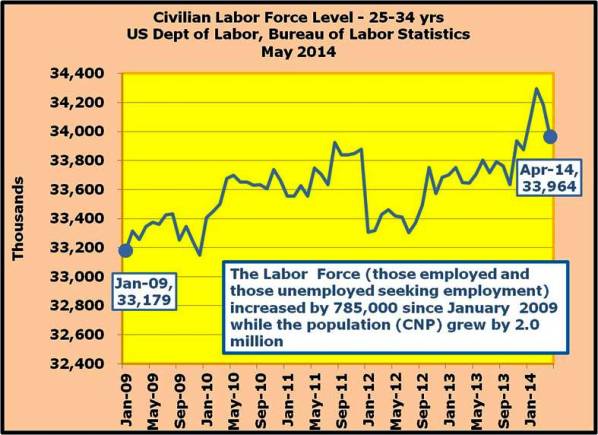
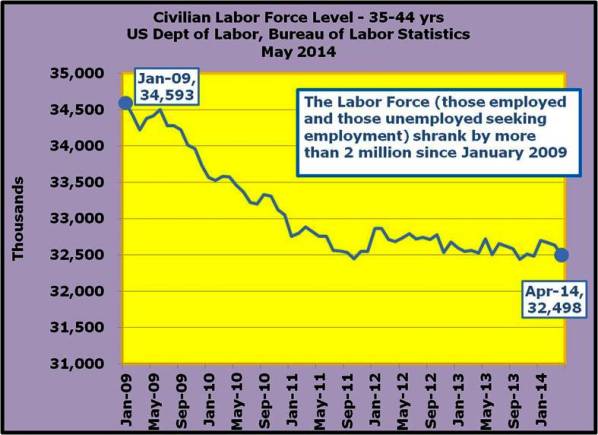
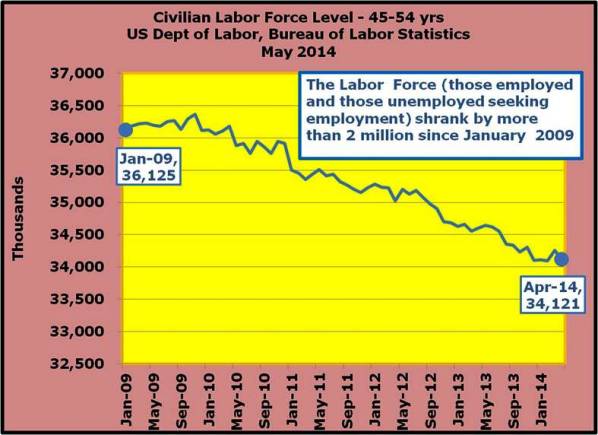
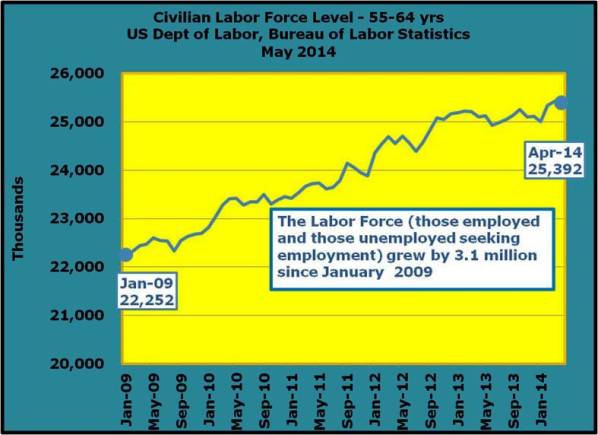
The Civilian Labor Force: Employed plus those Unemployed (actively seeking employment)
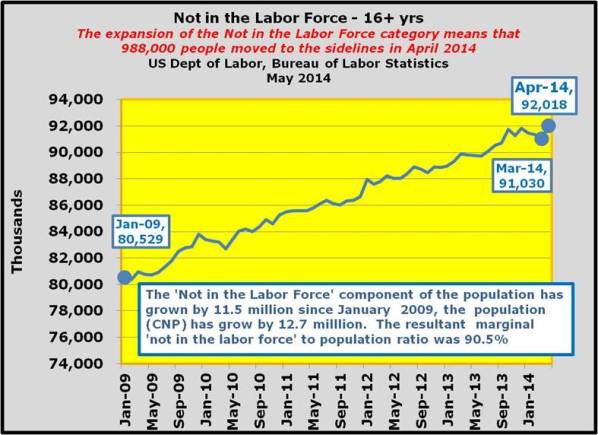
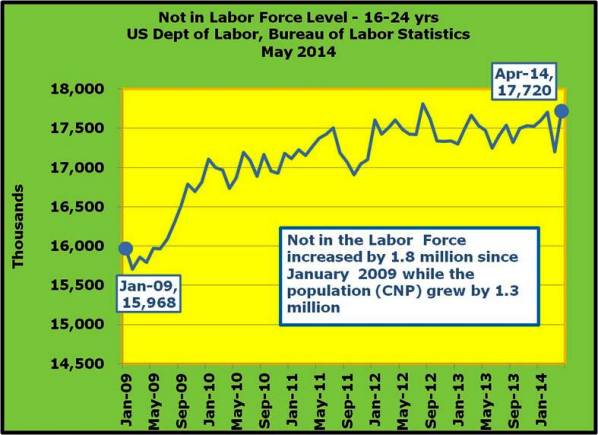
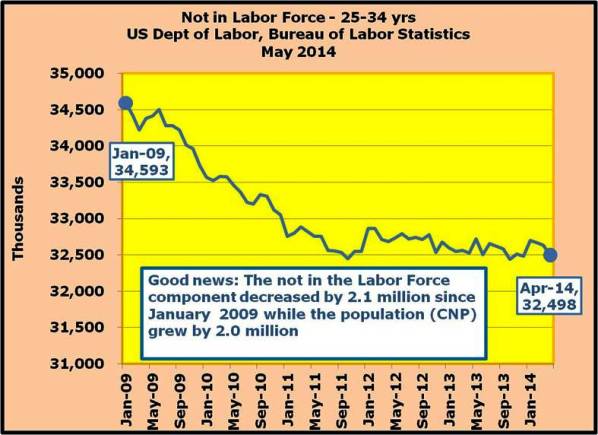
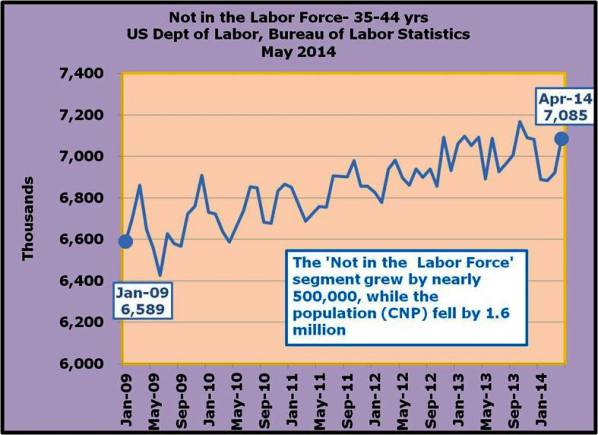
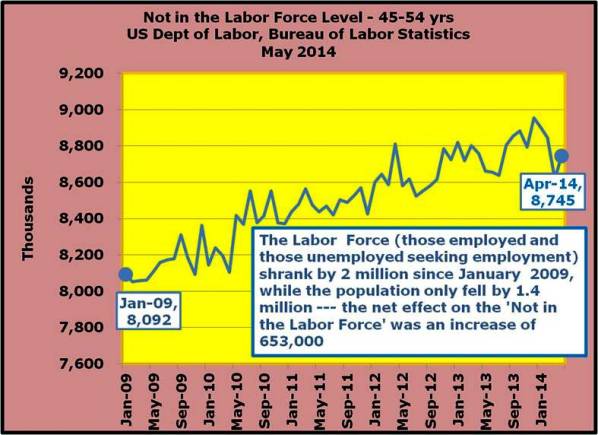
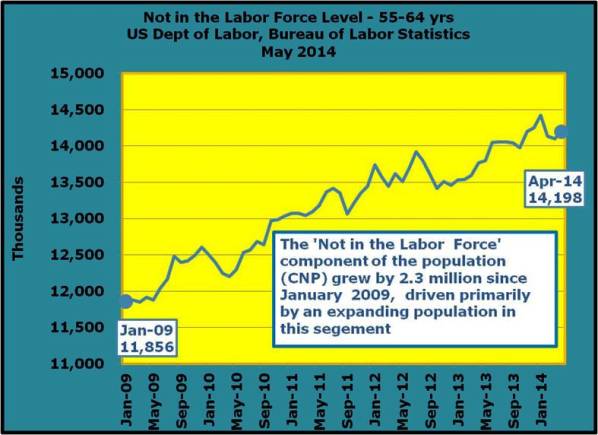
As the phrase implies, the ‘Not in the Labor Force’ measures the difference between the Labor Force and the Civilian Noninstitutional Population. This group includes (among others) retirees and those who have given up seeking employment altogether.
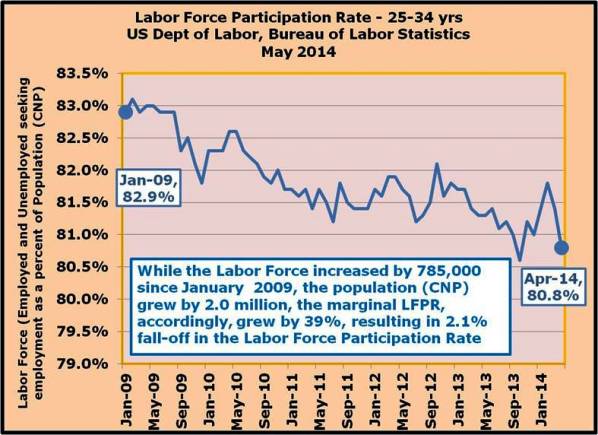
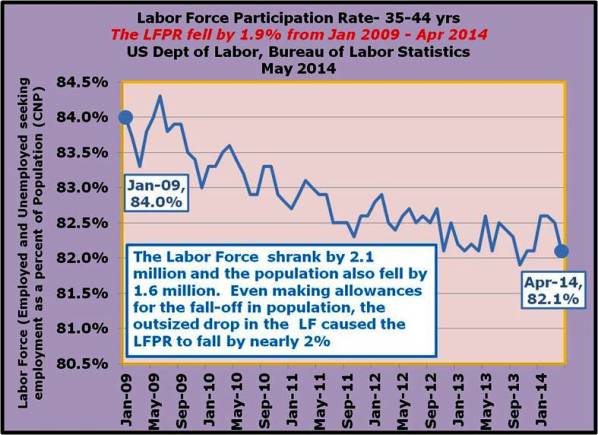
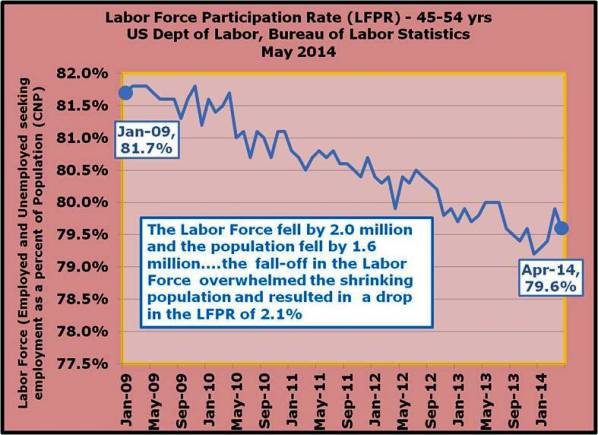
The Labor Force Participation Rate or LFPR is the Labor Force divided by the Civilian Noninstitutional Population.
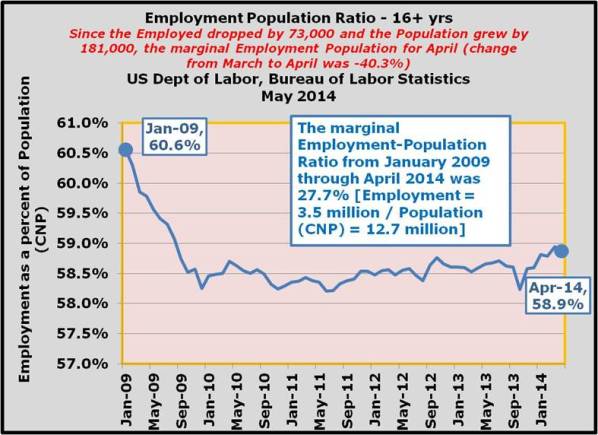
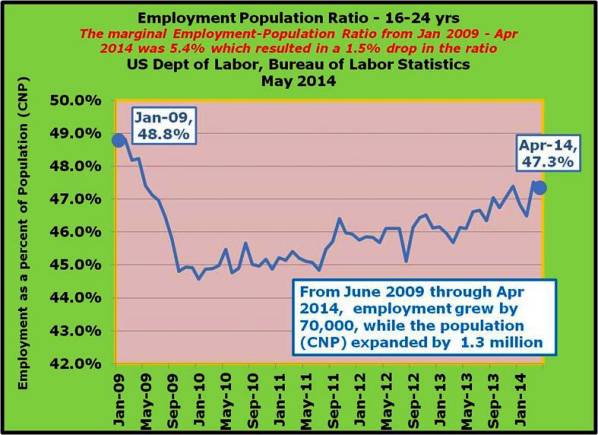
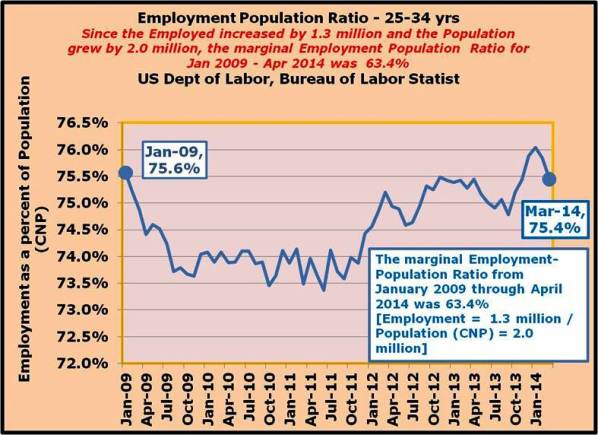
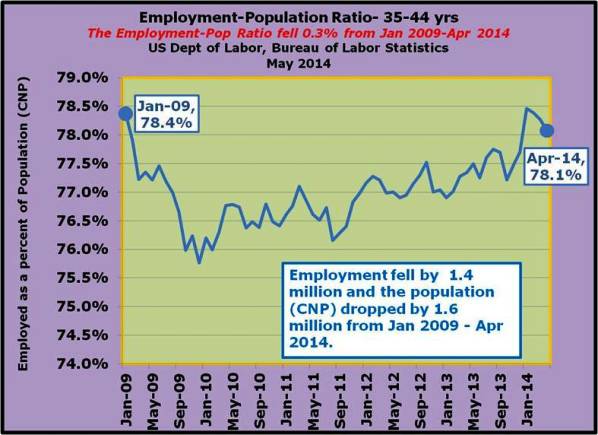
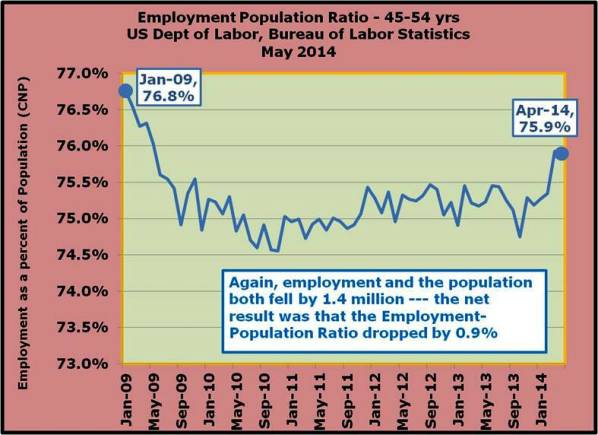
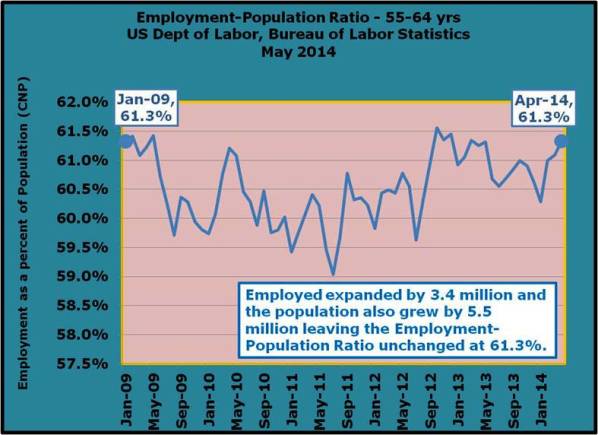
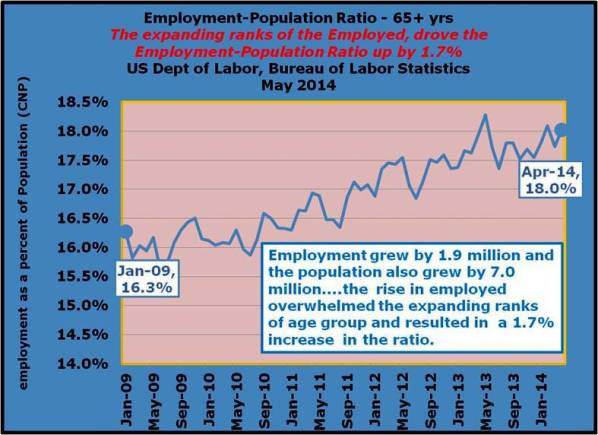
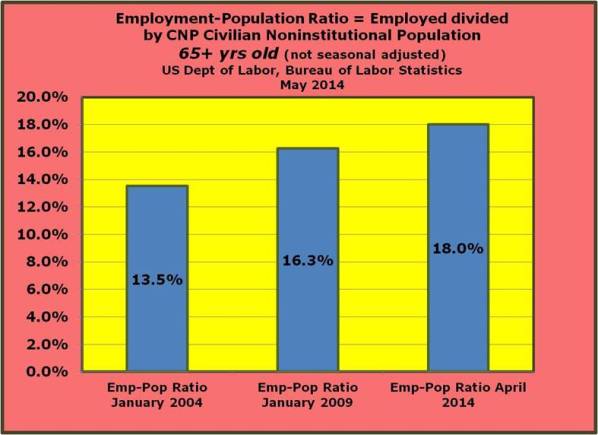
The Employment-Population Ratio is the relationship between those Employed and the Civilian Noninstitutional Population. This ratio is on the radar of Federal Open Market Committee or FOMC in their policy making deliberations about every six weeks as seems to be a significant factor in determining when the FED will decide to act on raising the targeted Federal Funds Rate.
In the months ahead, keep an eye on the employment reports – they are published on the first Friday of the month by the Bureau of Labor Statistics.
May 2014
www.bls.gov/news.release/archives/empsit_06062014.pdf
Current Employment Summary
www.bls.gov/news.release/empsit.nr0.htm