2014 Volume Issue 3
March 24, 2014
For a downloadable version, click the following:
…a bit more compressed version of the PDF
Labor Force Participation Rate: Where We are; Where We’ve been; and Where We’re Heading
February 2014 Employment Situation
www.bls.gov/news.release/archives/empsit_03072014.pdf
In the most recent monthly data published by US Department of Labor, Bureau of Labor Statistics, Payroll Employment (Establishment Survey) rose by 175,000 and 42,000 in the Household Survey. We’ve discussed the differences between the two: the Establishment and the Household Survey, on numerous occasions. The Current Employment Statistics Survey (CES; establishment) gathers its data from firms and government entities, while the Current Population Survey (CPS; household) polls households directly.
Employment Situation Technical Note
www.bls.gov/news.release/empsit.tn.htm
Please read the preceding linked material to learn more details about the two surveys.
Employment from the BLS household and payroll surveys: summary of recent trends (March 7, 2014)
www.bls.gov/web/empsit/ces_cps_trends.pdf
The linked material goes through a more detailed discussion on the two surveys…
While the Establishment Survey is significantly larger in terms of identifying participants at the individual level: 144,000 businesses and government agencies, with 554,000 individual worksites. The firms and government entities report on monthly changes in their respective workforces and provide such things as hours worked, earnings, hires, fires, etc. The Household Survey, conducted by the Census Bureau, contacts 60,000 households directly, querying them on the employment status of individuals in the household. The Unemployment data and Labor Force Statistics are derived from the Household Survey and while the sample size is significantly smaller, this survey captures a wider swath of the population and presents a more complete picture for detailing such things as Labor Force Participation.
The Monthly Employment Situation is typically released on the first Friday of the month and shows detailed data gathered from the previous month(s).
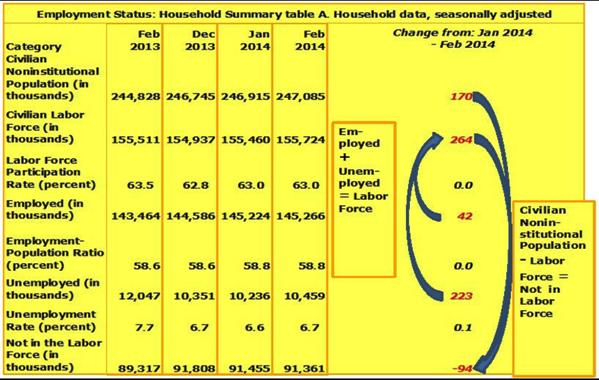
The first table that is typically presented in the monthly report is the Household Data, Summary Table A. (page 4 or thereabouts).
The first category is the Civilian Noninstitutional Population, which measures the 16+ year old who are not institutionalized (prisons, military, etc.). This number (estimate from Census) has averaged around 200,000 growth per month over the last ten years. The 170,000 rate for February 2014 is a bit low, but periodic adjustments (changes population controls) are made on a regular basis.
The second metric is the Civilian Labor Force. Included in the Labor Force are those counted as Employed and those counted as Unemployed (those actively seeking employment). The remaining portion of the Civilian Noninstitutional Population are those ‘not in the Labor Force’ and include those that are retired, given up on finding employment, those on disability, etc. The Labor Force registered a 264,000 gain for the month of February. The 264,000 included an increase in Employed of 42,000 and an increase in Unemployed of 223,000 (combining the two is how we arrive at the Labor Force…note that there was 1,000 difference due to rounding). This increase in the Unemployed is what drove up the U-3 Unemployment Rate from 6.6% in January to 6.7% in February. When we see the unemployed number increase due to the more people seeking employment, we refer to this as the encouraged worker effect – in that people are anticipating more hiring in the near term (We’ve heard some people call it the ‘desperate worker effect’).
In looking at the combined effect of the Labor Force as a percent of the Civilian Noninstitutional Population this is the Labor Force Participation Rate (LFPR). We’ve been looking at the LFPR since May 2010 blogs.udmercy.edu/newparadigm/tag/debt-to-gdp/ , and unfortunately, it has only worsened since that time. The current rate of 63.0% is as low as it has been since 1978 when the labor markets were in bad shape as well; but also keeping in mind they were a bit different, with fewer earners in individual households. If, for example, the Labor Force would continue to add the same monthly number that was added in February, 264,000, for the next four years (48 months), the Labor Force Participation Rate would be in the previously normal – pre Recession level, of 66.0% (66.1% average from 2004 – the end of 2007).
One of the dismissive reasons we’ve repeatedly heard explaining the fall in the Labor Force Participation Rate has to do with growing number of baby-boomers (born 1946 – 1964) charging toward that 65+ age group. The assertion is that the falling Labor Force Participation is owed primarily to the increased retirements. The problem with that reasoning is that the older population cohorts are actually staying in the Labor Force in record numbers – as we pointed out in previous newsletters. The real problem is that we have younger, able-bodied workers, who are simply not able to find employment. I bit later in this article, we will take a look at the breakdown between men and women in terms of what we call the ‘marginal’ Labor Force Participation Rate, where we look at the change in that measurement over a given period of time.
At the southeast corner of Haggerty Road and Eight Mile Road in Livonia, Michigan, there is a standard ‘No Turn on Red’ sign and on that sign is a bumper sticker: “30% of US 20 to 24 year olds are neither employed nor in school.”

The next item, Employed, came in at 42,000 for the month of February. Given the 264,000 per month increase in the Labor Force we used previously (to arrive at the 66% LFPR in 48 months), the Employed number will have to increase at a much, much greater rate than is currently the case. Again, keeping in mind that the Labor Force is equal to the Employed plus the U-3 Unemployed, we have to take into consideration the amount we would like to see the Unemployment Rate at the end of that 4-year window. For the sake of this exercise, we’ll use a 5% targeted U-3 Unemployment Rate. Over the next 48 months, in order to hit the twin targets of 66% LFPR and 5.0% U-3 Unemployment Rate, the increase in Employed would have to be 306,000 per month. Conversely, the Unemployed would also have to drop by 42,000 per month (a 264,000 monthly rise in the Labor Force; in conjunction with a 302,000 monthly increase in Employed, less 42,000 per month drop in the Unemployed).
As we’ve noted on numerous occasions, the Employment-Population Ratio (Employed divided by Civilian Noninstitutional Population) is closely monitored by the Federal Reserve in measuring the health of the labor markets and serves as a bell weather in determining the direction of monetary policy, i.e., a major factor in when the FED will pursue more restrictive monetary policies (reducing/eliminating its currently aggressive bond-buying strategy and maintenance of a virtual 0.0% - 0.25% Federal Funds Target Rate). The current Employment-Population Ratio of 58.8%, would move up to pre-recession level of 62.7% given the previously noted scenario regarding the average Employment growth of 306,000 per month for the next 48 months (a 14.7 million gain in employment).
The Unemployed numbered 10.459 million in February 2014, while the U-3 Unemployment Rate increased to 6.7% due to the aforementioned ‘encouraged worker effect’. Given the 48 month scenario previously noted, where the Unemployment Rate falls to 5.0%, the Unemployed number would have also to drop by 42,000 per month for a total reduction of 2.039 million.
The last item is the ‘Not in the Labor Force’ category. Again, the Civilian Noninstitutional Population is comprised of the Labor Force (Employed + Unemployed seeking employment) and the ‘Not in the Labor Force’ components. Going forward, the ‘Not in the Labor Force’ category will have to drop by 94,000 per month for the next 48 months, going from its current 91.4 million level down to 86.9 million.
We’ve gone through this exercise, focusing on targeted levels for the Labor Force Participation Rate and the U3 Unemployment Rate. At the end of the day, it really comes down to whether or not the labor markets are trending in the right direction. For all of the hopefulness and waiting over the past several years, we are still not moving in the right direction. The February 2014 Employment Report was not ‘terrible’, but we have to begin seeing more rapid and sustained growth in Employment before we can even say we are in a decent recovery.
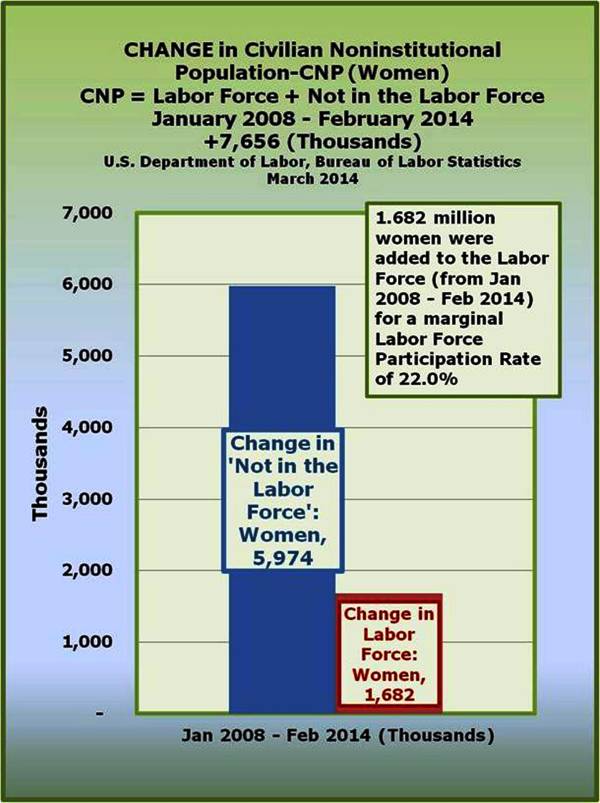
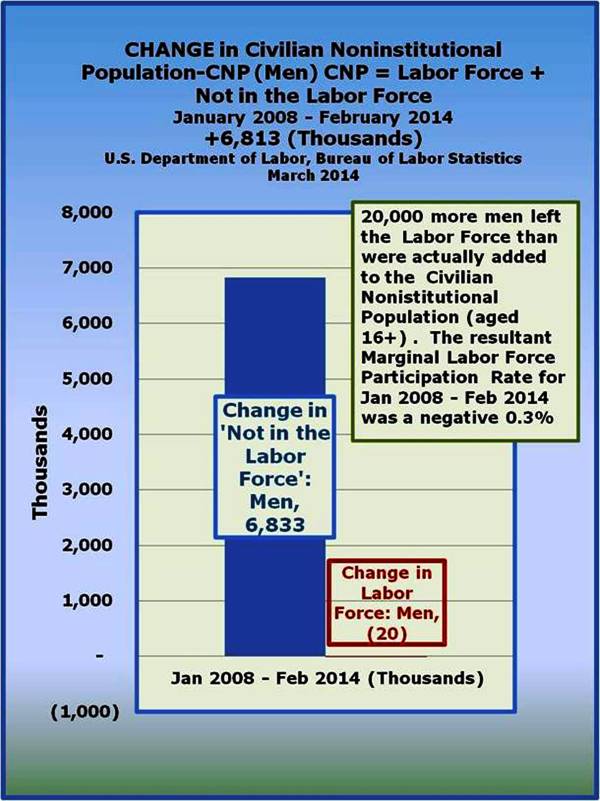
The War on American Labor Force: both men and women
In this section we will take a look at how women and men have fared in terms of Labor Force Participation Rate over the past several years. In particular, we will look at the ‘marginal’ Labor Force Participation Rate focusing on the change from January 2008 through February 2014. Perhaps the most noteworthy observation here is that while the ‘marginal’ Labor Force Participation Rate for women was only 22% (the average Labor Force Participation Rate for the last ten years, March 2004 – February 2014, was 58.7%), the rate for the men was a NEGATIVE 0.3% (the average Labor Force Participation Rate for the last ten years, March 2004 – February 2014, was 71.9%).
The Congressional Budget Office’s Economic Forecast: what it means for the Labor Markets
Baseline Economic Forecast—February 2014 Baseline Projections
February 4, 2014
When the Congressional Budget Office performs its analysis, they are provided with guidelines, defining the scope and parameters of what is being measured. In general, the CBO has a good reputation for providing accurate analysis – but again, they operate with specific instructions.
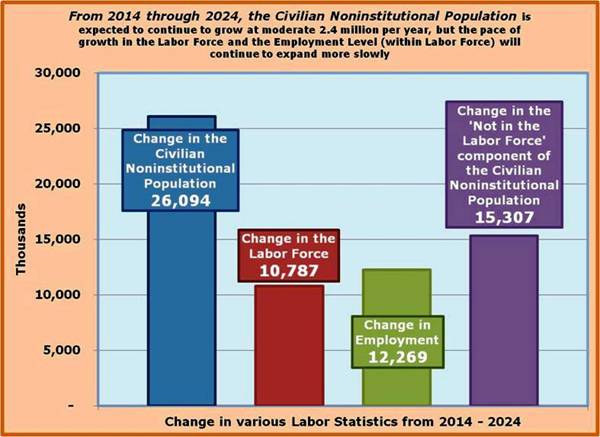
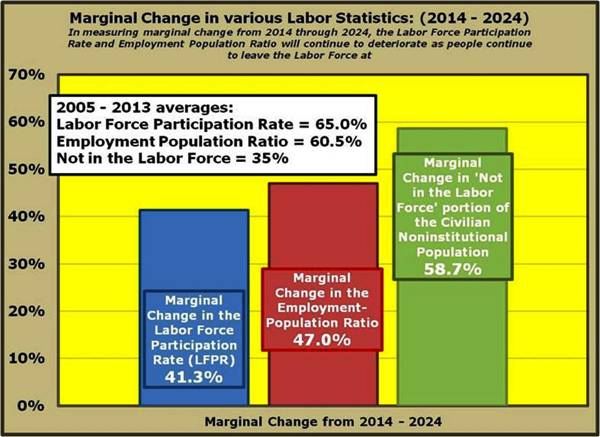
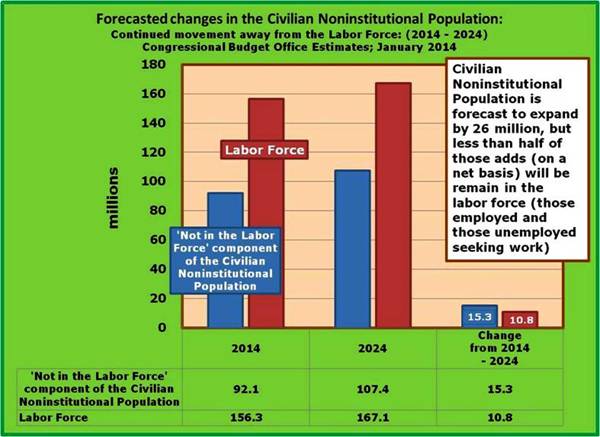
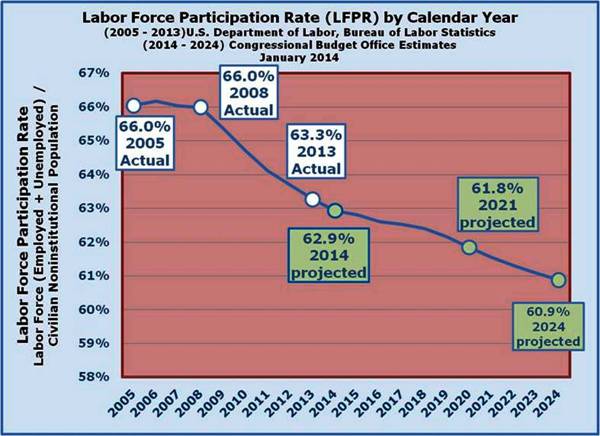
What is both interesting and alarming about this forecast is that the Labor Force Participation Rate is scheduled to continue to deteriorate over the next eleven years. What this means is that Employment growth, in particular will not rise enough to offset those leaving the Labor Force. The final take away from this analysis is that there is no expectation for the U.S. Labor markets to rebound in any meaningful way. Yes, the U-3 Unemployment Rate is expected to fall, but rather than elevating the Employed levels, on a net basis, most seem to be seen moving out of the Labor Force entirely. Likewise, while the Civilian Noninstitutional Population is on track to expand, on a net basis, over half of those adds will not land in the Labor Force. Keep in mind that we’re looking at the net changes in the various categories over the eleven year time frame, from 2014 through 2024.
Simply put, the Labor Force Participation Rate reflects those in the Labor Force (Employed and Unemployed) as a percent of Civilian Noninstitutional Population. The expectation is for Unemployment rate to drop to 5.5%, but the net effect will not translate into a gain for the Labor Force. In order for the Labor Force to move the Labor Force Participation needle higher, the Employed (on a net basis) would have to take on those moving out of the ranks of the Unemployed and grow at a sufficient level to also absorb those new adds to the Civilian Noninstitutional Population.
In short, the Employed would have to take from the Unemployed, the new adds to the Civilian Noninstitutional Population and those ‘Not in the Labor Force’ to really raise the Labor Force Participation Rate. According to the CBO’s estimates, this is simply not going to happen. The monthly Employment numbers are expected to grow at less than 100,000 per month, which is far short of the roughly 200,000 per month required to move the Labor Force Participation Rate to the 66% level with a concurrent 5% Unemployment Rate.
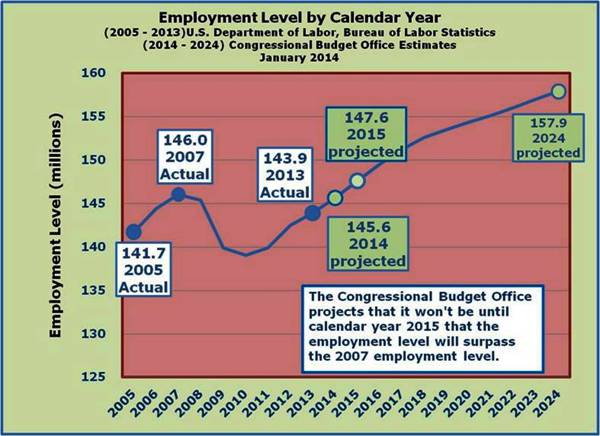
While Employment is expected to rise by 12 million from 2014 through 2024, it would require an additional 14 million to reach the 66% Labor Force Participation Rate level. Unfortunately, the projected 12 million will result in an even lower Labor Force Participation Rate number of 60.9%.
We’ll continue to monitor the Labor Force Participation Rate (LFPR) going forward, but given where we’ve been and are currently, unless there are dramatic pro-growth policy shifts going forward, the CBOs take on the labor markets are likely to be fairly accurate…unfortunately so.