
2014 Volume Issue 5
May 21, 2014
For a downloadable version, click the following:
…a bit more compressed version of the PDF
THE APRIL JOBS REPORT: NEARLY A MILLION MOVE TO THE SIDELINES – Outside of the Labor Force; while Employment expands by 288,000 and the Unemployment drops to the lowest level in five and a half years…WHAT IS WRONG WITH THIS PICTURE?
We keep hearing that the worst is over and a real recovery and meaningful economic growth is now underway, but as my old friend, O Oh Owe, the Sage of Syracuse would often say, BALONEY. It is all smoke and mirrors as the most recent labor report shows. Any apparent improvement is due to masses of able-bodied civilians moving out of the labor force and moving to the sidelines due to the weak labor market. In this and the next few newsletters we will analyze this very disturbing situation facing the American economy.
online.wsj.com/news/articles/SB10001424052702304178104579537464110122066
April Sees 288,000 Jump; Earlier Estimates Raised; Participation Rate, Wages a Worry
By Josh Mitchell
Updated May 2, 2014 7:12 p.m. ET
“U.S. employers in April added jobs at one of the fastest paces of the recovery, rekindling hopes for an upturn strong enough to alleviate the economy's longstanding ills.
employment grew by 288,000 in April and the jobless rate sank to 6.3%, the Labor Department said Friday. The new jobs—spread across an array of industries from retail to construction—put total payrolls closer to the all-time peak, reached near the recession’s start, after a long and grinding recovery.”
This seemingly good news was derived from two employment surveys published by the US Department of Labor’s Bureau of Labor Statistics.
The cited employment growth of 288,000 was based on data from the CES or Current Employment Statistics (also referred to as the Establishment or Payroll Survey). The falling unemployment rate of 6.3% (more specifically, the U3 Unemployment Rate) was derived from data collected in the CPS or Current Population Survey (known also as the Household Survey).
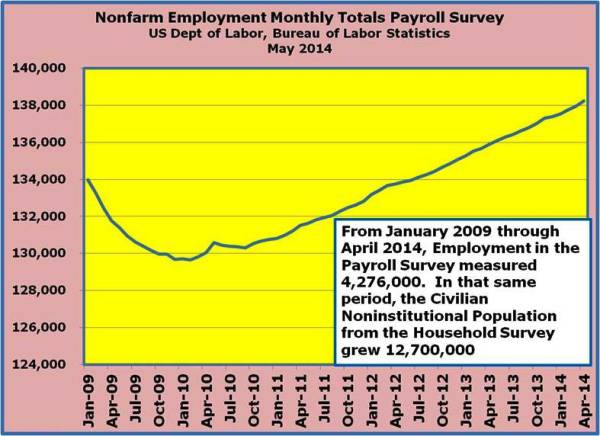
There is no doubt that on the surface the two metrics might appear to signal an all’s-well from the labor markets. First, the Payroll Survey’s Employment growth since the end of 2008 was 3,478,000 total, or 54,344 per month over the previous 64 months. While that might appear respectable, keep in mind that the population (Civilian National Population: 16 years and older not in the military, in prison, or otherwise institutionalized) grew by 12,700,000 or 198,437 per month over the same period.
The ratio between the Employed in the Payroll Survey and the population (CNP) was 4,276,000:12,700,000 for the change (marginal) from January 2009-April 2014, or 33.7%. Measurement of the Employment-Population Ratio falls under the category of the Household Survey where the marginal gains from January 2009 and April 2014 came in at 3,517,000:12,700,000, or 27.7% - a bit lower than the Payroll derived measurement (much less than the average 62.7% Employment Population Ratio from 2004 through 2008).

The following discussion has to do with various data from the Household Survey:
- Population refers to the Civilian Noninstitutional Population (CNP) which includes all people 16 years of age and older who are not in the military, prison, or other institutions.
- The Labor Force is equal to those employed plus those unemployed actively seeking employment.
- The Labor Force Participation Rate or LFPR, is the Labor Force divided by the Civilian Noninstitutional Population.
- Employment measured in this survey differs (as noted previously) from that measured in the Payroll Survey. The Population refers to the Civilian Noninstitutional Population.
- The Employment-Population Ratio is the relationship between those Employed and the Civilian Noninstitutional Population. This ratio is on the radar of Federal Open Market Committee or FOMC in their policy making deliberations about every six weeks as it seems to be a significant factor in determining when the FED will decide to act on raising the targeted Federal Funds Rate.
- As the phrase implies, the ‘Not in the Labor Force’ measures the difference between the Labor Force and the Civilian Noninstitutional Population. This group includes (among others) retirees and those who have given up seeking employment altogether.
First up… Employment-Population Ratio
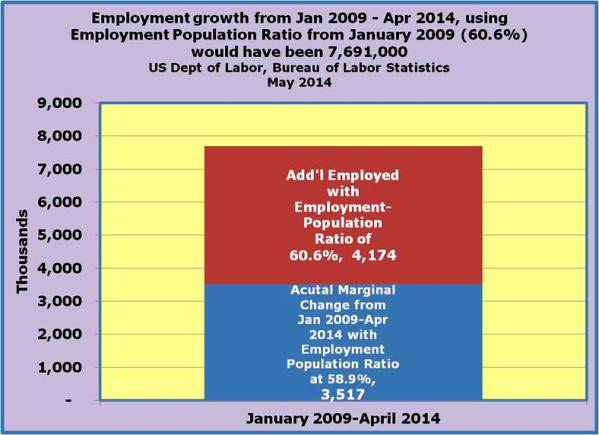
The Employment-Population Ratio in January 2009 was 60.6% and that same ratio was 58.9% in April 2014; it was that falling ratio that brought us the 27.7% marginal ratio. By merely measuring the Employment-Ratio using the 60.6% from January 2009 we can see the following:
- January 2009
- Employed = 142,152,000
- Population = 234,739,000
- Employment Population Ratio = 60.6% (keeping in mind that the ratio averaged 62.7% over the previous 5 years)
- April 2014
- Employed = 145,669,000
- Population = 247,439,000
- Employment Population Ratio = 58.9%
By simply using the Employment-Population Ratio from January 2009 for April 2014 the employment shortfall can be measured.
- April 2014
- Employed = 149,843,000
- Population = 247,439,000
- Employment Population Ratio from January 2009 = 60.6%
The Employment shortfall from January 2009 – April 2014 was:
149,843,000 (adjusted for 60.6% Employment-Population Ratio) less the actual 145,669,000 (actual Employment-Population Ratio of 58.9%), or 4,174,000
In summary, if the Employment-Population Ratio had registered 60.6% in April 2014, the marginal change in ‘Employment’ from January 2009 – April 2014 would have been 4,174,000 higher than the actual 3,517,000, or 7,691,000 total.
Next…The Labor Force Participation Rate
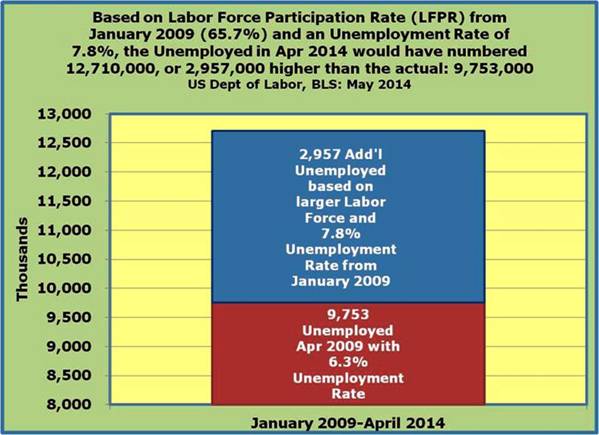
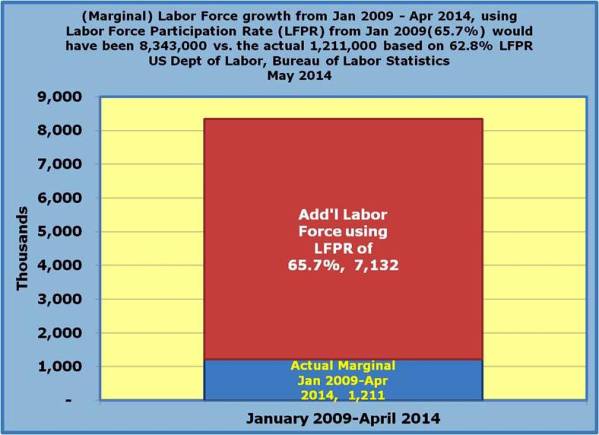
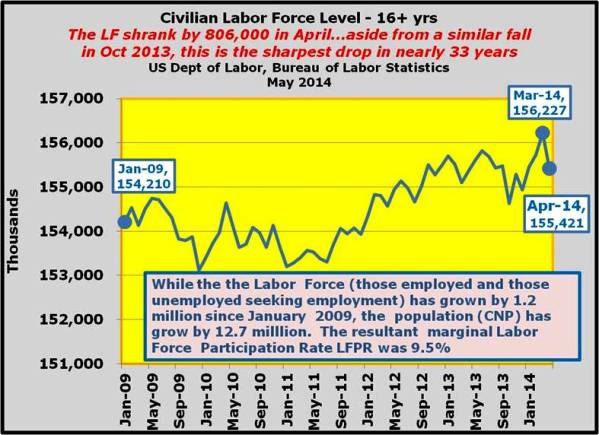
The Labor Force Participation Rate (LFPR) [Labor Force (Employed + Unemployed actively seeking employment) / Population] in January 2009 was 65.7% and that same ratio was 62.8% in April 2014; again, it was that falling ratio that brought us the 9.5% marginal ratio. By merely measuring the Labor Force Participation Rate (LFPR) using the 65.7% from January 2009 we can see the following:
January 2009
- Employed = 142,152,000 + Unemployed = 12,058,000
- Labor Force = 154,210,000
- Population = 234,739,000
Labor Force Participation Rate (LFPR) = 65.7% (keeping in mind that the ratio averaged 66% over the previous 5 years)
- April 2014 Employed = 145,669,000 + Unemployed = 9,753,000
- Labor Force = 155,421,000
- Population = 247,439,000
Labor Force Participation Rate (LFPR) = 62.8%
By simply using the Labor Force Participation Rate (LFPR) of 65.7% and Unemployment Rate of 7.8% from January 2009…
April 2014 Employed = 149,843,000 + Unemployed = 12,710,000 (based on an Unemployment Rate of 7.8% from Apr 2014)
- Labor Force = 162,553,000
- Population = 247,439,000
Labor Force Participation Rate (LFPR) = 65.7%
The Labor Force shortfall from January 2009 – April 2014 was:
162,553,000 (adjusted for 65.7% Labor Force Participation Rate) less the actual 155,421,000 (actual Labor Force Participation Rate of 62.8%), or 7,132,000
In summary, if the Labor Force Participation Rate had registered 65.7% in April 2014, the marginal change in the ‘Labor Force’ from January 2009 – April 2014 would have been 7,132,000 higher than the actual 1,211,000, or 8,343,000 total.
Drilling down on the month of April 2014 — Payroll Survey
So now we’re back to the month of April 2014. We’ve seen that the Payroll Survey Employment for the month was a very respectable 288,000. If we look at the Household Survey Employment figure the Bureau of Labor Statistics reported that Employed actually fell by 73,000. How can this be?
We’ve discussed the differences in the Current Employment Statistics (CES) or Payroll Survey and the Current Population Survey (CPS) or Household Survey on numerous occasions, but suffice to say that the while the sample size for the Payroll Survey is much larger, the population or size of the Household Survey includes those covered by the Payroll Survey plus some self-employed persons, small business employees, farm workers, etc. The population covered by the Household Survey was 5.1% more than the Payroll Survey in April 2014, but it had averaged 5.8% from January 2009 through April 2014. This shrinking gap between employment in the Household Survey and the Payroll Survey might help explain a trend toward more jobs moving to the Payroll Survey portion of the overall employment pie.
For further explanation on the differences between the two surveys, please take a look at the following link from the Bureau of Labor Statistics:
www.bls.gov/news.release/archives/empsit_05022014.pdf
“Coverage. The household survey definition of employment comprises wage and salary workers (including domestics and other private household workers), self-employed persons, and unpaid workers who worked 15 hours or more during the reference week in family-operated enterprises. Employment in both agricultural and nonagricultural industries is included. The establishment survey covers only wage and salary employees on the payrolls of nonfarm establishments.”
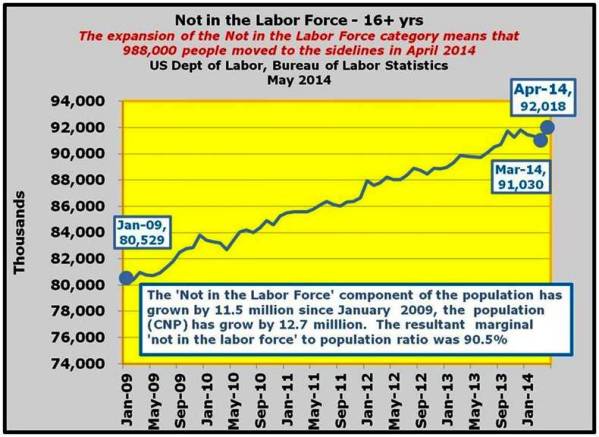
Next, we will move on to the issue of the unemployed and the Household Survey for the month of April. In the monthly Household Employment Picture, we see that the U-3 Unemployment Rate dropped from 6.7% to 6.3%. In scratching beneath the surface, we have to look at how the unemployment rate is derived. When we look at Labor Force, we find it is composed of the EMPLOYED and the UNEMPLOYED (those not employed who are actively seeking employment). The AHA! moment comes when we see that the Labor Force dropped by an amazing 806,000, a change we have not seen, aside from last October, in more than 30 years.
Every month in the Employment Situation Report, issued by the US Department of Labor, Bureau of Labor Statistics, you’ll find the ‘Household Data’ Summary Table A around the fourth or fifth page of the publication.
THE EMPLOYMENT SITUATION — APRIL 2014
www.bls.gov/lau/lauhvse.htm#hvse
This summary page points to a variety of data, including the monthly changes in various categories from the Household Survey. As was noted earlier, the U-3 Unemployment Rate fell from 6.7% in March, to 6.3 % in April. In the media, that number was pretty much heralded as good news. The problem with that was that the unemployment rate fell because the Labor Force contracted so much, that is to say that while Unemployment fell by 733,000, Employment (remember, this is the Household Survey) also dropped by 73,000. Keep in mind that the U-3 Unemployment Rate is equal to Unemployed divided by the Labor Force (the Labor Force is equal to the employed plus those not employed but actively seeking employment). Since both the Unemployed and the Employed fell, then those people left the Labor Force entirely on a net basis. Typically, when we see unemployment falling during a recovery, what we would experience in the Labor Force is shift to the employed.
Two phenomena to keep in mind…‘Not in the Labor Force’
- Discouraged Worker Effect: when we see the Unemployment Rate fall as a result of those in the Labor Force who have given up on finding employment and stopped looking.
- Encouraged Worker Effect: when we see the Unemployment Rate rise as a result of those re-entering the Labor Force, encouraged by the prospect of an increasing demand for labor.
It’s clear that we are seeing what appears to be the ‘discouraged worker effect’ phenomenon continuing to maintain its grip. The hard thing to swallow is that we have been celebrating an ongoing trend where we’ve witnessed a falling unemployment rate coupled with an anemic labor force…meaning that those formerly unemployed are giving up and moving out the labor force entirely.
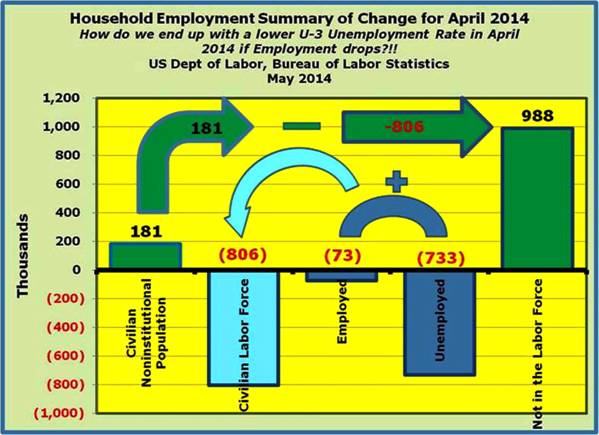
On a further note, since the population (Civilian Noninstitutional Population – 16 years and older not in the military, in prison, or otherwise institutionalized) expanded by 181,000, and the Labor Force did not absorb them (this is on a net basis) so as a result, the ‘not in the Labor Force’ component of that population expanded by 988,000. The ‘not in the Labor Force’ has been growing at a very rapid rate for some time. We’ve focused for the last several years on the fall-off in the Labor Force Participation Rate (LFPR) which went from 65.7% in January 2009 to 62,8% in April 2014 (note: LFPR went from 63.2% in March 2014 to 62.8% in April 2014). The marginal change from January 2009 through April 2014 was an LFPR 9.5%…for every 100 16+ year olds (Civilian Noninstitutional) added to the population, only 9.5 were added to the labor force (Employed and Unemployed).
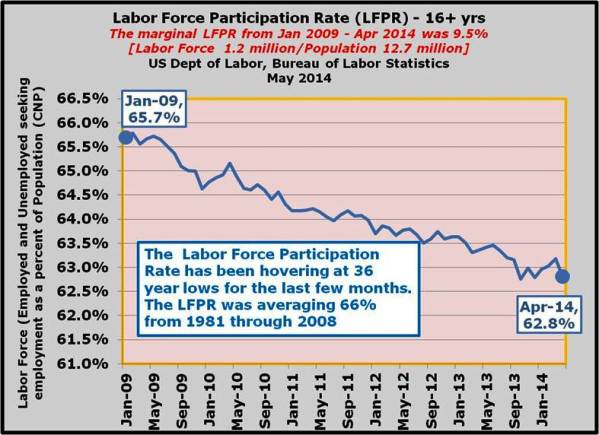
While not published by the Bureau of Labor Statistics, the ‘not in the Labor Force’ Population Ratio, or the flip side of the LFPR has been growing, again, at a very rapid rate. From January 2009 through April 2014 the population expanded by 12.7 million. The two main sub groups comprising the population (Civilian Noninstitutional Population, or CNP) are the Labor Force (those employed and those unemployed actively seeking employment) and the ‘not in the Labor Force’ component, which include retirees and those who have given up on finding employment. The marginal Labor Force Participation Rate LFPR for January 2009 through April 2014 was 9.5% (1.2 million divided by 12.7 million), while the ‘not in the Labor Force’ Population Ratio was 90.5% (11.5 million divided by 12.7 million) over that same period.
While some in the media seems to either ignore the problems associated with the expanding ‘not in the Labor Force’ segment or shrinking Labor Force Participation Rate, attributing it to retirements in the baby boom population cohort (those born from 1946 through 1964), the reality is that it goes well beyond that: younger workers, in the prime of their earning years have been unemployed or have simply given up on ever finding employment and older workers are remaining in the workforce in droves – simply unable or unwilling to retire at ages that were previously the norm for prior generations.
In an upcoming issue, we’ll dig into the detail behind those various population age groups. This should shed some light on the labor markets across those age groups.
