
For a downloadable version, click the following:
…a bit more compressed version of the PDF
December 15, 2015
Has Yellen “fell in” with the misguided wishful thinkers?
To raise the effective Fed Funds, or not raise the effective Fed Funds Rate, that is the question…
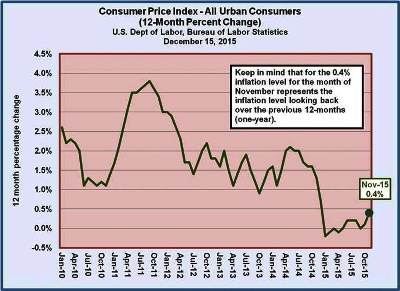
Apparently the Chair of the Federal Reserve Board of Governors (FED) has joined the group of wishful thinkers who are of the mindset that the U.S. economy has reached a healthy enough rate of growth and we apparently are facing an unacceptably high rate of inflation that is just around the corner.
Letter from FED Chairwoman Yellen to Ralph Nader…
November 23, 2015
www.marketnews.com/content/yellen-letter-ralph-nader-text
We all hope and expect that the economy will continue to expand, that the jobs market will continue to make progress, and that inflation will move toward our 2 percent price stability objective," Yellen wrote. "If that is the case, my colleagues and I have indicated it will be appropriate to begin to normalize interest rates.
Fed Officials Worry Interest Rates Will Go Up, Only to Come Back Down
More than half of economists polled predict federal-funds rate back near zero within next five years
Wall Street Journal
By Jon Hilsenrath
Updated Dec. 13, 2015 7:16 p.m. ET
www.wsj.com/articles/fed-officials-worry-interest-rates-will-go-up-only-to-come-back-down-1450034022
Our reply is that of an old Wendy’s commercial, "where is the beef?” Where's the healthy economic growth? Where's the healthy labor markets? Where's the inflationary pressure?
Wishful thinking (W.T.) ranks right up there at the top as one of the key factors that is preventing a respectable rate of economic growth and the elimination of an evolving feeling of insecurity in the U.S. and around the world. W.T. is not alone in causing the current malaise in the U.S. and a large part of the rest of the world. These facets of insecurity give rise to economic and financial uncertainty and are imbedded in a large risk premium that weakens aggregate demand. The so called Affordable Care Act (ACA) https://en.wikipedia.org/wiki/Patient_Protection_and_Affordable_Care_Act and presidential edicts that have more constitutional legitimacy in the eyes of the current U.S. Supreme Court than does Congress are major contributors to this growing uncertainty.
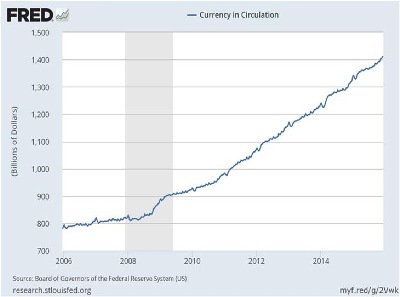
We have been told by the head of our central bank that things are falling into place and will soon require the FED to put upward presure on ntrest rates. Unlike the ‘conundrum days’ of Alan Greenspan, the massive growth of the FED’s portfolio throughout the entire maturity specrum assures that FED can successfully influence the shape of the entire yield curve and not just the short-term end of it.
www.econnewsletter.com/oct062011.html
October 6, 2011
Greenspan’s frustration with what he termed a conundrum, was due to the mistaken belief of the FED that by driving down short term interest rates, the longer term interest rates would also, like Humpty Dumpty, come falling down. Alas, they did not do so.
June 1, 2005 – Baltimore Sun – Jay Hancock
In February [2005], he called low long-term interest rates (another way of saying high bond prices) a "conundrum" that was hard to explain in the face of the Fed's repeated increases in short-term rates.
- Concerns about rising asset values (wealth effect)
- Concerns about inflation (cost push – coming from recartelized oil!)
- The Conundrum – rising Fed Funds (and hence, short term Treasury rates) but long-term rates not following
Alan Greenspan Testimony before Senate Banking Committee
February 16, 2005
www.federalreserve.gov/boarddocs/hh/2005/february/testimony.htm
- Among the factors contributing to the strength of spending and the decline in saving have been developments in housing markets and home finance that have spurred rising household wealth and allowed greater access to that wealth. The rapid rise in home prices over the past several years has provided households with considerable capital gains.”
- Still, although the aggregate effect may be modest, we must recognize that some sectors of the economy and regions of the country have been hit hard by the increase in energy costs, especially over the past year.”
- For the moment, the broadly unanticipated behavior of world bond markets remains a conundrum. Bond price movements may be a short-term aberration, but it will be some time before we are able to better judge the forces underlying recent experience.”
www.econnewsletter.com/aug262005.html
Remarks by Chairman Alan Greenspan
Reflections on central banking
At a symposium sponsored by the Federal Reserve Bank of Kansas City, Jackson Hole, Wyoming
August 26, 2005
www.federalreserve.gov/Boarddocs/Speeches/2005/20050826/default.htm
In Greenspan’s own words,
Our forecasts and hence policy are becoming increasingly driven by asset price changes. The steep rise in the ratio of household net worth to disposable income in the mid-1990s, after a half-century of stability, is a case in point. Although the ratio fell with the collapse of equity prices in 2000, it has rebounded noticeably over the past couple of years, reflecting the rise in the prices of equities and houses.
It is a fine line between the FED’s intervention and attempt to alter the behavior of the economy and intervention to bail out an industry such as residential real estate or a single firm within an industry such as we have seen when the FED bails out a so-called hedge fund, which are often speculative funds in disguise. That fine line becomes so when a sensitive micrometer is needed to tell them apart.
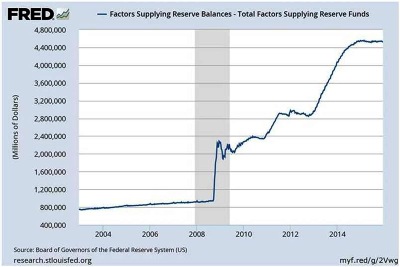
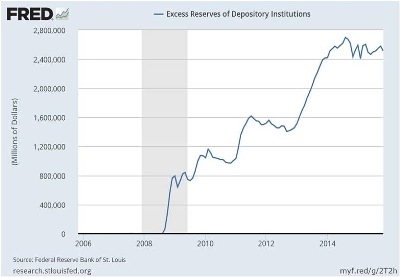
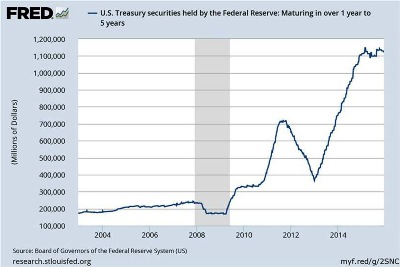
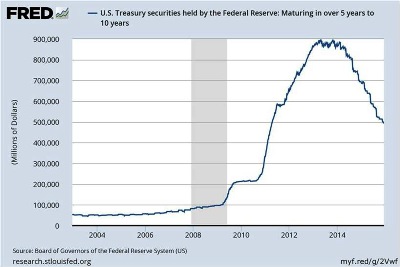
Let’s examine the FED’s portfolio over the time period from just prior to the financial crisis of 2008 to the present time. Several changes have occurred. These changes were initially due to the attempt to stem the crisis that started in the mortgage back securities market and defaults occurred ‘en masse’ in the underlying residential mortgage market.
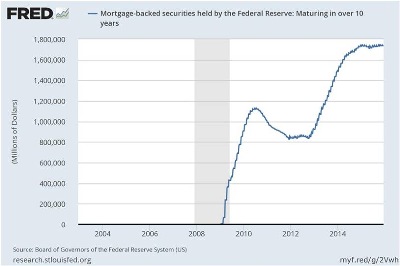
Note the massive entry into the FED’s buying of mortgage backed securities by comparing the pre-crisis portfolio of the FED with their current one. Recall that when this massive expansion of the FED’s portfolio was started to ‘bail out’ the markets involved with financing residential real estate. As the crisis lengthened and expanded to a recession-like economy, the broader concern of the FED was the overall economy. Huge amounts of Treasury marketable securities of all maturities were added to the FED’s portfolio.
Over the years since WWII, the FED switched significantly to using open market operations (effective Federal Funds rates targeted by the Federal Open Market Committee --- the FOMC) and away from changes in legal reserve ratios and the discount rate. The crisis of 2008 and its continuance led the FED to use changes in the discount rate for a while.
Pressure has been growing for the FED to begin to change to a more restrictive policy by putting upward pressure on interest rates. Given the status of the world economy and so many negative signs in the U.S. such as the very low Labor Force Participation Rate (LFPR) and the average anemic growth rate of GDP and its recent quarterly performance, why this change now? If inflation is being measured correctly and we have been assured that it is not a clear and present danger, what is the motive for those within the FOMC to begin a policy of restraint?
What about that GDP growth…make that the GDP Gap?
Okun’s Law
Okun’s Law https://en.wikipedia.org/wiki/Okun%27s_law
GDP Gap = Actual GDP – potential GDP
Rule of thumb…for every 1% the unemployment rate is higher than natural rate, GDP (economic output) gap is 2% lower than where it would otherwise be.
Example:
- 2009 U3 Unemployment = 9.3%, which was 4.3% higher than full employment unemployment (5%, approximately)
- 4.3% X 2 = 8.6% (GDP Gap…GDP lower than where it should otherwise be)
- Real GDP in 2009 = $13,894 billion
- Real GDP Gap = 13,894 billion X 8.6% = $1,195 billion
- Modified Okun's Law…66% Labor Force Participation Rate
- November 2015 – Current Population Survey (Household Summary)
www.bls.gov/news.release/archives/empsit_12042015.pdf
- Civilian Nonininstitutional Population (CNP) = 251,747,000
- Civilian Labor Force (employed + unemployed) = 157,301,000
- Labor Force Participation Rate = Labor Force / CNP = 62.5%
- Employed = 149,364,000
- Employment-Population Ratio = Employed / CNP = 59.3%
- Unemployed = 7,937,000
- U3 Unemployment Rate = Unemployed / Labor Force = 5.0%
- Not in the Labor Force = CNP – Labor Force = 94,446,000
- Modified for a 66% Labor Force Participation Rate LFPR (66.2% average from 2001-2008)
- Civilian Nonininstitutional Population (CNP) = 251,747,000
- Civilian Labor Force (employed + unemployed) = 157,301,000
- At 66%…
- 251,747,000 CNP X 66% LFPR = 166,153,000 Labor Force
- Employment is 149,364,000
- Unemployed = Labor Force [at 66% LFPR] 166,153,000 – Employed 149,364,000
- Unemployed [at 66% LFPR] = 16,789,000
- Unemployment Rate [at 66% LFPR] = 10.1%
- Full Employment = approximately 5%
- Modified Unemployment Rate = approximately 10%
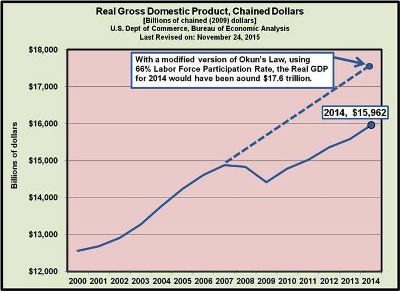
- Real GDP in 2014 was $15,962 billion
- ’s Law GDP Gap (2 X 5% = 10%)
- GDP Gap = $1,596 billion
- This is just a rough estimate based on an unemployment rate modified to fit a 66% LFPR
- The GDP Gap of $1,596 billion
If it is not the overall economic behavior in our economy then what is the motivation? Surely it is not to improve profit margins of financial institutions since several times in the past, a policy of restraint has raised the lending rates faster and farther than the rates paid savers, especially the depositors at depository institutions such as commercial banks.
The FED began its FOMC meeting yesterday. What will be the outcome as much is at stake?
One last thing to note: the FED has embarked on tightening in the past that was perhaps ill-advised. An occasion that comes to mind, aside from its recent activities, was at the onset of the Great Depression. Keep in mind that the ‘first’ recession in the Great Depression, went from August 1929 through March 1933.
Throughout 1930, officials at the New York Fed repeatedly proposed that the System buy government securities on the open market, but they were systematically rebuffed. The reasons other members of the Federal Reserve gave for opposing monetary expansion are instructive. Several felt that much of the investment undertaken in the previous expansion was fundamentally unsound and that the economy could not recover until it was scrapped. Others felt that a monetary expansion would only ignite another round of speculative activity, perhaps even in the stock market. In any event, monetary policy remained contractionary; the monetary aggregates fell by 2% to 4%, and long- term real interest rates increased.
By maintaining a contractionary stance throughout 1930, after a recession had already begun, the FED contributed to a further decline in economic activity and share prices. By the end of the year, the price-dividend ratio had fallen to 16.6, or roughly 34% below the long-run average.
