2015 Volume Issue 8
July 10, 2015
For a downloadable version, click the following:
…a bit more compressed version of the PDF
The Labor Markets 2007 – 2014: How the Age Groups have made out
The downturn and the subsequent weak recovery has (if you can call it that) left many behind
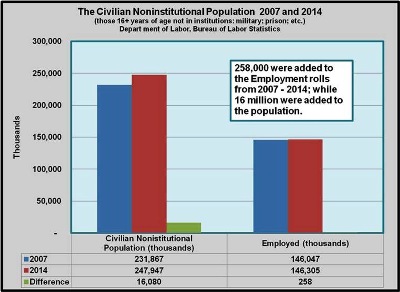
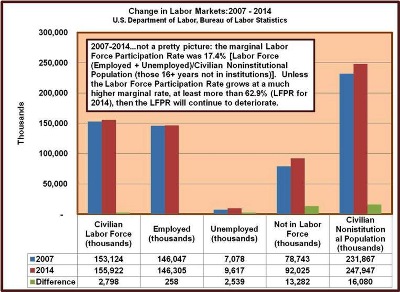
As we noted in previous newsletters, employment only grew by 258,000 from 2007 through 2014, while the Civilian Noninstitutional Population expanded by 16.1 million.
Measuring Economic Growth from 2007 – 2014: Jobs; Inflation; and Gross Domestic Product… first up --- JOBS!
There are a multitude of questions surrounding the state of the economy since 2008 including what could be best described as a mild recovery; but we’ll stick with three economic metrics and then wade in a bit deeper on age groups. For this newsletter article we will focus on jobs (employment/unemployment) and we’ll address inflation and economic growth a bit later.
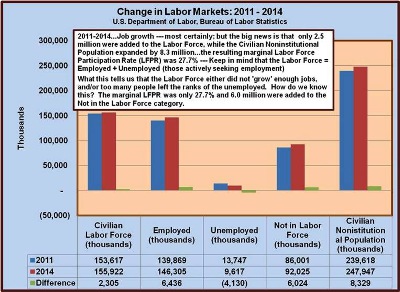
As we noted on the jobs front, the recovery has been anemic with 258,000 added from 2007 through 2014. The media often points to 6.4 million jobs added from 2011 through 2014, and the drop in the U-3 Unemployment Rate from 8.9% to 6.2% in that same time frame. While these are good indicators, they miss the mark in terms of the bigger picture (i.e., the 7.0 million drop in employment from 2007 – 2010 and the 13.3 million people who left the Labor Force in that time). In particular, the period we will focus on is from 2007 and 2014 and the meager 258,000 jobs added to the employment rolls. We will focus on how the various age groups were affected in that time frame.
As an illustration, consider this:
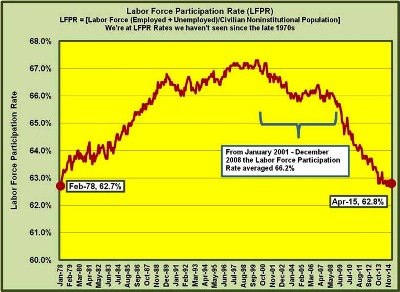
In 2007, the Labor Force Participation Rate (LFPR) was 66%
- Labor Force (LF) = 153,124,000 [Employed 146,047,000 + Unemployed 7,078,000)
- Civilian Noninstitutional Population (CNP) = 231,867,000
- LFPR = LF 153,124,000 / CNP 231,867,000
- LFPR = 66.0%
- U3 Unemployment Rate = Unemployed (those not employed, seeking employment) / Labor Force
- In 2007, the U3 Unemployment Rate was 4.6%
- U3 Unemployment Rate = Unemployed 7,078,000 / Labor Force 153,124,000
- U3 Unemployment Rate = 4.6%
In 2011, the Labor Force Participation Rate (LFPR) was 64.1%
- Labor Force (LF) = 153,617,000 [Employed 139,869,000 + Unemployed 13,747,000)
- Civilian Noninstitutional Population (CNP) = 239,618,000
- LFPR = LF 153,617,000 / CNP 239,618,000
- LFPR = 64.1%
- U3 Unemployment Rate = Unemployed (those not employed, seeking employment) / Labor Force
- In 2011, the U3 Unemployment Rate was 8.9%
- U3 Unemployment Rate = Unemployed 13,747,000 / Labor Force 153,617,000
- U3 Unemployment Rate = 8.9%
In 2014, the Labor Force Participation Rate (LFPR) was 62.9%
- Labor Force (LF) = 155,922,000 [Employed 146,305,000 + Unemployed 9,617,000)
Civilian Noninstitutional Population (CNP) = 247,947,000
- LFPR = LF 155,922,000 / CNP 247,947,000
- LFPR = 62.9%
- U3 Unemployment Rate = Unemployed (those not employed, seeking employment) / Labor Force
- In 2014, the U3 Unemployment Rate was 6.2%
- U3 Unemployment Rate = Unemployed 9,617,000 / Labor Force 155,922,000
- U3 Unemployment Rate = 6.2%
Now let’s see what it would take to get back to a 2007 Labor Force Participation Rate (LFPR) of 66.0% and 4.6% U3 Unemployment Rate
- …assuming a Civilian Noninstitutional Population growth rate of 200,000 per month X 12 months X 10 years = 24 million increase from 2014 - 2024
- Labor Force (LF) = 179,593,000 [Employed 171,291,000 + Unemployed 8,301,000) Civilian Noninstitutional Population (CNP) = 271,947,000
- LFPR = LF 179,593,000 / CNP 271,947,000
- LFPR = 66.0%
- U3 Unemployment Rate = Unemployed (those not employed, seeking employment) / Labor Force
- In 2024, the U3 Unemployment Rate would be 4.6%
- U3 Unemployment Rate = Unemployed 8,301,000 / Labor Force 179,593,000
- U3 Unemployment Rate = 4.6%
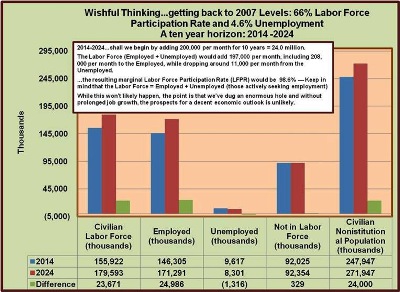
So in short, we’ve dug ourselves into an enormous hole, one that would require us to grow 25 million jobs over the next 10 years to get us back to pre-recession level Labor Force Participation Rate of 66% and 4.6% unemployment rate.
So, what were the groups hardest hit by the change in the labor force participation rate?
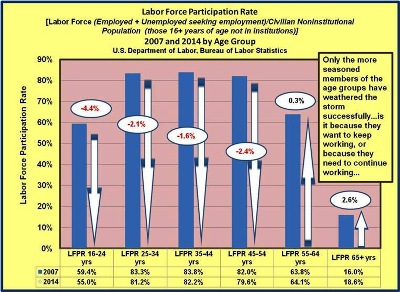
So let’s take a look at the underlying data on the various age groups. Keep in mind that while the population sizes (Civilian Noninstitutional Population and the Labor Force) of the segments have changed over time, it is important to focus on the Labor Force Participation Rate which provides insight into how those segments have been affected by the ongoing economic downturn – at least so far as the labor markets are concerned.
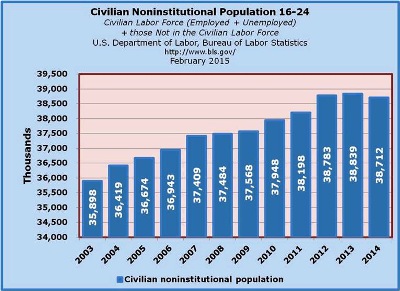
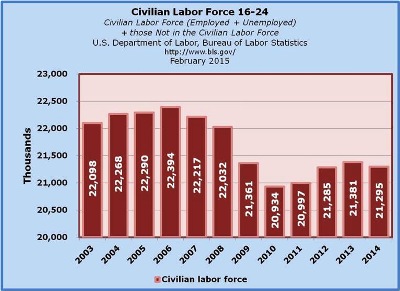
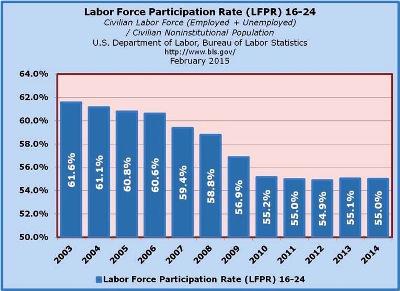
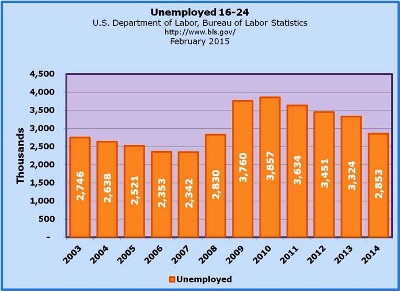
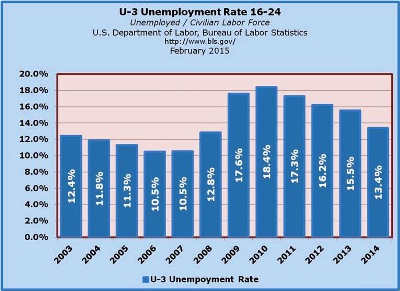
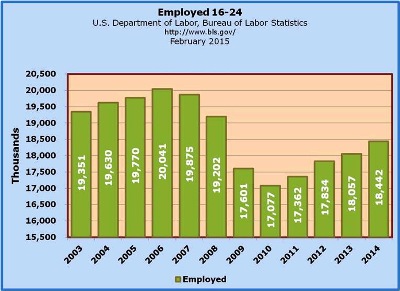
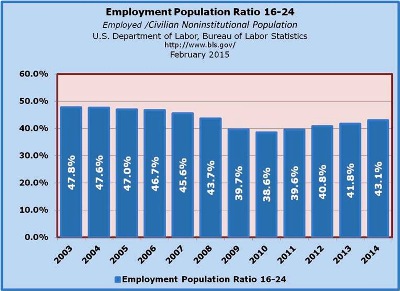
Age Group: 16 – 24 (2007-2014)
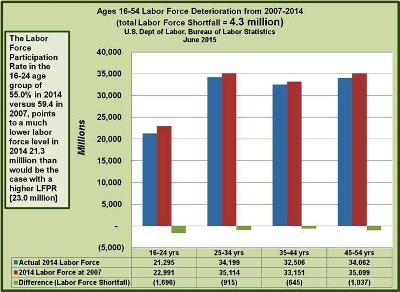
While the Civilian Noninstitutional Population has been growing in this segment has grown by 1.3 million from 2007 through 2014, the Labor Force fell by 922,000. As a result, the Labor Force Participation Rate fell by 4.4%.
In addition, unemployment rose by 511,000 from 2007 through 2014 and drove the Unemployment Rate from 10.5% to 13.4% (2.9% higher in 2014 than in 2007).
Lastly, employment fell by 1.4 million from 2007 to 2014, going from 19.9 million down to 18.5 million. Since employment fell by 1.4 million and the population rose by 1.3 million it stands to reason that the Employment-Population Ratio (Employed / Civilian Noninstitutional Population) also fell; which it did, by 2.6% (from 45.6% to 43.1% --- rounding).
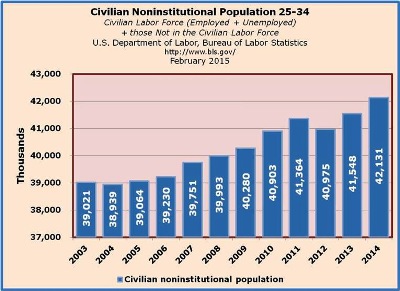
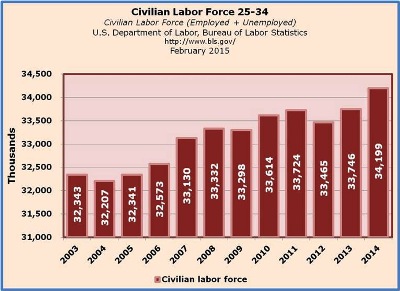
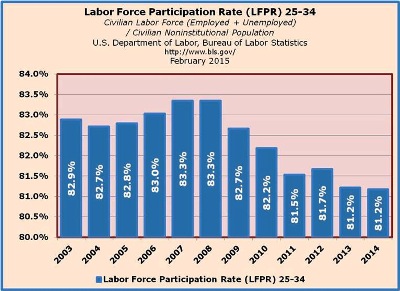
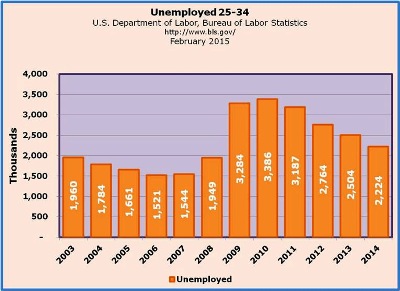
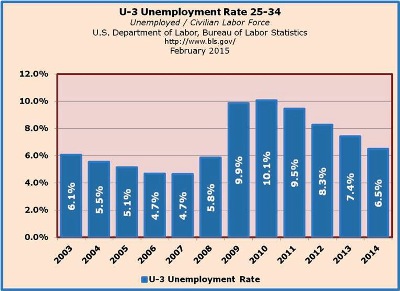
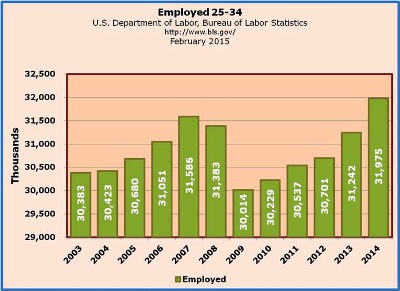
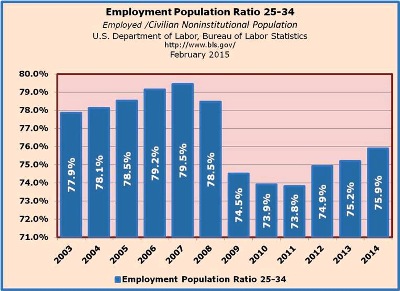
Age 25-34 (2007-2014)
While the Civilian Noninstitutional Population went from 39.8 million 41.2 million for a 2.4 million increase, the Labor Force grew by 1.1 million. The marginal Labor Force Participation Rate (1.1 million / 2.4 million) was only 44.9%. As a result, the Labor Force Participation Rate fell from 83.3% in 2007 to 81.2% in 2014.
Unemployment rose by 680,000 from 2007 through 2014 and drove the Unemployment Rate from 4.7% to 6.5% (1.8% higher in 2014 than in 2007). The unemployed went from 1.5 million to 2.2 million, while the Labor Force went from 33.1 million to 34.2 million.
Lastly, employment rose by 389,000 from 2007 to 2014, going from 31.6 million up to 40.0 million. Since employment rose by only 389,000 and the population increased by 2.4 million, the marginal Employment-Population Ratio (Employed / Civilian Noninstitutional Population) was only 16.3%, driving the ratio from 79.5% in 2007 down to 75.9% in 2014 (-3.6% change).
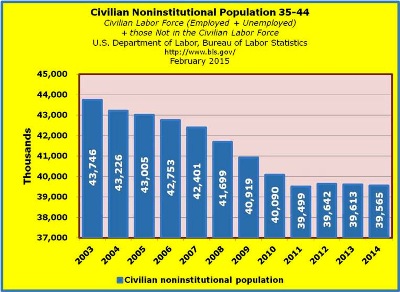
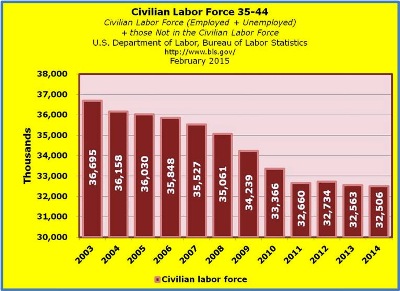
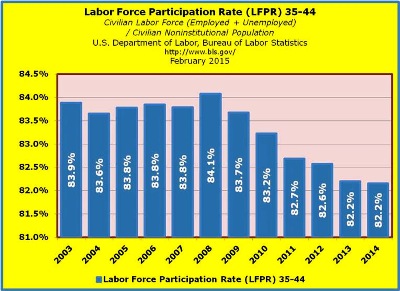
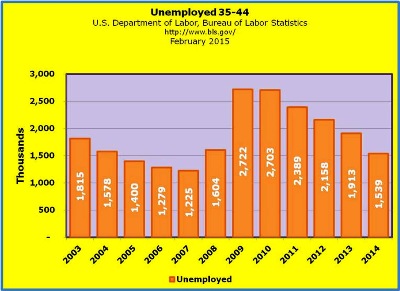
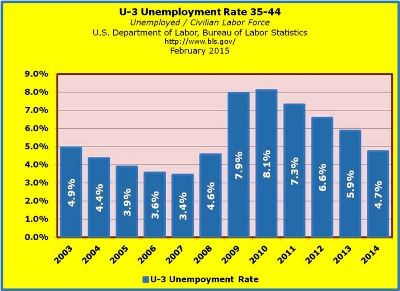
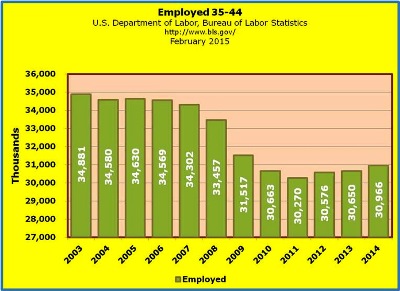
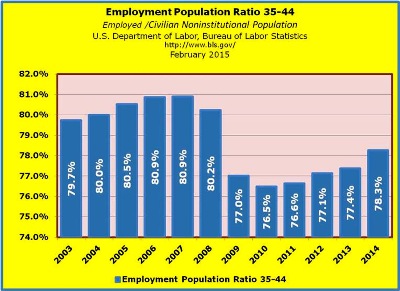
Age 35-44 (2007-2014)
The Civilian Noninstitutional Population went from 42.4 million down to 39.6 million for a 2.8 million decrease and the Labor Force fell by 3.0 million from 35.5 million in 2007 to 32.5 million in 2014. The Labor Force Participation Rate went down 1.6% from 83.8% in 2007 to 82.2% in 2014.
Unemployment rose by 314,000 from 2007 through 2014 and drove the Unemployment Rate from 3.4% to 4.7% (1.3% higher in 2014 than in 2007). The unemployed went from 1.2 million to 1.5 million, while the Labor Force went from 35.5 million to 32.5 million.
Finally, the Employment-Population Ratio (Employed / Civilian Noninstitutional Population) went from 80.9% in 2007 down to 78.3% in 2014 (-2.6% change).
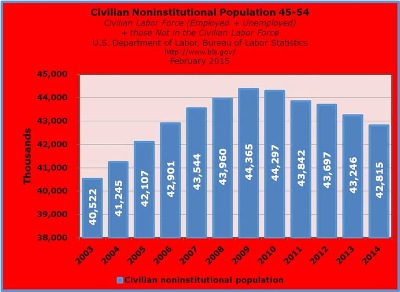
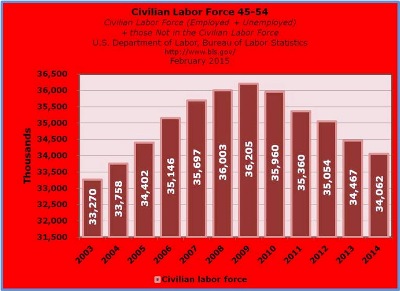
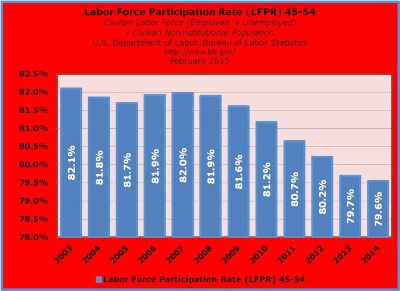
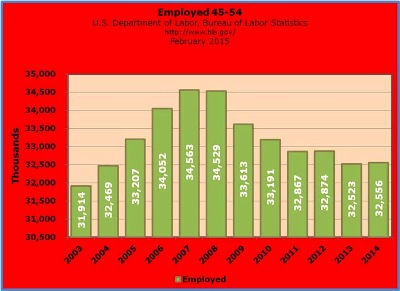
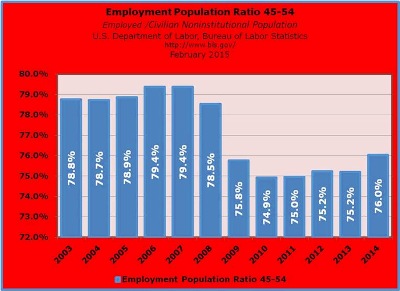
Age 45-54 (2007-2014)
The Civilian Noninstitutional Population went from 43.5 million down to 42.8 million for a 729,000 decrease and the Labor Force fell by 1.6 million from 35.7 million in 2007 to 34.1 million in 2014. The Labor Force Participation Rate went down 2.4% from 82.0% in 2007 to 79.6% in 2014.
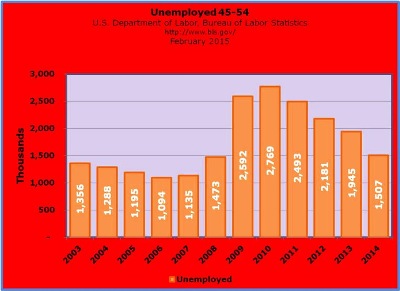
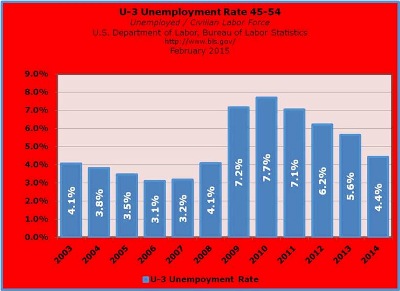
Unemployment rose by 314,000 from 2007 through 2014 and drove the Unemployment Rate from 3.4% to 4.7% (1.3% higher in 2014 than in 2007). The unemployed went from 1.2 million to 1.5 million, while the Labor Force went from 35.5 million to 32.5 million.
Finally, the Employment-Population Ratio (Employed / Civilian Noninstitutional Population) went from 80.9% in 2007 down to 78.3% in 2014 (-2.6% change).
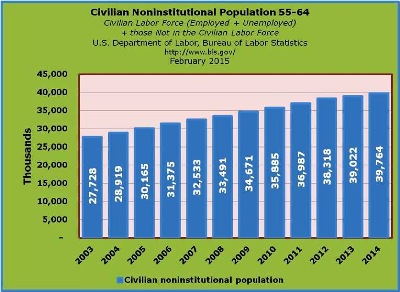
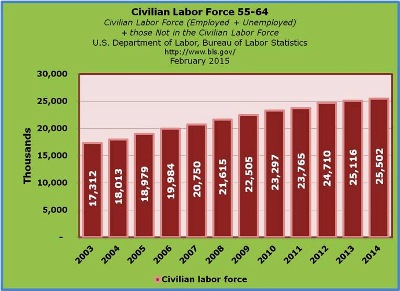
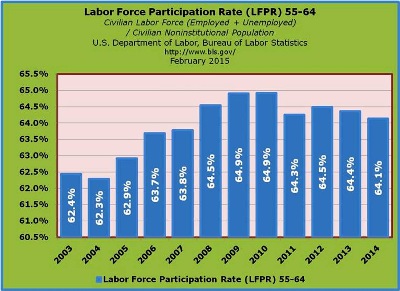
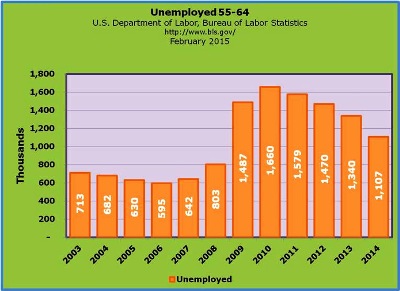
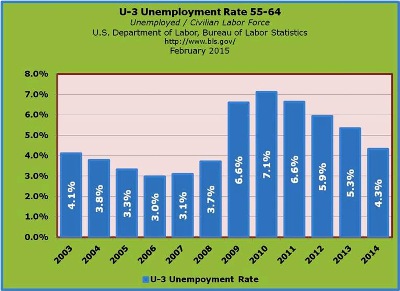
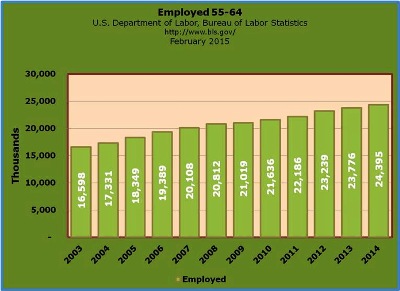
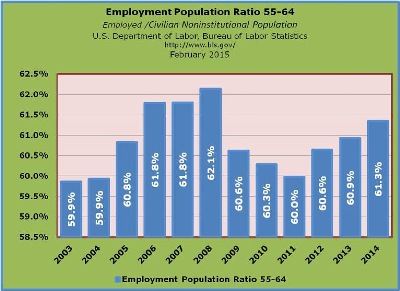
Age 55-64 (2007-2014)
The Civilian Noninstitutional Population went from 32.5 million up to 39.8 million for a 7.2 million increase and the Labor Force rose by 4.8 million from 20.7 million in 2007 to 25.5 million in 2014. The Labor Force Participation Rate increased 0.35% from 63.8% in 2007 to 64.1% in 2014.
Unemployment rose by 465,000 from 2007 through 2014, driving up the Unemployment Rate from 3.1% to 4.3% (1.2% higher in 2014 than in 2007). The unemployed went from 642,000 million to 1.1 million, and the employed went from 20.1 million to 24.4 million for a 4.3 million increase. The adds to the Employed and the Unemployed resulted in the Labor Force going from 20.7 million to 25.5 million (+465,000 Unemployed +4.3 million Employed = 4.8).
Finally, the Employment-Population Ratio (Employed / Civilian Noninstitutional Population) went from 61.8% in 2007 down to 61.3% in 2014 (-0.5% change).
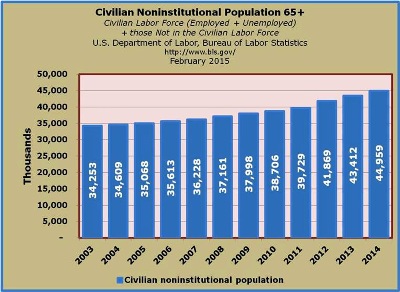
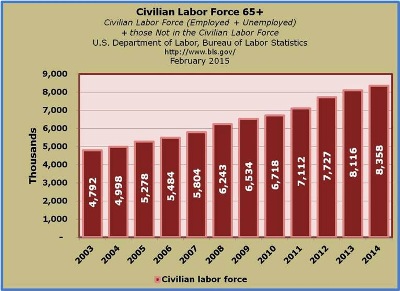
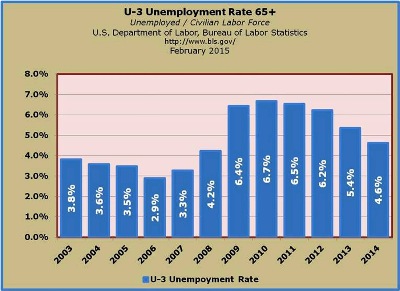
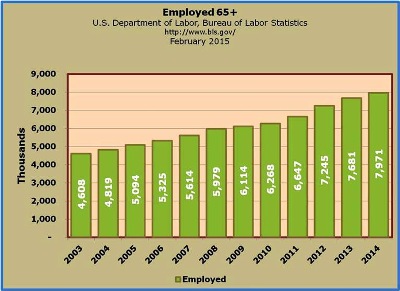
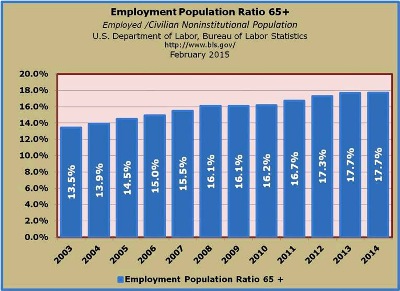
Age 65+ (2007-2014)
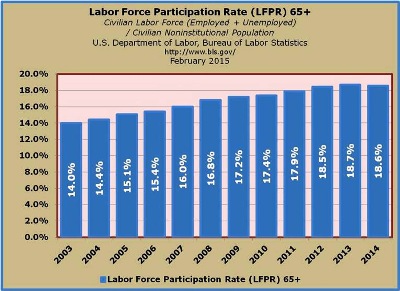
The Civilian Noninstitutional Population went from 36.2 million up to 45.0 million for an 8.8 million increase and the Labor Force rose by 2.6 million from 5.8 million in 2007 to 8.4 million in 2014. The Labor Force Participation Rate increased 2.6% from 16.0% in 2007 to 18.6% in 2014.
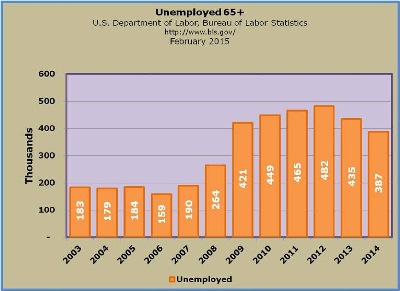
Unemployment rose by 197,000 from 2007 through 2014, driving up the Unemployment Rate from 3.3% to 4.6% (1.3% higher in 2014 than in 2007). The unemployed went from 190,000 to 387,000, and the employed went from 5.6 million to 8.0 million for a 2.4 million increase. The adds to the Employed and the Unemployed resulted in the Labor Force going from 5.8 million to 8.4 million (+197,000 Unemployed +2.4 million Employed = 2.6).
Finally, the Employment-Population Ratio (Employed / Civilian Noninstitutional Population) went from 15.5% in 2007 up to 17.7% in 2014 (+2.2% change).