2015 Volume Issue 5
June 5, 2015
For a downloadable version, click the following:
…a bit more compressed version of the PDF
Encouraged Worker Effect
May 2015 Labor Report shows more Employed and more Unemployed – yep, it’s a good month!
Employment Situation – May 2015 (released June 5, 2015)
www.bls.gov/news.release/archives/empsit_06052015.pdf
Digging into the Monthly Employment Numbers
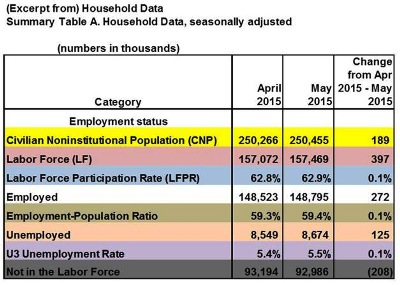
- In the latest news release we saw an increase in the Civilian Noninstitutional Population (CNP) of 189,000 (those people 16+ who are not in the military, prison, or counted in some other institutionalized setting).
- The Labor Force (LF) (those Employed 272,000 + those Unemployed 125,000 actively seeking employment) increased by 397,000! We’ll speak to the rising unemployed shortly.
- Since the LF expanded by 397,000 and the CNP grew by only 189,000 (a respectable number), this pushed the Labor Force Participation Rate up by 0.1%, moving from 62.8% in April to 62.9% in May. This is a very good thing!
- Employed grew by a healthy 272,000 in the Current Population Survey as well as 280,000 in the Payroll or Establishment Survey. It’s been a while, but it is good to see them moving in the same direction.
- Employment-Population Ratio rose by 0.1%, the result of a robust Employment figure compared to the CNP (Employed 272,000 / CNP 189,000): the Employment-Population Ratio needle moved from 59.3% to 59.4%.
- Unemployed rose by 125,000. Now how can that be a good thing you ask? The key to this is that U3 Unemployment counts those people who are not employed, but are actively seeking employment. Stick with this for a moment…
- The Unemployment Rate ticked up by 0.1%, going from 5.4% in April to 5.5% in May 2015. How can this be viewed as a positive thing? The key here is to focus on the unemployed as a measure of those not employed, but SEEKING EMPLOYMENT. Whether or not this translates into higher employment levels in the subsequent months ahead remains to be seen, but this may well be a good indicator – we’ll see.
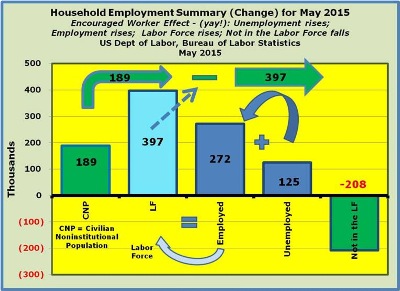
- Not in the Labor Force dropped by 208,000 in the month of May…wow! What does this mean? Well, on a NET BASIS, we saw the following:
CNP grew by 189,000
The LF grew by 397,000 (of that 272,000 were added to the Employed and 125,000 flowed into the ranks of the Unemployed)
CNP 189,000 = LF 397,000 + Not in LF -208,000
So, in essence, with the Labor Force expanding by more than the working age population actually grew, then this means that 208,000 people moved from the sidelines back into the LF.
What does this latest monthly (Labor) report signal?
While this is only one month, it provides us with a very good blueprint of what a healthy month should look like:
- An expanding labor force – hopefully larger than the additions to the working age population (Civilian Noninstitutional Population)
- Growing employment
- Static or even rising unemployment (pulling people back into the labor force) for several months to come
- Shrinking or static ‘not in the labor force’ component
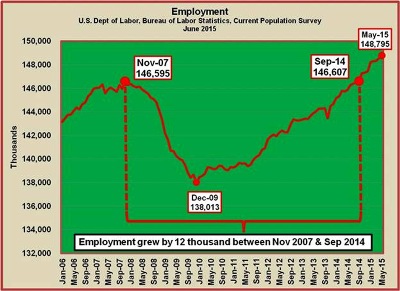
Last words…Employment finally back to the 2007 level
(Nov 2007 to Sep 2014 --- nearly 7 years)
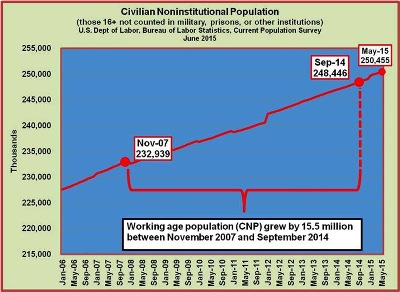
The point is that as we have indicated in the past, it was not until September 2014 that we clawed back to the pre-recession employment levels (146.6 million) from November 2007 (146.6 million) [note: according the NBER – National Bureau of Economic Research www.nber.org/cycles.html, the recession went from December 2007 – June 2009 --- go figure]. To further press the point home, the CNP or Civilian Noninstitutional Population expanded by 15.5 million in that same time frame.
We have a lot of ground to make up in the months/years to come.