2015 Volume Issue 3
May 4, 2015
For a downloadable version, click the following:
…a bit more compressed version of the PDF
What’s become of the Labor Markets over the Past Several Years?
Our Concerns regarding the Labor Force Participation Rate (LFPR) go back to 2010
www.econnewsletter.com/may122010blog.html
We’ve been dedicating many issues in our newsletter to the ongoing problems in the labor market – in fact; we first mentioned the problem posed by the collapsing Labor Force Participation Rate as far back as five years ago in May 2010:
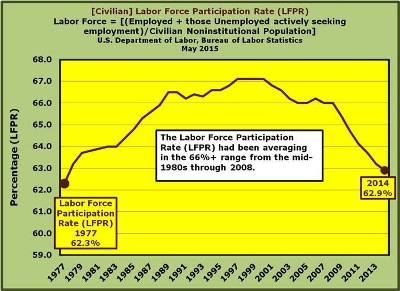
“The Labor Force Participation rate has been in the 66.0% range for the past several years prior to the end of 2008.”
“In April 2010, the Labor Force Participation Rate (Labor Force as a percentage of Civilian noninstitutional population) = 65.2%; in December 2007, the rate was 66%.”
The Civilian Noninstitutional Population is comprised of those individuals 16 years of age and older, excluding those in the military, prison, or otherwise institutionalized.
The Civilian Labor Force Participation Rate (LFPR) Summary
The Labor Force Participation Rate (LFPR) measures the Labor Force (Employed + those Unemployed actively seeking employment) divided by the Civilian Noninstitutional Population. The significance of this measurement is that it captures both those folks: 1) employed and 2) those people unemployed, but actively seeking employment. While a persistently high unemployment rate is typically an incendiary topic, the good side of it is that it can also signal hope for those affected, assuming jobs are forthcoming. What we’ve found over the course of the past several years is that while jobs have been created and filled, employment levels have only recently reached the point where they were in 2008.
When you have significant levels of people not employed over a very long period of time (2009-2014), it’s no wonder you have millions moving out of the labor force, resulting in the lowest Labor Force Participation Rate in 37 years (1977-2014). While there are many explanations for the deterioration of the Labor Force Participation Rate (LFPR), including the expanding group of Baby Boomers (born 1946-1964) moving out of the labor force toward retirement and younger folks requiring more education to meet the demands of an increasingly competitive global labor market; the truth remains that many people have remained on the sidelines – out of the labor force, who would otherwise be contributing to this arguably stalled or at least middling economy.
Highlighting the U-3 Unemployment Rate (the official Unemployment Rate) and the Payroll Employment Survey (from the Current Employment Statistics, or CES)
It’s one thing to record and analyze the monthly data, which of course has not typically been all that great once you get beyond the U-3 Unemployment Rate and employment figures from the Payroll Survey; but this time around, we will take a longer ‘look back’ and then we will dig into the characteristics of the age groups across the spectrum (if not in this newsletter, then certainly the very next one).
Again, we’ve covered the U-3 Unemployment and Payroll Employment Survey ground extensively, but it won’t hurt to review it just the same.
The Official U-3 Unemployment Rate and the more inclusive U-6 Unemployment Rate
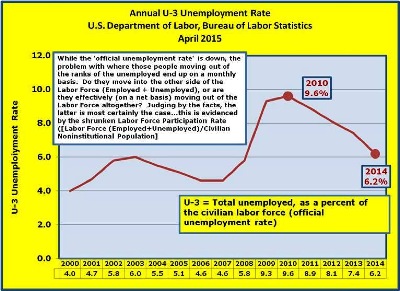
The monthly reported unemployment data from the U.S. Department of Labor, Bureau of Labor Statistics, highlights the U-3 Unemployment Rate. When we speak of unemployed, we are referring to those counted in the Labor Force who are not employed, but are actively seeking employment. From a historical context, in a somewhat normal employment market, reporting the U-3 unemployment number would typically suffice. Following a recession, it would not be unusual for the unemployment rate to actually rise a bit, due to what is referred to as the ‘encouraged worker effect’. Simply put, as the economy recovers, more people enter back in to the labor force searching for jobs that are either waiting to be filled, or in the making. When the jobs pipeline begins to fill more quickly, you would expect the unemployment numbers to fall and the employed numbers to rise even more rapidly, to absorb those from the ranks of the unemployed and also the new entrants into the Civilian Noninstitutional Population.
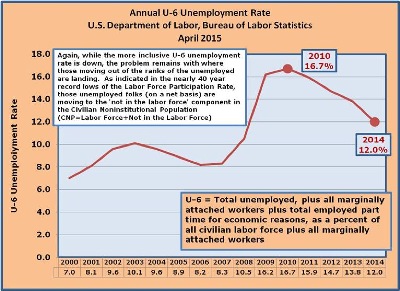
In the following two illustrations, we show two measures of unemployment over a several year period. Keep in mind that U-3, or the official unemployment rate came in at 5.5% in March 2015, while the U-6 or broader measure of unemployment registered 10.9%. Both rates are coming down, but as we’ve noted earlier and will see later in this article (and the next), the unemployment measurement can be misleading when we are digging into the details in the labor markets. If, on a net basis, the Labor Force (Employed +Unemployed) was on the rise, then it would bode well for the labor markets in general, since that would indicate that workers would either be encouraged by jobs immediately available (those added to employed for the month), or those jobs that were going to be filled in the near term (encourage those unemployed, seeking employment). Even if the ranks of the unemployed were on the rise, or being back-filled by those moving out the ranks of those ‘not in the labor force’, then this would certainly signal a rebounding growth in the jobs market.
Payroll Survey versus Household Survey
Again, we’ve discussed the differences between the Payroll Survey (CES) and the Household Survey (CPS) on numerous occasions, but short story is that the Payroll Survey is a formal monthly data gathering endeavor targeting larger entities, like companies and government agencies; while the Household Survey bases its data on phone calls to individuals, asking them a series of questions including whether or not they are working. Since the Household Survey includes calls to those people in the Payroll Survey and also the self-employed, those working at small businesses, agricultural workers, etc., it actually is larger in scope than the Payroll Survey (Payroll counts every job where an individual is working, while the Household Survey only counts one job --- you’re either working, or you’re not).
The ‘employment’ number that the media focuses on in the monthly labor reporting is the Payroll Survey. While the Payroll Survey is effectively a subset of the Household Survey (www.bls.gov/opub/mlr/2006/02/art2full.pdf); they can, at times, vary significantly on a monthly basis.
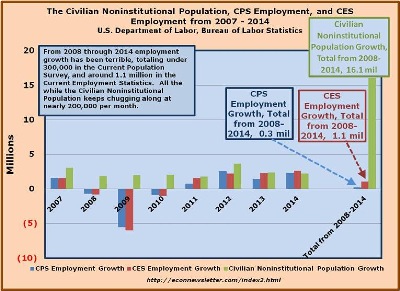
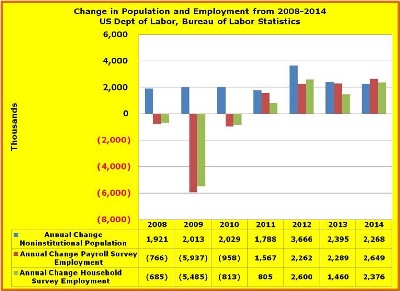
In comparing the CES Employment (Current Employment Statistics) to the CPS Employment (Current Population Survey), both have performed anemically between 2008 and 2014: the CES Employment grew by a total of 1.1 million; the CPS Employment expanded by under 300,000; while the CNP (Civilian Noninstitutional Population) grew by 16 million. This breaks down to around 3,000 jobs per month for the CPS Employment and 13,000 per month for the CES Employment over the last seven years (2008-2014). In that same seven year period, the CNP (Civilian Noninstitutional Population) grew by 191,000 per month.
The Labor Force and the Unemployed
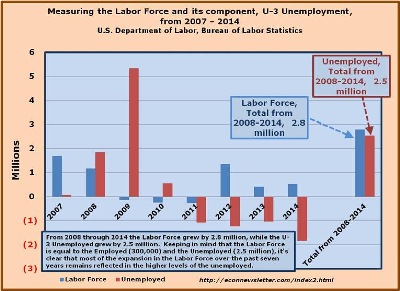
Even if we focus on the (Civilian) Labor Force (Employed + Unemployed actively seeking employment) the picture painted over the last several years is alarming. The Labor Force grew by 2.8 million from 2008 through 2014, with 2.5 million of that growth reflected in a greater number of people unemployed, while less than 300,000 were added to the employment rolls. What’s astonishing and most troubling about the shrinking ranks of the unemployed is that, on a net basis, they are just not moving into the other side of the labor force: the employed side of the labor force house. This phenomenon is illustrated by the fact that while the unemployment rate (and the numbers of unemployed) is coming down very nicely, the Labor Force Participation Rate remains very low. This is not to say that people are not moving from the unemployed category to employed status, but when we look at things on net basis, that is when we look at the Labor Force Participation Rate over a period of time, there are not enough jobs (Employment) being created to move adequate numbers from the Unemployed and new adds to the Civilian Noninstitutional Population to move the LFPR upward, let alone maintain its current level.
From 2011 – 2014 Unemployment fell by 5.2 million, yet the Labor Force only expanded by 2.0 million. Furthermore, 10.1 million people were added to the Civilian Noninstitutional Population in that same four year time frame.
The Labor Force Participation Rate (LFPR) Continues to dampen any hope for a Significant and Sustained Recovery
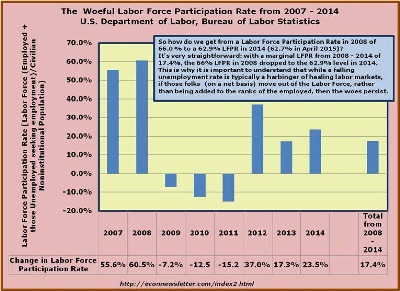
So how do we get from a Labor Force Participation Rate in 2008 of 66.0 % to a 62.9% LFPR in 2014 (62.7% in April 2015)?
It's very straightforward: with a marginal LFPR from 2008 - 2014 of 17.4%, the 66% LFPR in 2008 dropped to the 62.9% level in 2014.
The Labor Force [Employed 0.3 million + Unemployed seeking employment 2.5 million), while the Civilian Noninstitutional Population expanded by 16.1 million, leaving us with a marginal Labor Force Participation Rate (LFPR) of 17.4% from 2008-2014.
This is why it is important to understand that while a falling unemployment rate is typically a harbinger of healing labor markets, if those folks (on a net basis) move out of the Labor Force, rather than being added to the ranks of the employed, then the woes persist.
Simply put, employment must continue to grow at a rate high enough to absorb entrants into the Civilian Noninstitutional Population (roughly 200,000 per month), along with those leaving the ranks of the unemployed. Without sufficient job growth, then the Labor Force Participation Rate will continue at the same low levels.
The Recession and Recovery in the 1980s
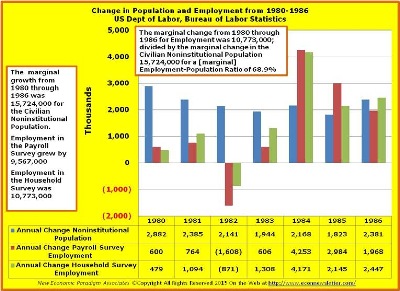
In taking a look back at the recession and recovery in the 1980s we saw massive job growth, following a recession that coincided with a large group from the tail end of the Baby Boomers entering into workforce. In spite of the large number of people on the sidelines, the job growth was strong. The unemployment rate was very high (9.7% in 1982) and remained above 6% through 1987, but the Labor Force Participation Rate grew from 64.0% in 1982 to 65.6% in 1987. The main point of course being that significant job growth was sufficient to absorb the new adds to the Civilian Noninstitutional Population and ‘encourage’ the unemployed to hang in there while the economy expanded.
The Recession December 2007 – June 2009 and Recovery 2009 and Onward
First, it is important to note that the latest ‘official’ recession, as dictated by the National Bureau of Economic Research (NBER) ran from December 2007 through June 2012.
US Business Cycle Expansions and Contractions
Now, in looking at the massive fall-off in jobs in 2009 in particular, the disappointment in the jobs associated with the ‘recovery’ through 2014 barely recoups those jobs lost from 2008 through 2010, never mind the new additions to the Civilian Noninstitutional Population, or the millions who were at first unemployed, and later moved out of the Labor Force entirely (again, on a net basis).
As noted earlier, we will be drilling down into the various age groups in the very next newsletter article.
Monetary and Fiscal Policy Review
We often look to the government for answers in terms of directing or managing economic recovery, growth and/or stability. We look to the Federal Reserve Board (FED), to direct the monetary policy. On that score, they have kept the targeted Federal Funds Rate [through massive purchases of financial securities as directed by the Federal Open Market Committee (FOMC)] in the 0.0-0.25% range since the end of 2008 www.federalreserve.gov/monetarypolicy/openmarket.htm.
This accommodative behavior by the FED has certainly helped in terms of the stock market, but even with low interest rates, unless businesses grow and take advantage of the low interest rates, then job growth will remain flat. Furthermore, with the move by pretty much the rest of the world to depreciate their currencies, relative to the US dollar, it’s difficult to envision any kind of growth in the export sector (outside of oil and gas, perhaps). This of course will reduce net exports (exports minus imports) and lower Gross Domestic Product (GDP).
On the fiscal side, increasing budget deficits and non-growth targeted policies, will only serve to further exacerbate the current labor market issues. The argument of course is that if we raise taxes, this depresses the economy, but if we reduce taxes at current spending levels, this will serve to increase deficits and pile more on to the exploding national debt. While the pro-growth, reduced taxes argument will likely cause higher deficits in the near-term, especially without some spending reductions; the truth is that without growth there is no hope of bringing those idled workers in the ranks of the unemployed and those sidelined (‘not on the labor force’) back into the employed status.
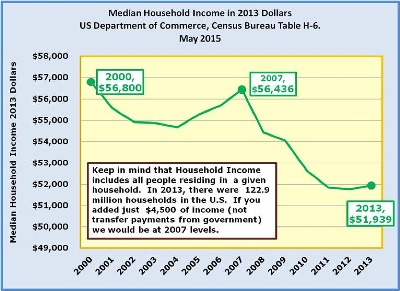
Collapsed Real Median Income
The simple truth is that we need more people working to fund government programs, including Social Security, Disability, Medicare, and Medicaid; and we also need them working to raise the slumping, real median income levels. The only way that this will happen is if the economy grows sufficiently to hire those idled workers.
We’ve heard pundits cautioning us not pit income distribution against growth – meaning, that those same pundits have determined that they are mutually exclusive and somehow diametrically opposed. Again, the fact remains that without growth, there is no hope of a more balanced income distribution that would satisfy anybody. We at this newsletter have stated repeatedly that growth and a more equitable income distribution is best arrived at through via a ‘competitive free market’ model.
On to the characteristics of the labor markets by age group in the next newsletter…happy spring (or fall if you’re below the equator)!