
2015 Volume Issue 4
May 8, 2015
For a downloadable version, click the following:
…a bit more compressed version of the PDF
audio versionLabor Markets Update April 2015
The Big Picture of the Labor Markets once again: looking back to 2011 up to 2014; and onward
We’ve been focusing on the bigger picture and we promised to drill down on the labor markets by age group, but let’s go through that big picture one more time…
From 2011 through 2014, unemployment dropped by 4.1 million –-- must be a good thing, right…not so fast. The problem was that the Civilian Noninstitutional Population – CNP (16+ years of age, not counted in military, prison, or otherwise institutionalized) grew by 8.3 million and the employment grew by 6.4 million. When the change in the Employed (6.4 million) are added to the Unemployed (-4.1 million), the resulting Labor Force change is 2.3 million. Since the CNP grew by 8.3 million, and only 2.3 million were added to the Labor Force, then labor markets were only absorbing those people at a 27.7% rate (marginal Labor Force Participation Rate or LFPR).
If those 4.1 million moving from the ranks of the unemployed had been absorbed into the Labor Force, Employment would have been much more robust (by 4.1 million) and the Labor Force Participation Rate would be at a much healthier 64.6%. At the end of the day, it is far more important that those folks moving from the ranks of the unemployed move into the other side of the Labor Force (Employed +Unemployed), than into the ‘not in the Labor Force’ category.
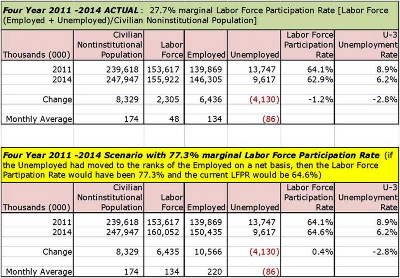
Brief Explanation of Graphic 2011 through 2014: Actual and Scenario IF 4.1 million moved from Unemployed to Employed
Employment_Situation_Update_April_2015.
What if Employment were to grow at the same rate as the Population and Unemployment remained Constant?
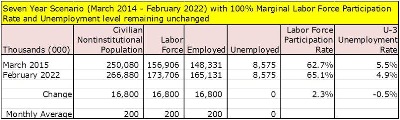
Looking ahead over a seven year period, if the Civilian Noninstitutional Population (CNP) expanded at a rate of 200,000 per month and the Unemployment level remained the same, and all of the new adds to the CNP translated into higher employment (200,000 per month on a net basis), what a difference it would make to the labor situation!
Employment would grow by 16.8 million
Unemployed would remain at 8.6 million, but due to the new adds to the Civilian Noninstitutional Population, the U-3 Unemployment Rate would drop from 5.5% to 4.9%.
Since the Labor Force would expand by 16.8 million (same amount as the new adds on CNP front), this would drive the Labor Force Participation Rate back to a much more respectable 65.1% rate.
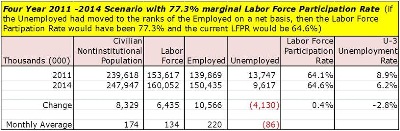
What would happen if the 4.1 million reduction in Unemployment between 2011 and 2014 had moved into the Employed, rather than out of the Labor Force?
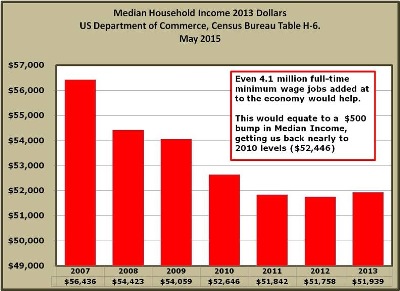
On a different take, in our last newsletter we highlighted the fall-off in the real median income for households (stated in 2013 dollars) where it went from $56,436 in 2007 to $51,939 in 2013.
Now households numbered 122,952,000 in 2013 (total population was about 316.5 million, so that comes out to around 2.6 people per household) so that represents a fixed pie so to speak; meaning, if we add or subtract jobs to the mix, the number of households would remain constant for that snapshot.
Again, in 2013 the median (average) real income per household was $51,939 and the household total was 122,952,000, this brings us to a total ‘real’ income of $6.4 trillion (money income).
As noted previously, and illustrated below, if the 4.1 million from the unemployed had moved into the employed sector (on a net basis), rather than moving into the ‘not in the labor force’ component of the Civilian Noninstitutional Population, then an average income of $15,000 per year (full-time at current minimum wage of $7.25 per hour), would have added around $500 to the median income ($51,939 to $52,446). The point of this is exercise is that while we would love to see high paying, high quality jobs added to the economy; at the moment, it’s more about stopping the bleeding (people moving out of the labor force) and any job growth in the private sector is welcome. The emphasis on private sector is important since public sector jobs are funded most directly by taxes. This is not to say that private sector jobs are entirely disconnected from the public sector (e.g., defense industry, consultants, contractors, etc.), but it is the private sector growth where there is the biggest bang for the buck, so to speak.
So the trick is to add more jobs to the economy from either the monthly growth in the Civilian Noninstitutional Population or from the ranks of the unemployed. The last thing we want to see are more people moving out the ranks of the Labor Force (Employed + Unemployed actively seeking employment) and into the ‘not in the labor force’ component of the Civilian Noninstitutional Population.
The April 2015 Employment Situation: Employment up; Unemployment falling slightly…the makings of a good month
Lastly, the Employment Situation for April 2015 was released today.
THE EMPLOYMENT SITUATION —APRIL 2015
U.S. Department of Labor, Bureau of Labor Statistics
www.bls.gov/news.release/archives/empsit_05082015.pdf
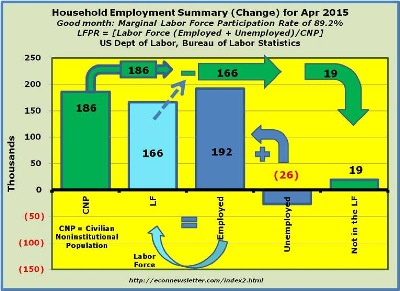
There was good news for the month of April in that there was job growth to the tune 192,000; a fall-off in Unemployment (-26,000); for an increase in the Labor Force (Employed + Unemployed seeking employment) in the amount of 166,000, again all monthly figures representing a change from March 2015 through April 2015.
The Labor Force Participation was also strong for the month of April: Labor Force (166,000) divided by Civilian Noninstitutional Population (186,000), for a marginal LFPR for the month of 89.2%. Remember, even if we see higher unemployment in the months ahead; so long as the Labor Force continues to grow at a high rate, then the labor markets will continue to heal.
Once more, we have delayed getting to the labor markets by age group, but we will get to that early next week.
Thanks to those shrinking numbers of WWII veterans…70th anniversary of VE (Victory in Europe) Day.
World War Two Memorial Commemoration Ceremony May 8, 2015
