2016 Volume Issue 1
Economic Newsletter for the New Millennium
January 10, 2016
For a downloadable version, click the following:
…a bit more compressed version of the PDF
Reviewing the Macroeconomic Indicators through 2015: first up -Labor Markets
In this newsletter we will review the changes in the Labor Markets over the past several years
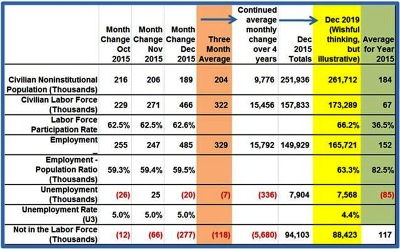
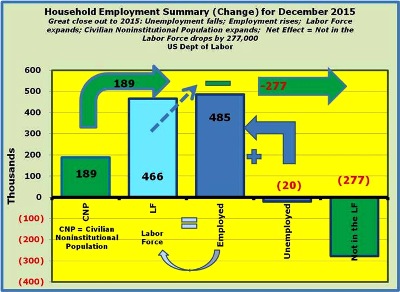
The December 2015 Employment Situation Report was very good, with Employment expanding by 485,000, the Labor Force growing by 466,000 and Unemployment dropping by 20,000.
www.bls.gov/news.release/archives/empsit_01082016.pdf
Along with the month of December, the last three months of the Employment Situation Report was very hopeful, but if you look at the year in total, it revealed how far we really have to go in bringing the labor markets back to pre-recession levels. There are many arguments and explanations as to why the labor force (including the Labor Force Participation Rate) has changed so much, but the last three months has revealed that even with very little change in the unemployment level (-21,000 from October through December), and employment growing significantly (+987,000 from October through December), many people can be coaxed off the sidelines from the ‘not in the labor force’ component (-355,000 from October through December) of the Civilian Noninstitutional Population.
While people often note that the ‘full employment’ unemployment rate is in the 5% range; where the economy is theoretically running at full capacity and further reductions in the unemployment rate could prompt inflationary pressure, what they fail to recognize is that employment can expand without appreciably affecting the unemployment rate. What we have experienced in the last three months of 2015 illustrates just this point: employment expanded by 987,000; unemployment only fell 20,000; and the ‘not in the labor force’ component fell by 355,000. The balance of the composition of the increase in employment came from the additions to the Civilian Noninstitutional Population (CNP) of 611,000 over those last three months. This is not to say that all of the additions to the CNP went into the ranks of the employed, but the employment measurements are ‘effective’ changes in those categories measured.
By the way, we will be drilling down a bit further and discussing the Labor Force Participation Rate in particular in a future newsletter.
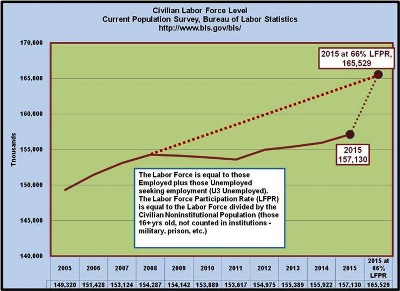
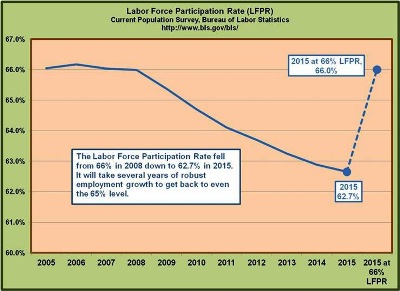
As illustrated above, in the last few months of 2015, the employment picture has improved a good deal, but it will take several years of significant jobs growth to get us back anywhere near the pre-recession labor force participation rate of 66%.
So what does all of this change in the Labor Markets mean?
If employment expanded at the rate of 329,000 per month over the next four years (through 2019) the Labor Force Participation Rate would go from the current 62.6% (December 2015) to 66.2%. Keep in mind that this is holding Civilian Noninstitutional Population growth constant at 204,000 per month, U3 unemployment at about the current level (dropping 7,000 per month), and the ‘not in the labor force’ component shedding 118,000 per month as well.
So how far behind are we in terms of the Labor Market?
The various measures in the Current Population Survey are derived from the Civilian Noninstitutional Population which counts that segment of the total population which is 16+ years of age that are not included in the various institutional populations such as the military, prisons, etc.
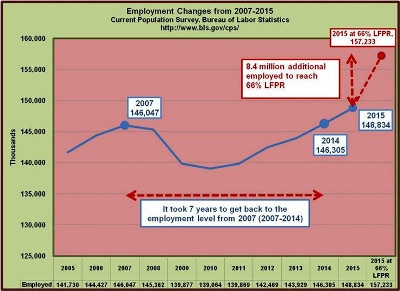
In the Great Recession, the labor markets took a significant hit, but what typically occurs is that employment tends to bounce back to previous levels at a fairly short order. Given the severity of the recession, one would expect that it would take a bit longer to recover this time around. Just the same, since the recession ended in June 2009 (according to the NBER www.nber.org/cycles/cyclesmain.html), so you could reasonably expect that employment would rebound to pre-recession levels within a year or two of that date. The fact is that it took until 2014 to reach the 2007 employment level. In addition to that, it must be noted that population, and more specifically, the Civilian Noninstitutional Population continued to grow at around a 200,000 per month rate. In effect, the Civilian Noninstitutional Population grew by 16 million from 2007 through 2014 while employment grew by a mere 258,000.
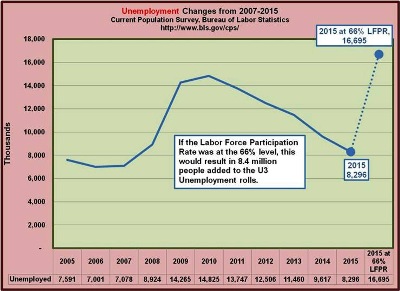
Now, as you might well expect, the unemployment levels rose dramatically during the recession, going from 7.1 million in 2007 to 14.8 million in 2010. The disconnect occurred in the aftermath of the recession (again, ending in June 2009) that the employment growth was absent as illustrated in the fact that it took seven years through 2014 to get back to 2007 employment levels. While unemployment has fallen, owing for the most part to people moving out of the labor force, the employment growth has simply not been enough to offset the falling unemployment.
Enter the Labor Force Participation Rate
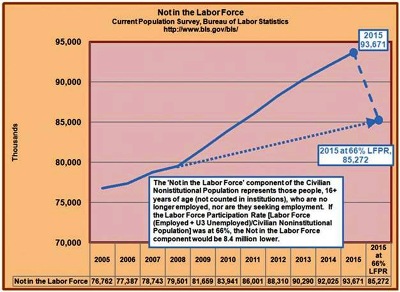
The Labor Force Participation Rate is equal to those employed plus those unemployed (actively seeking employment) divided by the Civilian Noninstitutional Population. As late as 2008 the Labor Force Participation Rate (LFPR) was at 66.0%. Since that time, the LFPR has fallen to 62.7% (note: it is up to 62.6% in December 2015). While Unemployment has fallen from a high of 14.8 million in 2010 to 8.3 million in 2015 (7.9 million in December 2015), the employment gains have not been enough to keep the LFPR from dropping so low. Again, from 2007 through 2014 employment only grew by 258,000 in total. When you factor in the added Civilian Noninstitutional Population expansion of 16.0 million from 2007-2014, the low employment numbers and the falling unemployment, you have the perfect storm where massive numbers of people end up leaving the labor force. In fact, the ‘Not in the Labor Force’ component of the Civilian Noninstitutional Population grew by 14.9 million from 2007 through 2014.
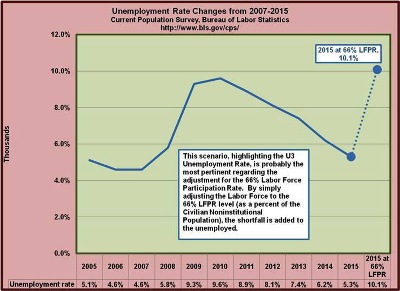
In summary, from 2007 through 2015 the Labor Force grew by 4.0 million, while the Civilian Noninstitutional Population grew by 18.9 million, for a marginal LFPR of 21.2%. This illustrates how the LFPR fell from 66.0% in 2007 to 62.7% in 2015. Based on a 66.0% LFPR with the 18.9 million CNP growth from 2007- 2015, the total Labor Force would be 12.5 million. Since total employment increased by 4.0 million this equates with a shortfall of 8.4 million jobs at the end of 2015. The problem with regaining even some of those lost jobs require us to absorb the new monthly additions to the CNP (around 200,000) at a rate higher than the current 62.7%. The ideal would be to have a marginal Labor Force Participation Rate in excess of 100% for several months…years ahead. The good news was that the marginal Labor Force Participation Rates for October through December 2015 were well in excess of 100% (averaging 161%).
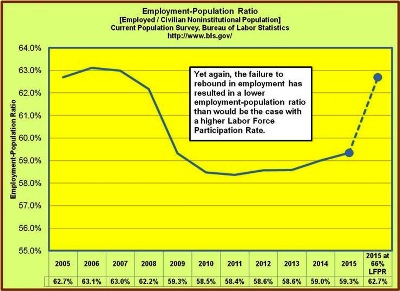
The following graphs illustrate the current labor market situation