
April 27, 2017
Economic Newsletter for the New Millennium
For a downloadable version, click the following:
…a bit more compressed version of the PDF
We're trying something a bit new this time around.
Left click on the link below to view a video presentation of this latest newsletter article on the Federal Reserve.
2017_Volume_Issue_2_Econ_Newsletter_4-24-2017.mp4
Please let us know your thoughts.
We're planning on continuing with these video clips going forward.
WHAT’S UP WITH THE FEDERAL RESERVE??
THE FED --- FOMC IS ON TRACK TO RAISE THE TARGETED FED FUNDS RATE MULTIPLE TIMES IN 2017
Anyone with even a smidgen of economic literacy can see that the last nine years have flirted with, if not achieved, the lowest average rate of recovery, if one dares use that term, since before WWII if not in our in our entire recorded history as a nation. In case you were sleep-walking through the last several years, here are the quarterly figures for this painful period.
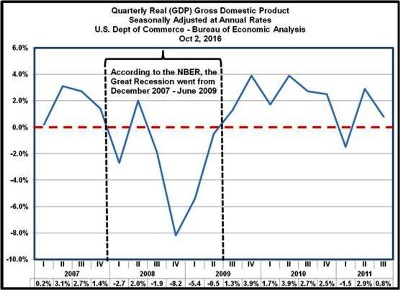
Subpar Economic Growth 2009 - 2016
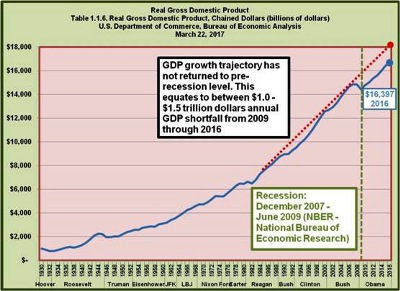
The U.S. has not returned to previous economic growth --- the pre-recession trajectory. Over the last eight years (2009-2016) amounts to a cumulative $8-12 trillion shortfall or GDP gap. Historically, a recession cycle is followed by a relatively rapid return to previous economic growth levels. It might take a few years, but again the U.S. economy has tended to get back on track relatively quickly. This has not been the case of course in the period following this last recession which, according to the National Bureau of Economic Research, went from December 2007 through June 2009.
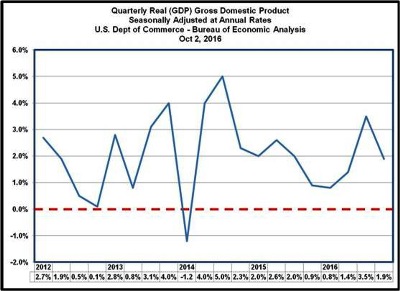
Failure to Launch – first administration since at least Hoover to not reach 3% annual growth
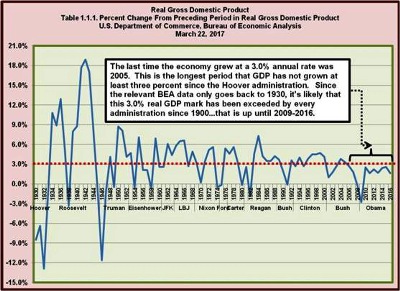
The last time that the US economy hit the 3% economic growth bar was in 2005. Considering the fact that the economy shrank in 2008 and 2009, it should have been a relatively easy thing for the real annual level of GDP growth to rebound to 3% or even much higher for a couple of years. The closest we came was 2.6% in 2015. Unfortunately, the 2016 GDP number of 1.6% was the lowest since 2010. As an aside, the real GDP data from the U.S. Commerce Department, Bureau of Economic Analysis only shows data going back to the last few of years of President Herbert Hoover’s second administration, from 1930-1932 – the first three full years of the Great Depression. Again, that is the last time that an administration oversaw such an economic phenomenon.
Of course the Fed wouldn’t want to raise interest rates – think again
In spite of this less than robust economic growth, the Federal Open Market Committee – the FOMC, led by the Chair of the Federal Reserve Board of Governors, has already begun to raise interest rates, more specifically, the targeted Federal Funds Rate.
www.federalreserve.gov/monetarypolicy/openmarket.htm
FOMC's target federal funds rate or range, change (basis points) and level
In a ‘normal’ environment, the FOMC would set a targeted Fed Funds Rate and the NY Fed would take the necessary steps in the secondary US Treasury Securities markets to drive the rate in the desired direction. If the FOMC wanted to drive up the rate, the NY Fed would sell securities (or simply buy fewer securities than would otherwise be the case), causing interest rates to rise due to the increased availability of securities. Conversely, if the FOMC directed the NY Fed to drive down the Fed Funds Rate, they would purchase securities from dealers in the secondary markets.
In 2011, the FED instituted a policy tool wherein they would pay interest on depository reserves at the upper targeted Fed Funds Rate.
https://www.federalreserve.gov/monetarypolicy/reqresbalances.htm
The Federal Reserve Banks pay interest on required reserve balances and on excess reserve balances." "As indicated in the minutes of the March 2015 FOMC meeting, the Federal Reserve intends to set the IOER (interest rate on excess reserves) rate equal to the top of the target range for the federal funds rate."
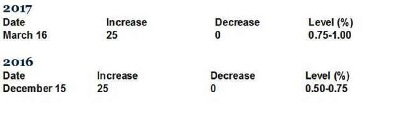
Interest Rates on Reserve Balances for March 22, 2017
Last Updated: March 21, 2017 at 4:30 p.m., Eastern
- Rate on Required Reserves (IORR rate) 1.00 3/16/2017
- Rate on Excess Reserves (IOER rate) 1.00 3/16/2017
Paying interest on legal reserves has resulted in major change in open market operations
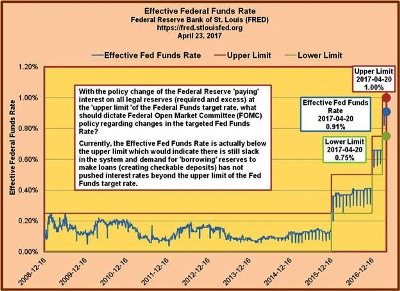
With the policy change of the Federal Reserve 'paying' interest on all legal reserves (required and excess) at the 'upper limit 'of the Federal Funds target rate, what should dictate Federal Open Market Committee (FOMC) policy regarding changes in the targeted Fed Funds Rate?
Currently, the Effective Fed Funds Rate is actually below the upper limit which would indicate there is still slack in the system and demand for 'borrowing' reserves to make loans (creating checkable deposits) has not pushed interest rates beyond the upper limit of the Fed Funds target rate.
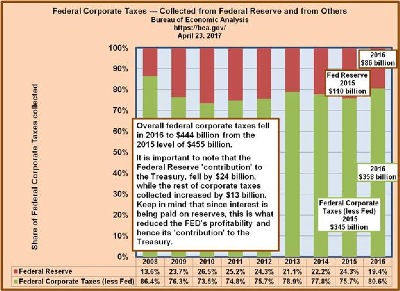
Owing to the reduction in the 'contributions’ from the Federal Reserve to the U.S. Treasury, the overall Federal Corporate Taxes shrank by 2.4% in 2016 from the 2015 level.
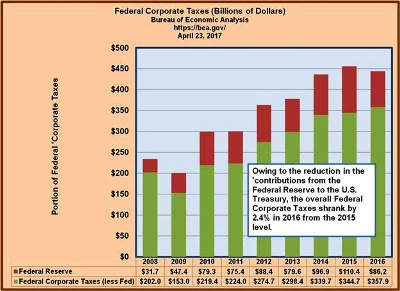
Overall federal corporate taxes fell in 2016 to $444 billion from the 2015 level of $455 billion. It is important to note that the Federal Reserve 'contribution' to the Treasury, fell by $24 billion, while the rest of corporate taxes collected increased by $13 billion. Keep in mind that since interest is being paid on reserves, this is what reduced the FED's profitability and hence its 'contribution' to the U.S. Treasury.
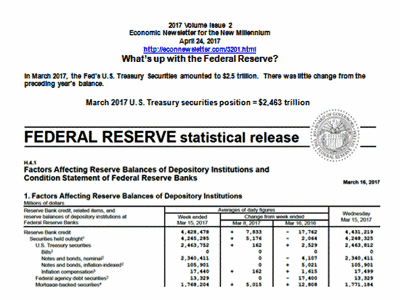
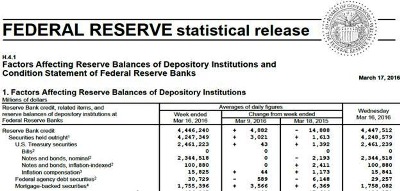
Federal Reserve Portfolio Holdings: March 2017 and March 2016
In March 2017, the Fed’s U.S. Treasury Securities amounted to $2.5 trillion. There was little change from the preceding year’s balance.
- March 2017 U.S. Treasury securities position = $2,463 billion
In March 2016, the Fed’s U.S. Treasury Securities amounted to $2.5 trillion. There was little change from the preceding year’s balance.
- March 2017 U.S. Treasury securities position = $2,461 billion
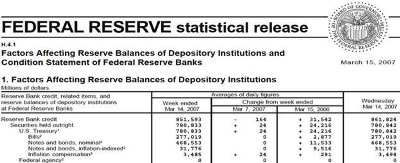
So what did the FED look like before the Financial Collapse?
In March 2007, the Fed’s U.S. Treasury Securities amounted to $781 billion. There was little change from the preceding year’s balance.
- March 2007 U.S. Treasury securities position = $781 billion
In order to return to the pre-recession level, the FED would have to liquidate $3.5 trillion in Treasury Securities and other portfolio holdings (MBS – Mortgage Backed Securities).
Wrap-up
In summary, the Federal Reserve System (FED), through the Federal Open Market Committee (FOMC) has taken steps to drive up interest rates, the targeted Federal Funds Rate in particular. The wisdom of driving up those rates is open for debate, especially considering the lackluster performance of the economy over the past several years. We will be walking through the various macroeconomic metrics in the near future, but suffice to say that at least so far as economic growth is concerned, the FED’s actions seem less than warranted.
Beyond the rationale for interest rate hikes and the normal pronouncements by the Federal Open Market Committee to change the Fed Funds Rate Target, the most interesting and concerning part of this story is that the FED, by paying interest on both required and excess reserves at the upper end of the targeted rate has altered the way it has done business in the past. Simply put, in the past the process was for the FOMC to direct the New York Fed to take action in the ‘secondary’ markets by buying and selling U.S. Treasurys in an effort to push the Effective (actual) Federal Funds Rate to the desired level.
This has of course all changed since the FED implemented its paying interest on legal reserves. We pointed out that while the FED’s portfolio holdings have changed very little from March 2016 to March 2017, the Federal Funds Rate has gone up dramatically. It’s plain to see that the FED’s contribution to the U.S. Treasury decreased significantly from 2015 to 2016 and will certainly continue to fall in 2017.
Considering this current environment, how might one know when it could arguably be prudent for the FED to raise interest rates? A simple possibility would be if the Effective Federal Funds Rate actually went past the upper targeted limit. This would signal that the demand for credit was strong enough to move the rate to that higher level – beyond that upper limit, which the depositories were being paid for simply parking their excess reserves.
The takeaway here is that the FED, in implementing monetary policy, has effectively changed the way that it alters interest rates (i.e., the Effective Federal Funds Rate). In the recent past, it was achieved through the buying (lowering rates) and selling (raising rates) those securities in the secondary markets. It’s obvious that they’re concerned with upsetting financial markets if they decided to trim down those holdings in any significant way. Keep in mind that the current level of required reserves supporting the monetary base is less than $120 billion. The FED currently has around $2.3 trillion in total reserves. The latest chatter has to do with the FED actually shrinking its portfolio going forward. We’ll get to that later.
