
2017 Volume Issue 3
Economic Newsletter for the New Millennium
May 25, 2017
For a downloadable version, click the following:
…a bit more compressed version of the PDF
Again, going forward we're trying something a bit new.
Left click on the link below to view a video presentation of this latest newsletter article on the Federal Reserve.
May_2017_Labor_Force_Participation_Rate-b.mp4
Please let us know your thoughts.
We're planning on continuing with these video clips going forward.
ARE THE LABOR MARKETS REALLY IN THAT GOOD OF SHAPE? NOT REALLY
Federal Reserve Philadelphia Bank President Patrick Harker: "We’re looking at a labor market more or less at full health, with very little slack."
Fed’s Harker: "Very Little Slack" Left in Labor Market May 12, 2017
www.philadelphiafed.org/newsroom/press-releases/2017/051217
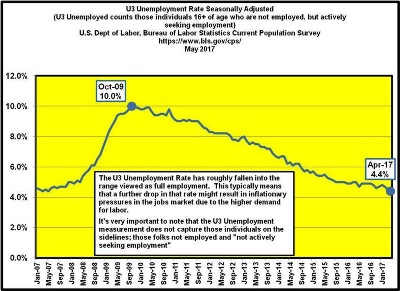
In looking at the 4.4 U3 Unemployment rate for April 2017, this would appear to reinforce the claim that the labor markets are humming along just fine and would justify the Federal Reserve’s position on driving up interest rates over the course of the next several months due to inflationary pressures on wages. In fact, the average U3 Unemployment rate was 5.0% from 2000 through 2007. So why is it that we are questioning the health of the labor markets?
Enter (yet again) the Labor Force Participation Rate (LFPR)
The Labor Force Participation Rate is calculated by combining those employed with those unemployed actively seeking employment and dividing that total by the Civilian Noninstitutional Population. As we’ve noted on several occasions, the LFPR has fallen precipitously since 2008 and has not gained much traction.
The Current Population Survey is conducted by the U.S. Census Bureau for the Bureau of Labor Statistics. On a monthly basis, 60,000 households are surveyed and provide detailed information regarding individuals in that household sector:
- Civilian Noninstitutional Population (CNP) – 16+ years of age not in institutions (military, prison, etc.)
- Civilian Labor Force – those individuals from the CNP who are either employed or not employed but actively seeking employment (unemployed)
- Not in the Civilian Labor Force – those individuals in the CNP who are not part of the Labor Force [neither employed, nor actively seeking employment].
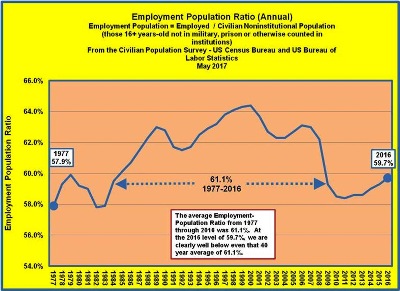
The survey itself is quite extensive, but we will focus on specific labor market issues including the Labor Force Participation Rate and the Employment-Population Ratio (Employed divided by the Civilian Noninstitutional Population)
Current Population Survey Questionnaire – Labor Force
www2.census.gov/programs-surveys/cps/techdocs/questionnaires/Labor%20Force.pdf
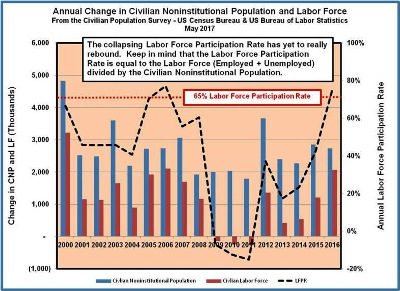
It’s clear from the preceding chart showing the annual changes in the Labor Force Participation Rate (LFPR) that massive numbers of people left the labor force between 2008 and 2015. During that time, the LFPR averaged 18.2% on an annual basis.
Here are a few questions that come to mind.
- Is the collapse in the Labor Force Participation Rate permanent?
- Can the LFPR return to pre-recession levels? How could this occur?
- Is it even feasible to see a return anywhere near the pre-recession level given the growing size of 65+ age group?
Back to the story: If the employment picture is so rosy, where have the 16 – 54 year olds gone in the Labor Force?
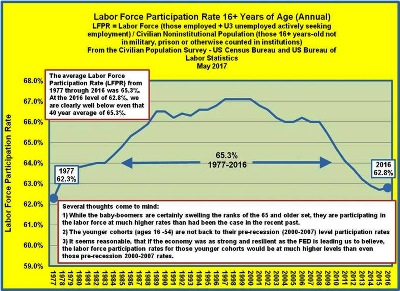
It’s a plain fact that the Baby-boomers (those born between 1946 and 1964) will continue to swell the ranks of 65 and over set. Conventional wisdom dictates that the labor force would naturally decline, based on increased numbers of people no longer being employed or even seeking employment (unemployed). While that age group is for the most part leaving the labor force in increasing numbers, the ratio of those staying is surprisingly large and growing. We will go into greater detail a bit later, but our primary focus will be on the younger age groups or cohorts as they are referred to by the Bureau of Labor Statistics and the Census Bureau.
Since the Baby-Boomers are moving into their retirements and leaving job openings, it would make sense that the younger age groups would be backfilling those vacancies and their Labor Force Participation Rates would be moving in the direction of the pre-recession levels (2000-2007 average)
The following table shows the continued shortfall in the Labor Force for the prime earning years ages 16 - 54:
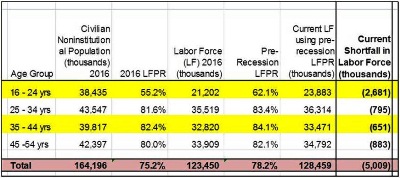
It would make sense that 1) the increased numbers of the Baby-Boomers leaving the labor force would open up jobs for the younger age groups; and 2) the Federal Reserve actions in driving up interest rates in response ‘tight’ labor markets, would point to at least a return to pre-recession levels, if not even more robust labor force participation rates for the age groups 16 through 54.
The fact is that, based on pre-recession Labor Force Participation Rates for the 16 to 54 year olds, we are clearly 5.0 million or more short of where the Labor Force should be at this point if in fact we had returned to pre-recession levels.
Drilling down on the Labor Force Participation Rate and Employment Population Ratio by Age Group
The Labor Force Participation Rate is measured by taking the Employed plus those Unemployed (U3) who are actively seeking employment and dividing that total by the Civilian Noninstitutional Population. The Employment-Population Ratio simply takes the Employed and divides it by the Civilian Noninstitutional Population. In the following graphs we will present material from the Current Population Survey as published by the U.S. Bureau of Labor Statistics in conjunction with the U.S. Census Bureau.
In each age group from 16 through 54, you will notice drop-off in the Labor Force Participation Rate without any significant bounce-back. In terms of the Employment Population Ratio, you will notice movement back toward pre-recession levels.
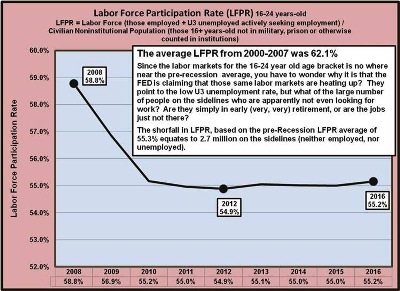
Labor Force Participation Rate: 16 to 24 years old
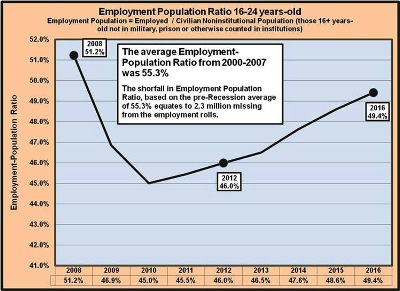
Employment-Population Ratio 16-24
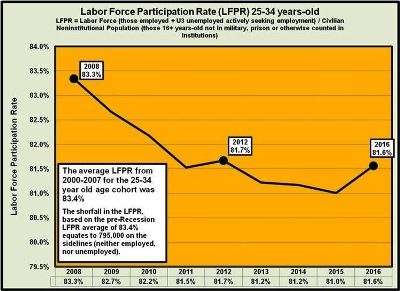
Labor Force Participation Rate: 25 to 34 years old
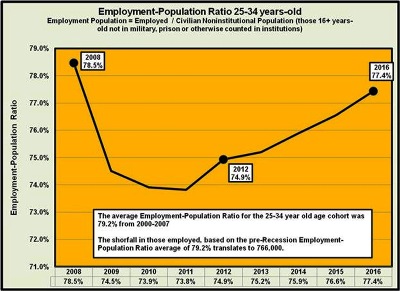
Employment-Population Ratio: 25-34 years old
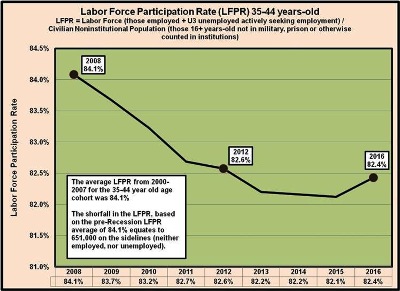
Labor Force Participation Rate: 35 to 44 years old
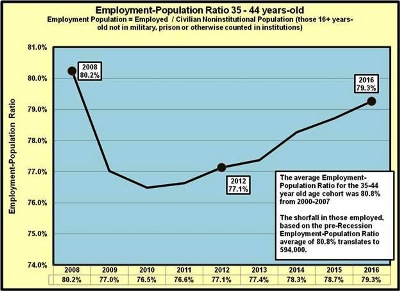
Employment-Population Ratio: 35-44 years old
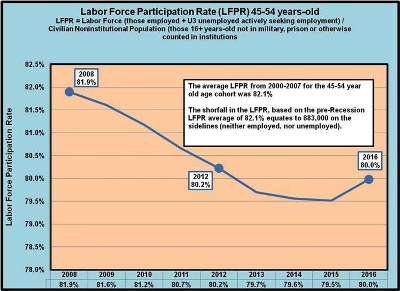
Labor Force Participation Rate: 45 to 54 years old
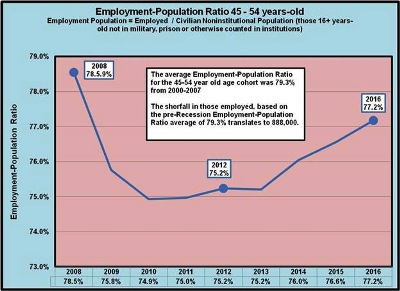
Employment Population Ratio: 45 to 54 years old
Moving to the age groups 55 and over…rising Labor Force Participation Rates and Employment-Population Ratios
Why are the older age cohorts, 55+ year olds, remaining in the labor force at higher levels than was previously the case?
- Inability to retire since they have not been able to save enough
- Remaining productive for longer due to employment not requiring as much strenuous labor
- Less expensive to employ based on reduced health care costs (Medicare) and reduced income requirements – willing to work for less
Probably all of the above and then some…
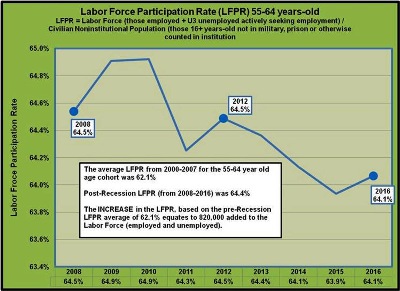
Labor Force Participation Rate: 55 to 64 years old
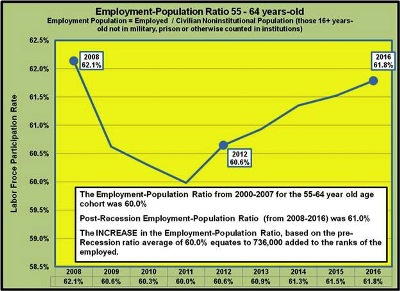
Employment-Population Ratio: 55-64 years old
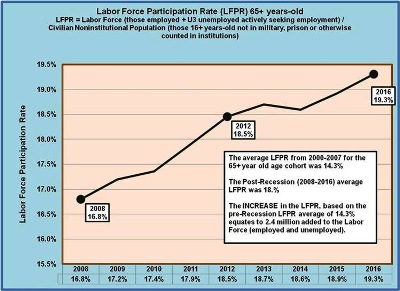
Labor Force Participation Rate: 65+ years old
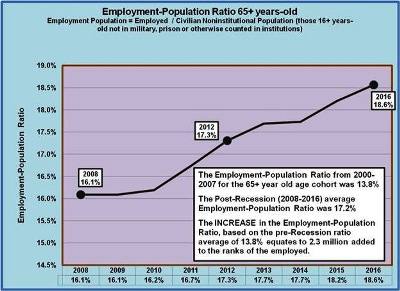
Employment-Population Ratio: 65+ years old
Can we reasonably expect to see improvements in the Labor Force Participation Rate and the Employment-Population Ratio?
It’s clear that the Federal Reserve is intent on driving up interest rates, pointing to the reduction in the U3 unemployment rate. What should be clear at this point is that both the Labor Force Participation Rate and the Employment-Population Ratio levels are still well below Pre-Recession levels. Many experts attribute the decline to the increasing number of people moving into their retirement years, but fact is that the 55+ age groups are actually remaining in the workforce at increasing levels, while the 16 through 54 year olds are still well below their Pre-Recession levels in terms of the LFPR and the Employment-Population Ratio.
So long as we see improvement in terms of economic growth (higher real GDP…much higher than 1st quarter 2017 0.7%) there is little doubt that more people will be drawn back into the labor force. Keep in mind that the prospect of new jobs will often cause the U3 Unemployment Rate to actually rise. This is referred to as the ‘encouraged worker effect’ and happens when those people on the sidelines, not in the labor force, are encouraged to once again seek employment. We’ve actually seen this going on of late, but it has to continue on a regular basis.

In an upcoming newsletter we will revisit the performance of the economy over the last several years, including economic growth, price level changes and we will once again summarize the employment picture. Our objective is to provide a baseline of sorts by which to measure future economic performance.
We will have several more topics going forward and as always, we welcome your feedback.
