
2017 Volume Issue 5
October 7, 2017
For a downloadable version, click the following:
…a bit more compressed version of the PDF
Left click on the link below to view a video presentation of this latest newsletter article on the Employment Situation in September 2017.
Link to video presentation…
Employment Explosion: September 2017
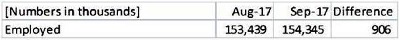
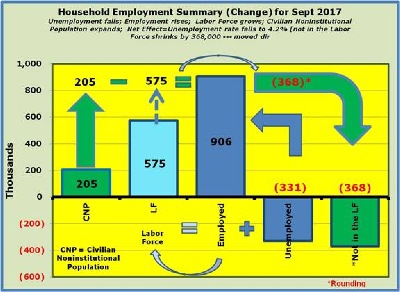
In the month of September, the Employment in the Current Population Survey grew by 906,000; this is the best read since November 2013 - prior to that point, you have to go back to 2003 for a 900,000+ month of growth.
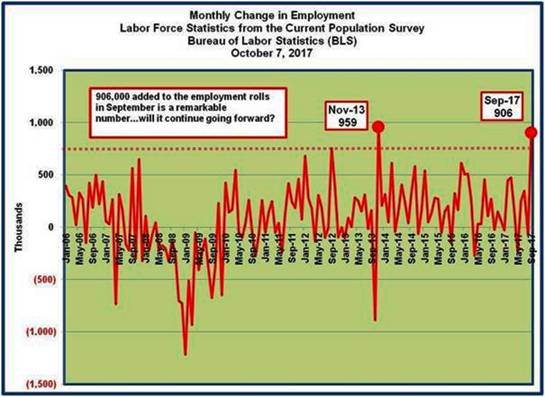
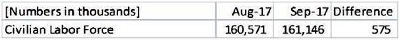
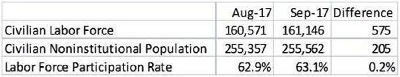
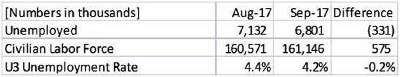
The most notable point in an overall remarkable 'Employment Situation' for September 2017 was that employment grew by 906,000. Again, this is record territory in terms of monthly job growth. There was also a waterfall of other good news on the labor front for the month. The labor force number is arrived at by adding the employed and the unemployed. The employed again came in at a plus 906,000 and the unemployed dropped and therefore 331,000 was subtracted, netting a positive for the labor force growth of 575,000 for September.
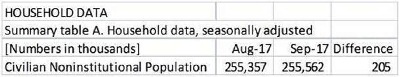
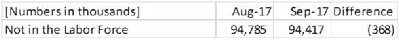
For the month of September, 205,000 people were added to the Civilian Noninstitutional Population (those 16+ who are not in the military, in prison, or otherwise counted in institutions). To arrive at the Not in the Labor Force total you subtract the Labor Force 575,000 from the Civilian Noninstitutional Population 205,000 to arrive at 368,000 reduction in the Not in the Labor Force.
To put it in perspective, the 368,000 that left the ranks of the 'not in the labor force', in a net sense, went directly into the ranks of the employed. This is further highlighted by a reduction in the unemployed of 331,000.
THE EMPLOYMENT SITUATION -SEPTEMBER 2017 (Bureau of Labor Statistics )
https://www.bls.gov/news.release/archives/empsit_10062017.pdf
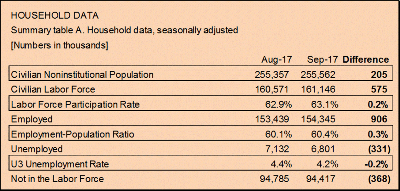
Excerpts from the September 2017 Household Data
The Civilian Noninstitutional Population grew by 205,000
The Civilian Labor Force (Employed + Unemployed) grew by 575,000
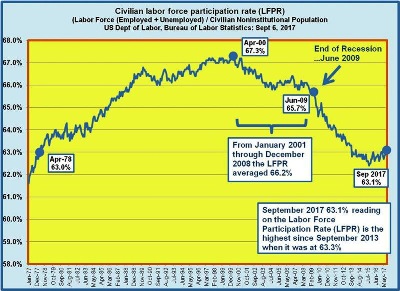
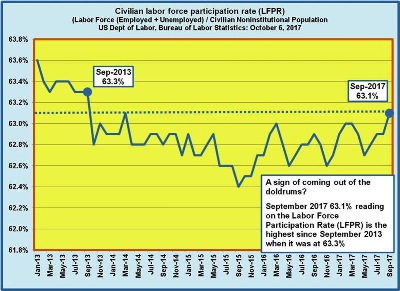
The Labor Force Participation Rate [Labor Force (Employed + Unemployed) / Civilian Noninstitutional Population] went from 62.9% in August to 63.1%
Employment expanded by 906,000 in September
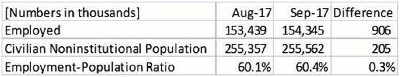
Employment-Population Ratio (Employed / Civilian Noninstitutional Population)
Unemployed dropped by 331,000
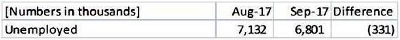
The U3 unemployment rate dropped from 4.4% in August to 4.2%
368,000 people moved directly back into the ranks of the employed from the 'not in the labor force' segment of the Civilian Noninstitutional Population
First, let's take a look at the Labor Force Participation Rate (LFPR)
The Labor Force Participation Rate is calculated by combining those employed with those unemployed actively seeking employment and dividing that total by the Civilian Noninstitutional Population. Since early in 2008, when the Labor Force Participation Rate was above 66%, the LFPR has fallen precipitously since 2008 and has not gained really gained that much traction. The good news in September was that the LFPR came in at 63.1%, higher than it has been since September 2013.
Enter the Employment-Population Ratio - the really, really big deal for the month of September
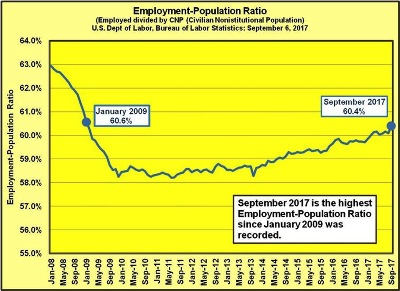
Coming in at 60.4% the Employment-Population Ratio was the best showing since January 2009.
The Employment-Population Ratio measures those that are employed divided by the Civilian Noninstitutional Population. In essence, it measures those in the population that pulling the oars, driving the economic engine.
What is clear is that while jobs are starting to finally show up, as depicted in the climbing Employment-Population Ratio, more idle folks have to continue to be brought back into the labor force from the sidelines.
So long as this job growth continues, it doesn't matter if the unemployment rate ticks up (encouraged worker effect) due to the improved prospect of employment opportunities, or if those on the sidelines go directly into the ranks of the employed. It all boils down to growing the economy at a rate sufficient to entice those on the sidelines to return to the ranks of the employed.
…a few last comments on the surveys from the monthly labor report Background on the Current Population Survey (Household Survey)
The Current Population Survey is conducted by the U.S. Census Bureau for the Bureau of Labor Statistics. On a monthly basis, 60,000 households are surveyed and provide detailed information regarding individuals in that household sector:
- Civilian Noninstitutional Population (CNP) - 16+ years of age not in institutions (military, prison, etc.)
- Civilian Labor Force - those individuals from the CNP who are either employed or not employed but actively seeking employment (unemployed)
- Not in the Civilian Labor Force - those individuals in the CNP who are not part of the Labor Force [neither employed, nor actively seeking employment].
The survey itself is quite extensive, but we will focus on specific labor market issues including the Labor Force Participation Rate and the Employment-Population Ratio (Employed divided by the Civilian Noninstitutional Population) Current Population Survey Questionnaire - Labor Force
(https://www2.census.gov/programs-surveys/cps/techdocs/questionnaires/Labor%20Force.pdf)
The Current Employment Statistics - CES (Establishment Survey/Payroll Survey)
For changes in jobs, the Bureau of Labor Statistics, along with the media in general, tend to point to the Payroll Survey/Report [Current Employment Statistics - CES (National)] which tallies up numbers drawn from surveys submitted by various entities - "Each month the Current Employment Statistics (CES) program surveys approximately 144,000 businesses and government agencies, representing approximately 554,000 individual worksites, in order to provide detailed industry data on employment, hours, and earnings of workers on nonfarm payrolls."
[T]otal nonfarm payroll employment changed little (-33,000), the U.S. Bureau of Labor Statistics reported today. A sharp employment decline in food services and drinking places and below-trend growth in some other industries likely reflected the impact of Hurricanes Irma and Harvey.
Further…
Hurricanes Irma and Harvey Hurricane Irma made landfall in Florida on September 10-during the reference period for both the establishment and household surveys-causing severe damage in Florida and other parts of the Southeast. Hurricane Harvey made landfall in Texas on August 25-prior to the September reference periods-resulting in severe damage in Texas and other areas of the Gulf Coast. Our analysis suggests that the net effect of these hurricanes was to reduce the estimate of total nonfarm payroll employment for September (Payroll Survey). There was no discernible effect on the national unemployment rate (Household Survey). No changes were made to either the establishment or household survey estimation procedures for the September figures.
Note
Again, in September, due at least in part to the disruption caused by Hurricane Harvey in Texas and Hurricane Irma in Florida, the Payroll Survey was adversely affected.
