
For a downloadable version, click the following:
2022 Volume Issue 1
March 22, 2022
Inflation: Push You --- Pull Me
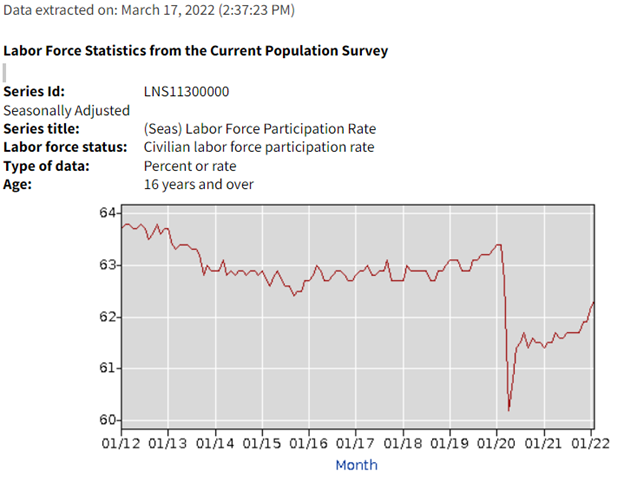
Labor Force Participation Rate
The Labor Force Participation Rate LFPR in February 2020 was at 63.4%, the highest it had been since 2013. We are currently at 62.3% (February 2022). The good news is that the employment picture has been improving and we still have quite a way to go to get back to a more respectable 64% + LFPR; that continued expansion of the labor force (employed + unemployed) should temper the wage inflation to some degree.
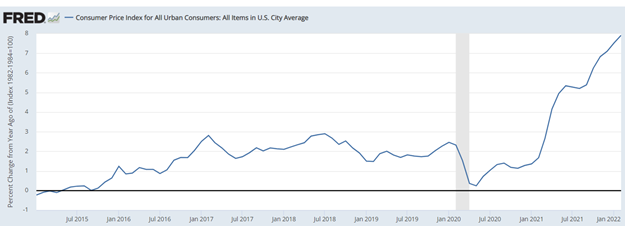
Inflation
The Consumer Price Index (CPI) (12-month look back), which measures prices at the consumer level (demand pull inflation) was at 2.3% in February 2020 and it’s currently at 7.9%, the highest rate of inflation since January 1982.
The Producer Price Index (PPI) (12-month look back), which measures prices at the firm level (buying labor, fuel, and other inputs) [cost push inflation] was at 1.1% in February 2020 and it’s currently at 10.1%, the highest level since 1980.

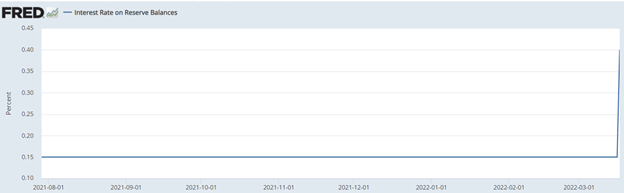
Here Comes the FED
So far as the Fed Funds Rate is concerned, interest on reserve balances (IORB) was raised from 0.15% to 0.40% as prompted by the FOMC actions increasing the targeted Fed Funds Rate: “…the Committee decided to raise the target range for the federal funds rate to 1/4 to 1/2 percent.” What this means is that the depositories will be paid that 0.40% on their legal reserves. In effect, that constitutes a risk-free rate and will certainly contribute to a rising interest rate environment as lenders will be seeking a higher rate of return as that 0.40% becomes the baseline.
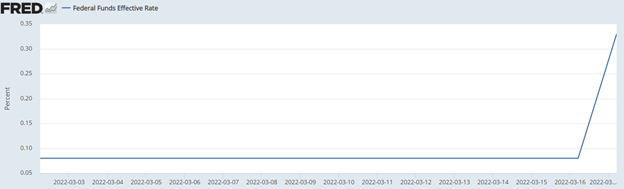
Targeted Fed Funds Rate
Effective Fed Funds Rate
The challenge for the FED will be how they go about reducing their balance sheet and how rapidly they accomplish it. In order to actually move the Fed Funds needle with monetary policy action, it will take an enormous effort especially considering the current level of $9 trillion assets [primarily 10- year Treasury Notes and Mortgage-Backed Securities (MBS)]. As an aside, it’s likely that the FED would change current 0% reserve to the previous 10% level.
Federal Reserve Balance Sheet…$9 trillion in Treasury Securities and Mortgage Backed Securities


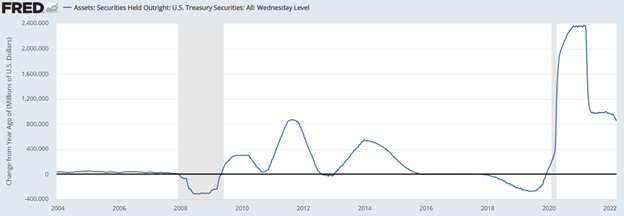
The FED is on the way to reducing its purchases of US Treasury Securities (in the secondary markets) and Mortgage-Backed Securities, but it has not yet begun to reduce the size of its balance sheet holdings.
The following graphs (from the St. Louis Fed) depict the year over year changes in purchases of Treasury Securities and Mortgage-Backed Securities on a weekly basis. The reality is that the FED is continuing to support the sale of Treasury Securities and Mortgage-Backed Securities.
Scaling back, but still buying massive amounts of securities (Treasury Securities and Mortgage-Backed Securities)

Federal Reserve Monetary Policy
The FED has three policy tools (in no particular order) at its disposal to address demand pull inflationary pressures (too many dollars chasing too few goods).
First, the FED can reduce the purchases of Treasury Securities in the secondary market and/or allow its current balances to run-off. This will put upward pressure on interest rates as the supply of securities at auction will increase (not being offset by FED purchases). This of course will result in higher interest rates, larger payments on the growing Federal Debt, and will have an even greater impact on the budget.
Secondly, the FED could increase the required reserve ratio to perhaps its previous 10% level or even higher. This would reduce excess reserves and make the FED’s job a bit easier in terms of reducing its balance sheet.
Finally, the FED could and certainly shall continue to raise its targeted Fed Funds Rate and since the interest on reserve balances (IORB) matches that targeted rate, it will move the needle pretty much immediately on the effective Fed Funds Rate. Keeping in mind that the Fed Funds Rate is really the driver for other rates, those downstream interest rates will rise as well. The net effect of that is that it will reduce borrowing by the household as consumer and it will also have the same effect on business sector as they would face higher cost of borrowing as well.
So, when Chairman Powell indicates that the FED has the tools to address the problem, he is certainly correct in terms of taking on demand pull inflation.
The FED and Cost Push Inflation
The cost push side, having to do with the cost of inputs for firms includes such things as labor (wage inflation) and energy (oil and natural gas) has driven the Producer Price Index (PPI) up to 10.0%. While the FED’s restrictive actions (driving up interest rates) would certainly impact cost push inflation, it doesn’t address the underlying problems, namely, wage pressures due to the reduced labor force participation rate, and the elevated cost of fuel due to lack of supply. The way to ease that cost push inflation really comes down to increasing the supply of labor (bringing more people back into the labor force) and cranking up domestic energy production.
The question is how did we reach this point where we have very little choice in addressing massive inflationary pressures, while at the same time trying to keep the economy from collapsing?
Going through the pandemic, the Federal government stepped in to offset the lost income with stimulus payments and a variety of other measures, including suspending student loan payments and the Paycheck Protection Program (PPP). The generous unemployment benefits also resulted in a significantly reduced workforce. In effect, what happened was that incomes were successfully preserved. People had the financial wherewithal and desire to purchase goods and services but they were just not being produced. This prompted demand inflation, where we had too many dollars chasing too few goods. Compounding that problem, we had firms trying to meet the demand for those same goods and services, but the resources required, including labor, was not readily available. In addition to the labor and other supply chain issues, energy policy changes resulted in a fall-off in domestic production crude oil and natural gas. The net result was that wages, energy, and other input prices rose significantly and the pressure continues.
Reducing supply of fossil fuels, while ramping up production?
(keep in mind that 60% of domestic electricity is produced with fossil fuels
Frequently Asked Questions (FAQs) - U.S. Energy Information Administration (EIA))


- 118,813 million cubic feet in December 2021
- 115,980 million cubic feet in February 2020
- 11.6 million barrels per day in December 2021
- 12.9 million barrels per day in February 2020
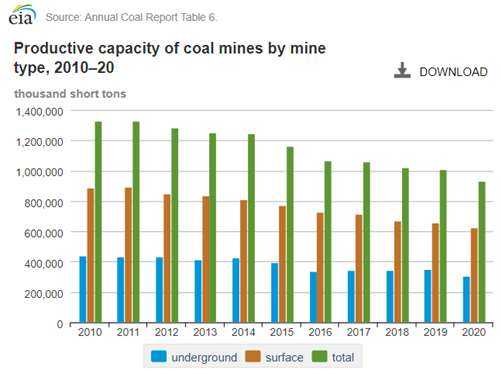
https:>>www.eia.gov>coal>annual>
Highlights for 2020
- U.S. coal production decreased 24.2% year over year to 535.4 million short tons (MMst).
- The total productive capacity of U.S. coal mines was 933 MMst, a decrease of 7.6% from the 2019 level.
Energy for use in transportation
Use of energy for transportation - U.S. Energy Information Administration (EIA)
Summary
It’s critical to understand that on the demand side, the FED actions in driving up interest rates will certainly necessary slow down the economy. The trick is for the FED to act swiftly in enacting its restrictive policy and to be prepared to reverse course just as quickly.
Simply put, on the supply side, we have to continue to get people back into the workforce and we also have to quickly expand the domestic production of energy. Reduced pressure on the supply side (cost push inflation), will certainly alleviate the price pressure on the demand side (demand pull inflation).
