August 5, 2011
For a downloadable version, click the following:
ANOTHER QUICK, YET PAINFUL WALK THROUGH EMPLOYMENT
- July 2011
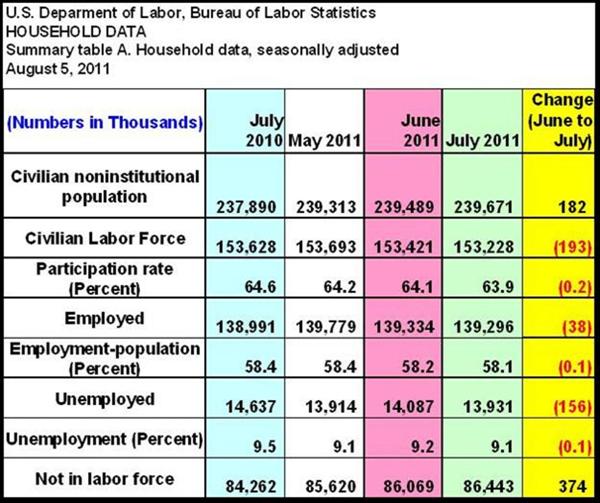
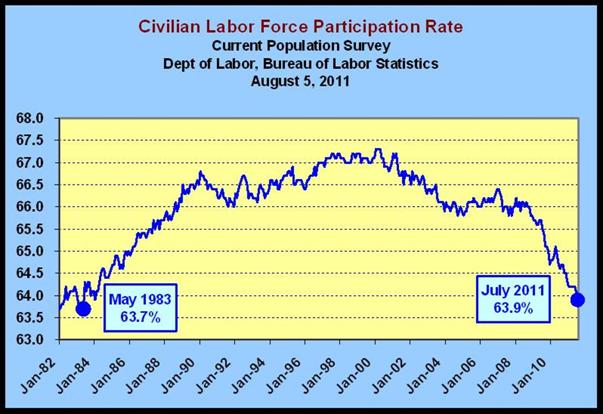
When we combine the Civilian noninstitutional population, 182,000, with those dropping out of the Civilian Labor Force 193,000, we have a massive shift of population away from the employment pool. In a typical, at least somewhat robust economy, those folks added to the Civilian noninstitutional population would flow through to the Civilian Labor Force. What we have, instead, is reflected in the 'Not in labor force' number of 374,000. The net result is that this drives down the Labor Force Participation Rate to its 28 year low of 63.9%.
At this point, the unemployment rate is virtually useless, since it only reflects those folks in the Civilian Labor Force who are either working (employed) and those who are not 'officially' classified as not working - seeking employment, the unemployed. This is a horrible, horrible situation!
The thing to key on in the months ahead is an unchanged unemployment rate…even rising a bit, as will certainly happen in the event of the encouraged worker phenonomon - when jobs become available, more individuals begin looking for work, and rise in the Labor Force Participation Rate.
Update on employment picture…
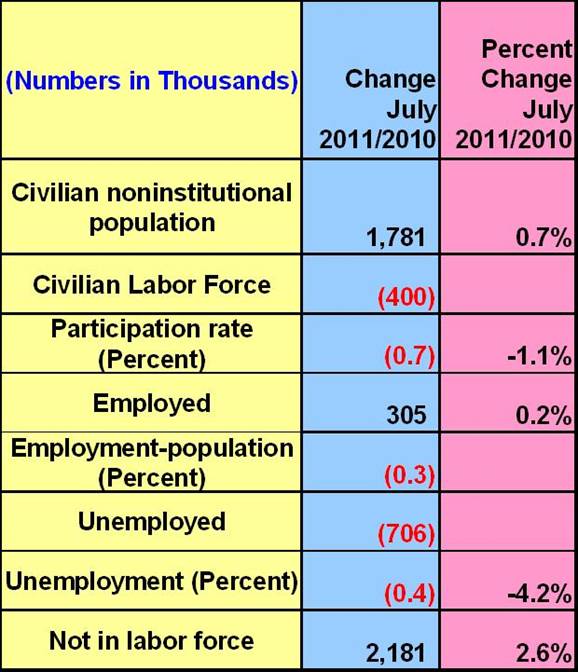
The Noninstitutional Civilian Population (Population age 16 and over) grew 182,000 last month and 1,781,000 from last year [July 2010].
The Civilian Labor Force is the subset of the Noninstitutional Civilian Population which is either ‘employed’ or unemployed. The Civilian Labor Force shrank from both last month by 193,000 and from July 2010 by 400,000.
Note: if the Civilian Labor Force had not fallen, the Unemployment Rate would have remained at 9.2%…the same as last month, June 2011.
The ‘difference’ between the Noninstitutional Civilian Population and the Civilian Labor Force consists of those people 16 years and older who are non-working individuals, whether they are retirees, spouses, or others who are NOT classified as employed, nor are they classified as unemployed. As we indicated in previous newsletters*, the Labor Force Participation Rate, which compares the Civilian Labor Force to Noninstitutional Civilian Population, was 66.2% through most of the last decade.
Feb 2011 - Unemployment
* www.econnewsletter.com/feb062011
From January 2001 through December 2008, the Labor Force Participation Rate averaged 66.2%.
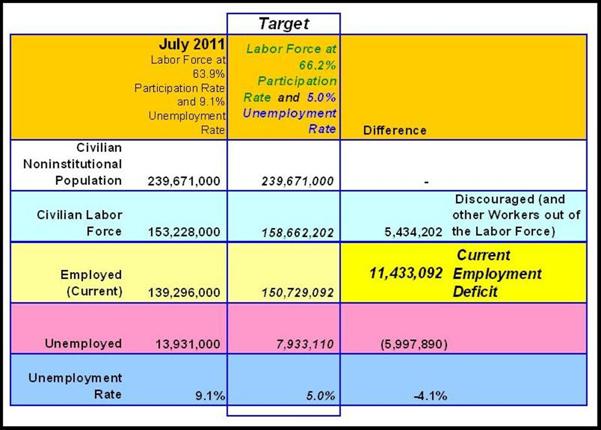
The July 2011 Labor Force Participation Rate was 63.9%. This means that 63.9% of the Noninstitutional Civilian Population, 239,671,000, was counted as being in the Civilian Labor Force of 153,228,000. Using the 66.2% (Labor Force Participation) average noted previously, this would add 5.4 million to the Civilian Labor Force. Since those people were obviously not employed, they would certainly be added to the unemployment rolls if they were seeking employment. These folks represent the ‘Discouraged (and other Workers out of the Labor Force)’, those among us who probably would be working if the economy was in better shape.
Note: the last time the Labor Force Participation Rate was below 63.9% was May 1983 when it was 63.7%.
Employment
Employment (employed) shrank last month by 38,000 and has only grown by 204,000 since July 2010.
While it seems obvious that employment growth is a requirement for recovery, there is often a confusion between the ‘employed’ numbers from the Household Survey (CPS - Current Population Survey) and the ‘jobs’ number from the Payroll Survey (CES - Current Employment Statistics, or Establishment Survey). The Household Survey covers a wider swath of the population, while the Payroll Survey provides us with a more detailed, yet smaller image of those comprising the Civilian Labor Force (including those employed and those unemployed).
In short, the Payroll Survey is a subset of the Household Survey. Employment in the Payroll Survey grew last month by 117,000 and grew by 1,258,000 since July 2010. The good news is that job growth has occurred WITHIN the Payroll Survey portion of the Employed (Household Survey), but not so good news is that it has been meager overall since the Payroll Survey is actually a subset of the Household Survey. In the Household Survey (Current Population Survey) we lost 38,000 jobs in July 2011 and only gained 305,000 jobs since July 2010.
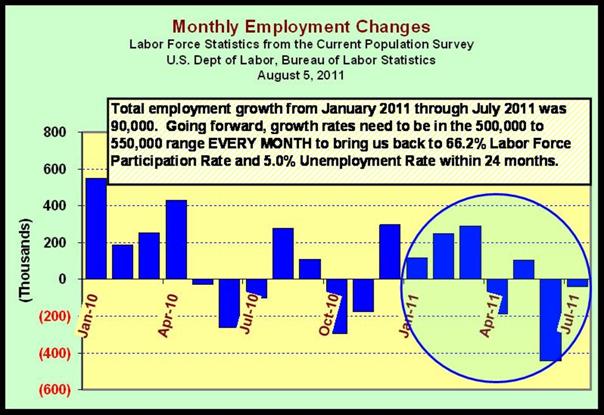
Again, as we pointed out in a previous newsletter article (Down the Rabbit Hole www.econnewsletter.com/may102011), in May 2011 we needed on the order of 525,000 jobs per month over the subsequent 2-years to reach 66.2% Labor Force Participation Rate and 5% unemployment rate, both modest goals. We’ll get to the unemployment rate shortly.
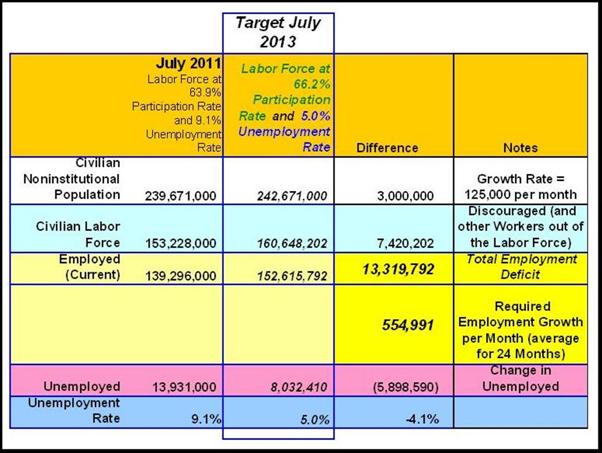
According to the more inclusive Household Survey we lost 38,000 more jobs in July, pushing that number from 525,000 per month [May 2011] to 555,000 per month [July 2011], for 24 months, to reach 66.2% Labor Force Participation Rate and 5% Unemployment Rate (allowing for an expansion in Civilian Noninstitutional Population of 125,000 per month).
That amounts to 13,320,000 jobs created over 24 months. From January 2011 to July 2011, we’ve gained 90,000 jobs…OOPS!
We cover the differences between the surveys extensively in previous newsletter articles, but keep in mind that changes in the ‘employed’ number is most important in measuring expansion or contraction since it captures self-employed, farm workers and other non-payroll type categories in addition to the traditional employees.
Unemployment June 2011
www.econnewsletter.com/jun112011
Unemployment
The last item we’ll address is unemployment. This is the term that confuses most of the public and what obfuscates the measures of unemployment from U-1 through U-6, is that the ‘Discouraged (and other Workers out of the Labor Force)’ we described previously, numbering 5.4 million (note that the estimation is based on a Labor Force Participation Rate of 66.2%). These are the folks that have given up looking for work and are therefore NOT considered in the Civilian Labor Force and for that reason are NOT, REPEAT, NOT considered unemployed.
Unemployment is simply measured by subtracting the Employed (from the Household Survey) from the Civilian Labor Force. The Unemployment Rate represents the percentage of Unemployed as compared to the Civilian Labor Force. The problems on the Unemployment side are pretty much addressed in the various measures of Unemployment, noted as follows:
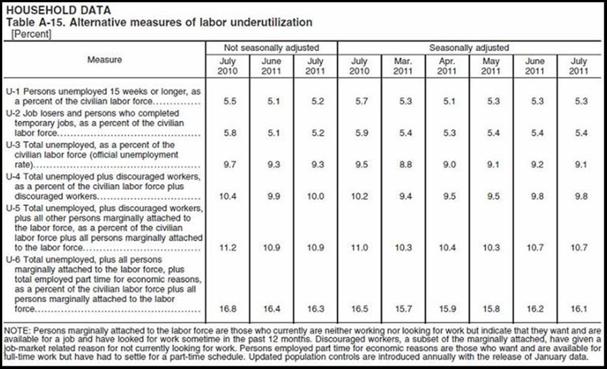
U-3 is the officially reported unemployment rate that we see every month in the media. In July 2011, it was 9.1%, lower than June’s 9.2% and lower than the 9.5% reported in July 2010. Keep in mind that the Labor Force Participation Rate was 63.9% in July 2011, while the rate was 64.6% in July 2010.
Comparing apples to apples, if the Labor Force Participation Rate was at 64.6% in July 2011, the unemployment rate would be at 10.0%, not the stated 9.1%.
Using the 66.2% Labor Force Participation Rate which was the average from 2001-2008, the U-3 unemployment rate would be 12.2%
The U-6 unemployment rate, the broadest measure of unemployment rate, captures the marginally attached, part-time, etc., and that rate dropped to 16.1%.
Again, comparing apples to apples, if the Labor Force Participation Rate was at 64.6% in July 2011, the U-6 unemployment rate would be at 17.0%.
Ratcheting up to the 66.2% Labor Force Participation Rate, the average from 2001-2008, the U-6 unemployment rate would be 19.2%
A last note on the Labor Force Participation Rate – a good reason, in our estimation, for using the higher Labor Force Participation Rate as a metric (e.g., 66.2% versus 63.9%) is to help identify and ‘count’ the unidentified discouraged individuals who we term as the very discouraged worker. The U.S. Department of Labor, Bureau of Labor Statistics, views the discouraged worker as being part of the smaller pool of Civilian Labor Force as reflected by the current 63.9% Labor Force Participation Rate in U-6, but not in U-3.
THE EMPLOYMENT SITUATION – JULY 2011
www.bls.gov/news.release/pdf/empsit.pdf
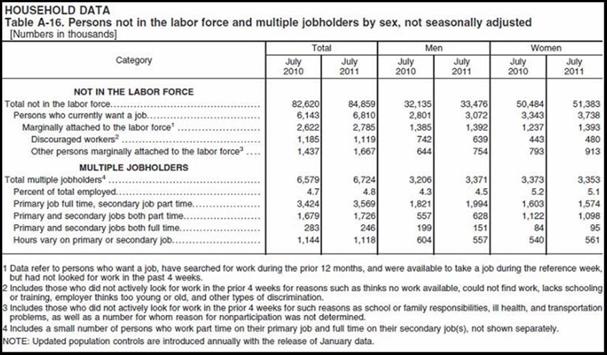
Among the marginally attached, there were 1.1 million discouraged workers in July, about the same as a year earlier. (These data are not seasonally adjusted.) Discouraged workers are persons not currently looking for work because they believe no jobs are available for them. The remaining 1.7 million persons marginally attached to the labor force in July had not searched for work in the 4 weeks preceding the survey for reasons such as school attendance or family responsibilities. (See table A-16.)
Again, when it comes right down to it, we're currently running a deficit of around 11 million jobs and we add around 125,000 (probably more like 150,000) to that total each month as our population expands. This is a situation that cannot continue to go on. These 11 million people have families and households to support. These are people who could help a housing recovery, contribute in terms of taxes and produce more of the goods and services we all need.
Unless, or until, we consistently begin to add in the neighborhood of 500,000 jobs on a monthly basis [actually, 550,000 or more] - private sector jobs that is, there will be no recovery, irrespective of political or academic pronouncements.
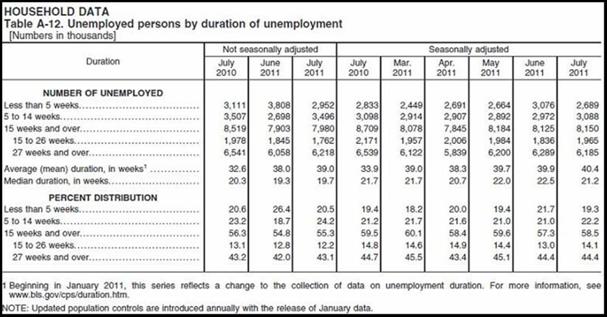
Adding to the problem, we have seen continued problems with extended duration of unemployment, note the “Average (mean) duration in weeks” for July of 40.4!