
2011 Volume Issue 6
July 1, 2011
For a downloadable version, click the following:
Après Moi, le Deluge
- attributed to Louis XV of France (1710-1774)
An impending ACCORD II?
A potential squabble brewing between the U.S. Treasury and Federal Reserve over Debt: a tale of Interest Rates and Economic Growth
History has a way of repeating itself, not in clone-like fashion, but more like genes which, when they replicate, often do so with mutations.
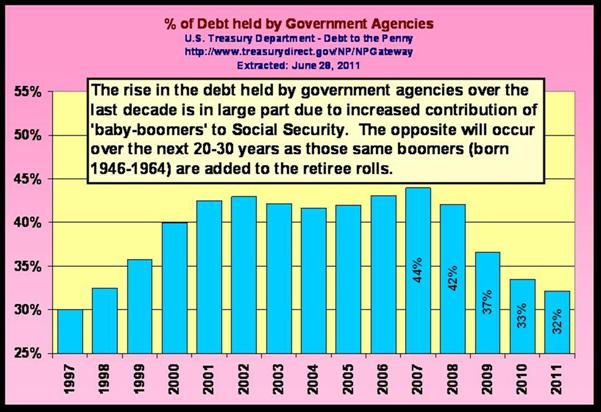
The Federal Reserve System (FED) is threatening to reduce its massive support of the exploding Federal Government debt. QE 2 [Quantitative Easing] has ended, or so the FED proclaims. That support can be seen by comparing its holdings of marketable U.S. Government and Federal Agency securities over time.
The end of QE II, impact on the Treasury market
Michael Pollaro - FORBES The Contrarian Take
The Federal Reserve’s QE II asset purchase program is ending, so the Federal Reserve says, at the end of June. As a result, a very large bid is about to exit the U.S. Treasury market, with some even warning of a spike in interest rates on the U.S. government’s notes and bonds.
Chairman Bernanke’s Press Conference
June 22, 2011
www.federalreserve.gov/mediacenter/files/FOMC.pdf
The Committee’s planned purchases of $600 billion of longer-term Treasury securities will be completed by the end of this month, and the Committee will continue to reinvest principal payments from its securities holdings going forward.
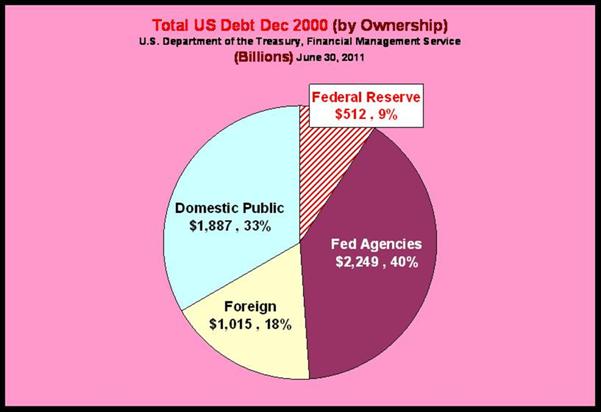
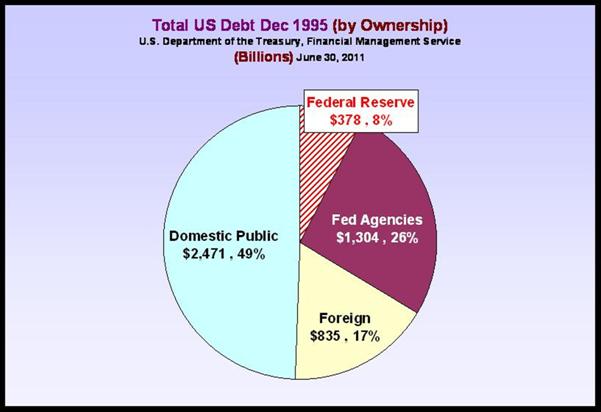
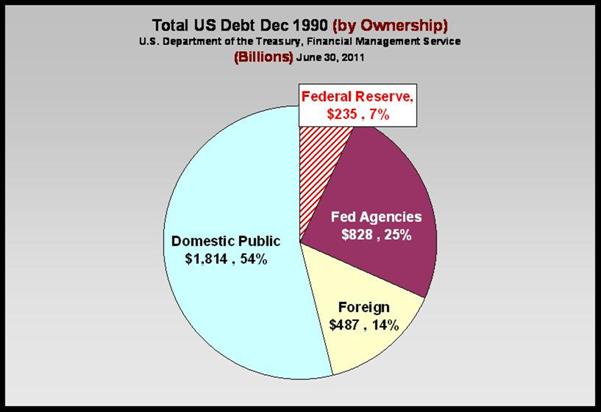
Let’s take a look at the Ownership of the Debt…most current and then looking back
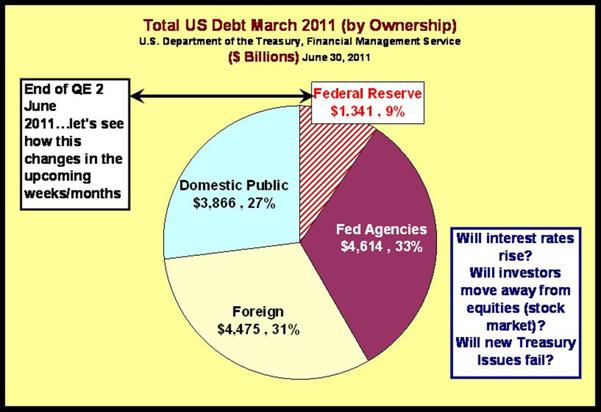
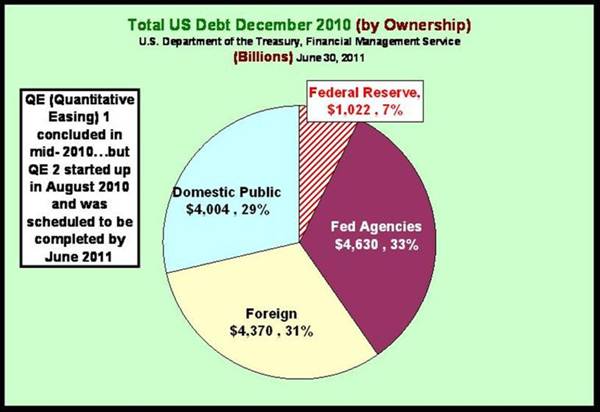
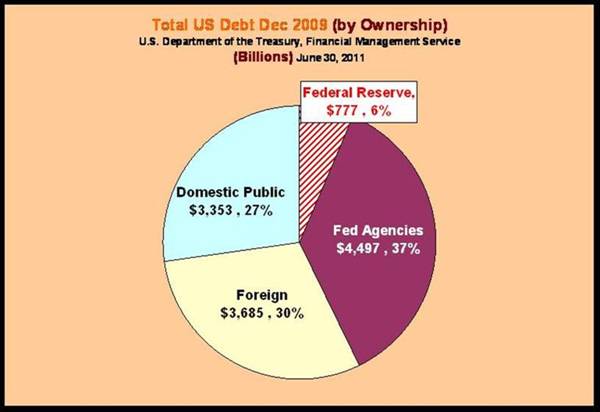
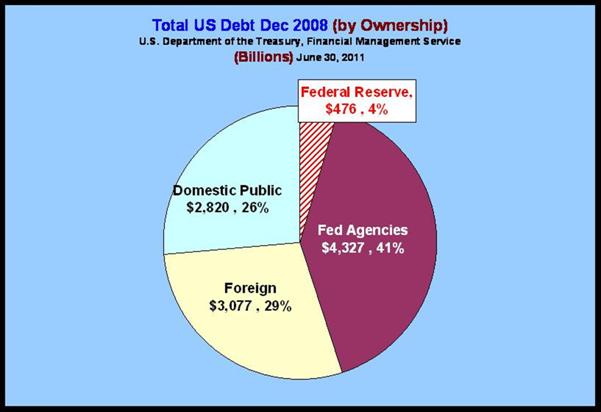
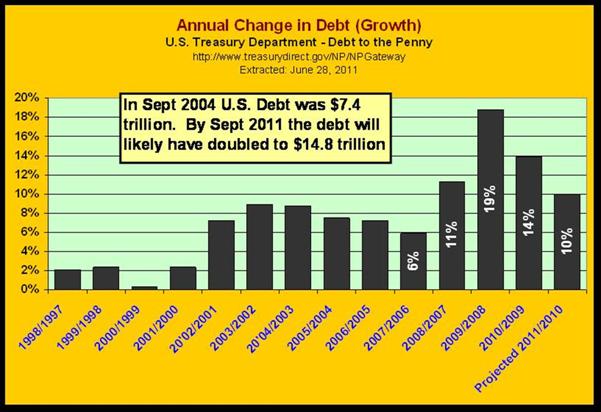
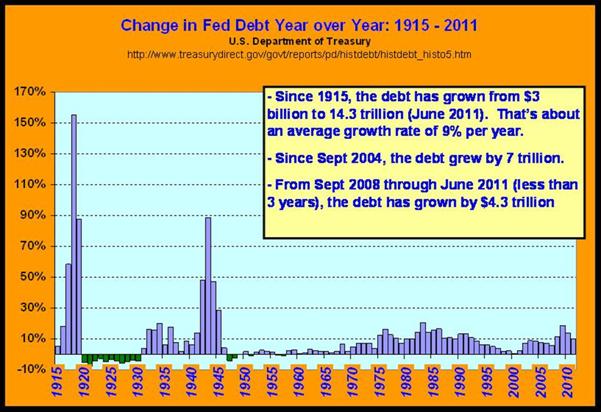
Back to the story…the overall debt and how it has changed/grown.
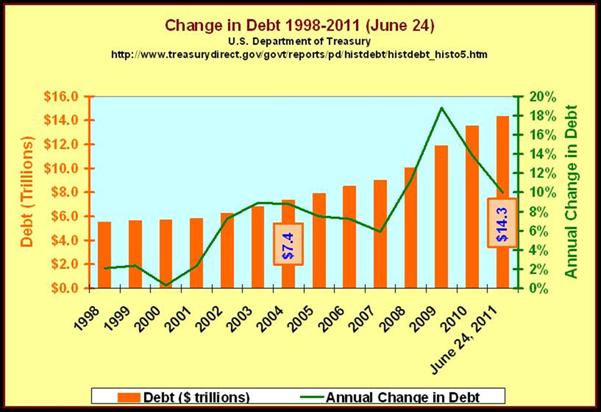
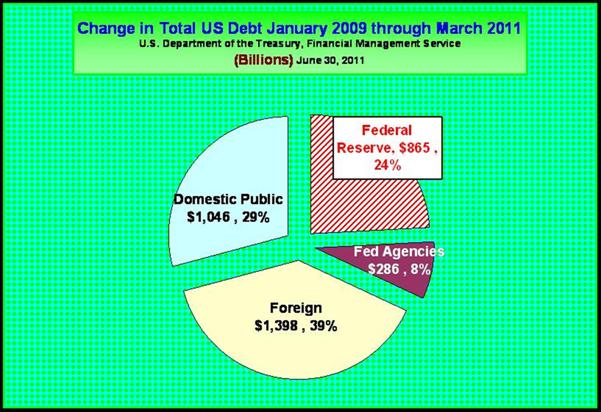
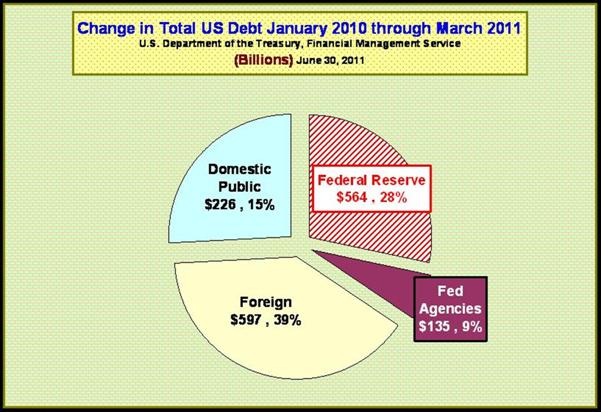
A more recent look at the data, focusing on the net change in Total Debt from December 31, 2008 through March 31, 2011 and from December 31, 2009 through March 31, 2011 reveals:
- The extent of the Fed’s impact with QE 1 and QE 2
- The more than doubling of the foreign position in purchasing that debt
- The fall-off in Government Agency purchases, as they have begun to draw down on the Social Security Fund (along with other Trust Funds), due to increased retirements and persistently high unemployment.
- Domestic buyers have turned away from debt, due to the low interest rates. This is reflected in the rising stock market, etc.
The question, again, is what happens when the Fed backs off on its buying spree when QE 2 concludes – today?!!!
With three more months to go in the fiscal year, and deficits continuing to grow at least $150 billion per month, who is going to pick up the slack left by the Fed. While Bernanke has made it clear that the Fed will maintain its position, the Treasury will have to issue new debt to make up for the portions that are expiring and to cover the continued deficits.
Once again, back to the story…
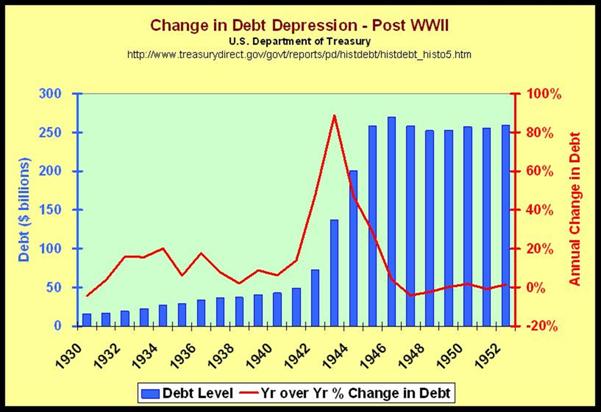
Some sixty years ago, in 1951, there occurred what has come to be called, the Treasury-Fed Accord.
en.wikipedia.org/wiki/1951_Accord
The Treasury-Fed Accord:
www.richmondfed.org/publications/research/economic_quarterly/hetzel.pdf
The Federal Reserve (FED) was extricating itself from U.S. Treasury pressures to keep interest on the Federal Government debt relatively low. In this case, a combination of Great Depression deficits and equally large WWII deficits ballooned the Federal Government debt from $17 billion before the Great Depression in 1929 to $269 billion dollars at the end of WWII.
By today’s standards, this seems like ‘chump change’.
Déjà vu…
It is painfully amusing that one of the rating agencies, which is one of a group that vastly overrated the credit quality of collateralized debt obligations (CDOs) including mortgage backed securities (MBSs), which in turn was a major cause of the financial fiasco of 2008 that continues to this day, has recently downgraded U.S. Government debt.
---U.S. Warned on Debt Load---
S&P (Standard and Poors) Signals Top Credit Rating Is in Danger, Stoking Political Battle on Deficit
…and let’s not forget Moody’s
www.foxbusiness.com/markets/moodys-threat-us-downgrade-departure-from-sps-warning
The Financial Fiasco of Two-Thousand Eight (FFTTE)
www.econnewsletter.com/jan022009
Back when the humongous multitude of CDOs (Collateralized Debt Obligations) was being manufactured by the investment banking gang (while the myriad of regulatory personnel seemed non-existent/non-interested) and generating huge incomes for this gang, these same securities – of which many would soon be in default, were given high marks by the rating agencies, also driven by the desire to garner abundant fees. The impression given by the rating agencies was that these securities were as good as those of the federal government. Was that because at the time the federal debt of the U.S. government was low in risk or was it because these rating agencies foresaw the eventual need to downgrade the credit ratings of the debt of the U.S. Government?
What a mess!
As the melt down of the U.S. financial system and the economy was occurring, analogous to the nuclear fiasco now occurring in Japan, the Federal Reserve System began buying the apparent junk that others no longer wanted to hold. When the Federal Government began to exercise the grandfather of all bailouts, from Fannie Mae and AIG to General Motors, and the government spent literally hundreds of billions for a variety of handouts to political supporters of the correct persuasion such as labor unions (awarded the stock of GM and Chrysler even though they were a major cause of the bankruptcy) and various financial interests. With a few exceptions, the perpetrators were left with their riches and very few indictments have come forth; this has become the amnesty of all amnesties.
As Charles Hugh Smith in a Daily Finance article of several weeks ago commented, the Federal deficits have risen from just under one half of a trillion dollars to one and on half trillion dollars. The only perceptible benefit of this trillion dollar increase in the federal deficit was to maintain the pre-existing status quo or those ‘too big too fail’. Was this the change we were promised by the victors in the election of 2008? Did the promised changes include not passing a budget for the federal government for the last two years?
FYI – the federal [budget] fiscal year used to run from July 1 – June 30 of the following year. This was the case until 1976, when Congress failed to pass a budget in a timely manner and the federal fiscal year moved from October 1 – September 30 of the following year.
U.S. Fiscal Year
In his article, Smith pointed out that the ANNUAL federal government budgetary deficit has INCREASED by one trillion dollars, i.e., $1,000,000,000,000 for each of the years 2007 to 2010 compared to an annual average of four-hundred thirty billion, i.e. $430,000,000,000 for each of the years 2004 to 2007. He concluded that all we received for it – and ever will receive for it, is the status quo (for those ‘too big to fail and not for those too small to care about’) we had before the humongous increase in the federal budgetary deficits (totaling $3.2 trillion dollars from calendar year 2008 through the end of calendar year 2010).
That is to say, he was referring to a ‘status quo’ in terms of the financial aspects of the economy, not in terms of the employment picture, home values, or even economic growth.
What Are We Getting for an Extra $1 Trillion in Federal Spending?
02/28/11
www.dailyfinance.com/story/what-are-we-getting-for-an-extra-1-trillion-in-federal-spending
Let’s consider the composition of the Federal debt and estimate the enormous burden of refinancing the existing federal government debt and the additional annual deficits. The marketable portion of which Standard and Poor recently downgraded is about 70% [$9.7 trillion of $14.3 trillion total] of that debt in the forms of Treasury bills, notes and bonds.
06/24/2011
- Current Debt Held by the Public $9,739,123,756,154
- Intra-governmental Holdings $4,605,368,034,979
- Total Public Debt Outstanding $14,344,491,791,133
Try counting by ones until you reach this number. By that time it will be tens if not hundreds of billions of dollars greater. For the faint hearted, try counting by tens or, one-hundreds, or even thousands. You may breathe your last breath well before you reach the amount it will be by then.
The average maturity of these securities is 4.9 years.
U.S. Department of Treasury
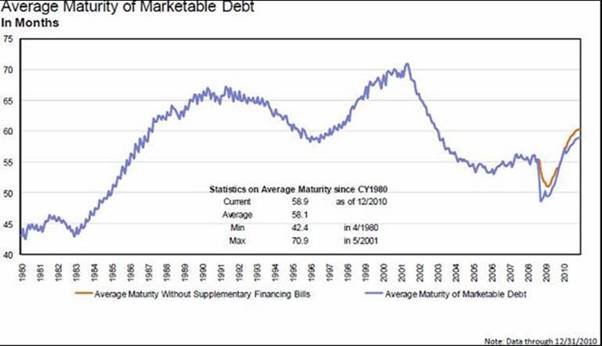
With a $14.3 trillion debt (of which about $9.7 trillion is marketable), given the average maturity of 4.9 years, this means that $2.0 trillion must be refinanced each year or about $38 billion each week.
In addition to this sum the current projected annual deficit of $1.3 trillion must also be financed. The marketable portion is around $890 billion or around $17 billion per week. This means that the yearly sum to be auctioned is about $ 3.3 trillion and the weekly auctions of marketable federal debt are about $63.5 billion or $63,462,000,000 PER WEEK.
To provide some perspective, the State of Florida’s ANNUAL operating budget was $62.4 billion in 2009-2010 (http://www.transparencyflorida.gov/OBReportPA.aspx).
www.transparencyflorida.gov/OBReportPA.aspx
The problem does not end here. Around one-third of the federal debt has been of the non-marketable type, most of which was issued to the trust funds administered by the federal government, the largest being the social security trust fund. Until the current economic downturn we are experiencing, a considerable inflow of social security payroll taxes far outpaced the benefits paid out.
US Department of Treasury (Bureau of Public Debt)
MONTHLY STATEMENT OF THE PUBLIC DEBT
OF THE UNITED STATES
MAY 31, 2011
www.treasurydirect.gov/govt/reports/pd/mspd/2011/opdm052011.pdf
- Total Intra-governmental Holdings = $4.6 trillion
- Drawn down $609 billion total from various trust funds
- $2.5 trillion Social Security Trust Fund (Federal Old-Age and Survivors Insurance Trust Fund) – drawn down $188 billion
- $741 billion Federal Employees Pension Fund (Civil Service Retirement and Disability Fund, Office of Personnel) – drawn down $77 billion
- $335 billion Military Pension Fund (Department of Defense Military Retirement Fund) – drawn down $1.0 billion
- $261 billion Medicare (Federal Hospital Insurance Trust Fund) – drawn down $99 billion
- $170 billion Disability Insurance (Federal Disability Insurance Trust Fund) – drawn down $43 billion
- $162 billion Military Medicare (Department of Defense, Medicare Eligible Retiree Fund) – drawn down $0 billion
- $78 billion Medicaid (Federal Supplementary Medical Insurance Trust Fund) – drawn down $106 billion
- $24 billion Unemployment Trust Fund – drawn down $67 billion
- $15 billion Pension Benefit Guaranty Corporation – drawn down $11 billion
U.S. Department of Treasury
Schedules of Federal Debt (May 31, 2011)
Managed by the Bureau of the Public Debt
www.treasurydirect.gov/govt/reports/pd/feddebt/feddebt_may2011.pdf
Perhaps a bit of good news is that the current average interest rate on the marketable debt ($9.7 trillion) is under 2.5% and the non-marketable debt $4.6 trillion) is around 4%
On the other hand, the employment picture continues to present problems that only serve to exacerbate issues with the unemployment trust fund and the Social Security Trust Funds, including the disability component.
DIGGING DEEPER INTO THE DETAILS OF THE DAUNTING JUNGLE OF UNEMPLOYMENT STATISTICS
www.econnewsletter.com/jun112011
U.S. Department of Labor, Bureau of Labor Statistics (www.bls.gov/news.release/empsit.t15.htm)
U-6 Unemployment Rate at 15.8%, while the U-3 (official) rate was at 9.1%
U-6 the unemployment rate reflecting underemployment (working at jobs you are overqualified for, working part-time when you would rather work full-time, etc.)
U-3 Total unemployed, as a percent of the civilian labor force (official unemployment rate)
Labor Force Participation Rate (the Labor Force as a percent of the Civilian Noninstitutional Population) down…
For example, the current Labor Force Participation Rate is 64.2%, while the average Labor Force Participation Rate from 2001-2008 was 66.2%
Again, putting things into perspective…525,000 jobs per month - we are no where near that number - and there is no reason to think we will be any time soon.
www.econnewsletter.com/jun112011
As we pointed out in a previous newsletter article (Down the Rabbit Hole www.econnewsletter.com/may102011), we need on the order of 525,000 jobs per month over the next 2-years to reach 64.2% Labor Force Participation Rate and 5% unemployment, both modest goals.
These ongoing problems with unemployment have seriously reduced Social Security taxes paid in while precipitous rise in early retirements and permanent disability status have increased the outflows. This has caused the social security system to liquidate some of their holdings of U.S. Government non-marketable type and has added to the financing needs of the federal government thru the marketable security route. The Social Security System was already expected to see its cash flow become a deficit by 2017, but those deficits have already started. The current economic malaise has ratcheted forward the problem by several years.
FYI – Social Security actually moves into deficit territory (benefits exceed contributions) in 2010. This is at least five years earlier than previously anticipated, due to the economic downturn; five hundred-thousand more people opted into social security in 2009
‘The nation’s financial system burns while President Obama and the Senate fiddle’, to paraphrase a long-standing adage.
Stand aside Greece, Portugal, Ireland, Italy, Spain, etc.; the grandfather of all sovereign risks, ‘the Big Daddy’- the United States of America is entering the arena of financial insanity.
Understand that the huge supply of Federal Government marketable securities puts tremendous downward pressure on the prices of these securities and therefore also puts tremendous upward pressure on the interest rates in these markets.
Several things occur as a result. As interest rates rise on these securities, the prices of existing or outstanding similar securities fall. This is the inverse relationship of interest rates to security prices phenomenon and the essence of that little understood interest rate risk. Depending upon how much the interest rates rise, there will tend to be a rise in all other interest rates as arbitrage forces go to work. These arbitrage forces include a tendency to move from equity (including the stock market) to debt holdings. This would put downward pressure on stock prices to increase in order to increase their yields to compete with rising yields on debt securities.
This will in turn tend to weaken the demand for goods such as housing that are interest rate sensitive and, as a result, reduce overall aggregate demand. It will be a test for those who have been yelling that the interest rates are too low. The real question is how long before basic market forces, without the FED and U.S. government intervention, will take to bring about normality. Such ‘normality’ has been absent for nearly four years already.
The President and Congress had better realize that these events will quickly reveal themselves if the FED really begins to embark on ACCORD II as QE 2 comes to an end on June 30, 2011.
If ACCORD II comes along, the current 2.5 - 4.5% rates on the U.S. Federal debt will rise significantly. Rather than the current (May 2011) monthly amount of $30.9 billion, that number could easily double, driving up our annual interest on the debt toward the $1 trillion level. If this were to happen, we could be heading for default territory…this is sovereign risk, folks!
Who will bail us out?
Not the IMF…the U.S. kicks in nearly 18%…we can't very well bail when we are doing the bailing…
www.imf.org/external/np/sec/memdir/members.aspx
Connect the dots my friends!
