
July 10, 2011
For a downloadable version, click the following:
DECEPTION OF PERCEPTION: THE LATEST REPORT ON UNEMPLOYMENT (June 2011)
Worries Grow Over Jobs
July 9, 2011 Wall Street Journal
“Every major component of the report was weak,” said Bank of America-Merrill Lynch economist Ethan Harris. “That doesn’t happen very often – usually there’s some little ray of hope. The only silver lining is it might motivate Washington to get its act together.”
Why don’t people feel better about the economy? …after all, the National Bureau of Economic Research membership voted and declared the recession was over in June 2009…happy anniversary!
NBER December 2007 to June 2009
www.nber.org/cycles/sept2010.pdf
The Department of Labor reported July 8, 2011 that the unemployment picture had hardly changed of late.
Statement of Keith Hall, Commissioner Bureau of Labor Statistics
www.bls.gov/news.release/jec.nr0.htm
In summary, nonfarm payroll employment in June was essentially unchanged for the second consecutive month. The unemployment rate, at 9.2 percent, was 0.4 percentage point higher than in March.
The president has spoken repeatedly of the ongoing recovery and how it always seemed to be on the verge of improving…not so much, of late.
President Obama on June Job Numbers
www.whitehouse.gov/photos-and-video/video/2011/07/08/president-obama-june-job-numbers
June 11, 2010 Weekly Radio Address
m.whitehouse.gov/the-press-office/2011/06/11/weekly-address
Obama: Economic recovery is 'going to take time'
Darlene Superville – AP
Broken Link www.marionstar.com/article/Obama-Economic-recovery-going-take-time
No president since World War II has won a second term with a jobless rate above 7.2%.
So much for the commentating, pronouncement making, myth-making, etc., let’s look at the real picture on jobs and job growth or the lack thereof.
The Noninstitutional Civilian Population (age 16 and over) grew from both last month and last year by 176,000 and 1,799,000, respectively.
The Civilian Labor Force is the subset of the Noninstitutional Civilian Population which is either ‘employed’ or unemployed. The Civilian Labor Force shrank from both last month and last year by 272,000 and 263,000, respectively.
The ‘difference’ between the Noninstitutional Civilian Population and the Civilian Labor Force consists of those people 16 years and older who are non-working individuals, whether they are retirees, spouses, or others who are NOT classified as employed, nor are they classified as unemployed. As we indicated in previous newsletters*, the Labor Force Participation Rate, which compares the Civilian Labor Force to Noninstitutional Civilian Population, was 66.2% through most of the last decade.
Feb 2011 - Unemployment
* www.econnewsletter.com/feb062011
From January 2001 through December 2008, the Labor Force Participation Rate averaged 66.2%.
The June 2011 Labor Force Participation Rate was 64.1%. This means that 64.1% of the Noninstitutional Civilian Population, 239,489,000, was counted as being in the Civilian Labor Force of 153,421,000. Using the 66.2% (Labor Force Participation) average noted previously, this would add 5,121,000 to the Civilian Labor Force.
Since those people were obviously not employed, they would certainly be added to the unemployment rolls if they were seeking employment. These folks represent the ‘discouraged workers’, those among us who probably would be working if the economy was in better shape.
Next on the hit parade are the Employed workers. Employment (employed) shrank last month by 445,000 and has only grown by 242,000 since June 2010.
While it seems obvious that employment growth is a requirement for recovery, there is often a confusion between the ‘employed’ numbers from the Household Survey and the ‘jobs’ number from the Payroll Survey. The Household Survey covers a wider swath of the population, while the Payroll Survey provides us with a more detailed, yet smaller image of those comprising the Civilian Labor Force (including those employed and those unemployed).
In short, the Payroll Survey is a subset of the Household Survey. Employment in the Payroll Survey grew last month by 18,000 and grew by 1,036,000 since June 2010. The good news is that job growth has occurred WITHIN the Payroll Survey portion of the Employed (Household Survey), but it has been meager overall. More importantly, it seems to be on the verge of collapsing.
Again, As we pointed out in a previous newsletter article (Down the Rabbit Hole www.econnewsletter.com/may102011), we need on the order of 525,000 jobs per month over the next 2-years to reach 66.2% Labor Force Participation Rate and 5% unemployment rate, both modest goals. We’ll get to the unemployment rate shortly.
Note that we lost 445,000 more jobs in June, pushing that number from 525,000 per month to 560,000 per month to reach 66.2% Labor Force Participation Rate and 5% Unemployment Rate (allowing for an expansion in Civilian Noninstitutional Population of 150,000 per month). That amounts to 13,545,000 jobs created over 24 months. Since January 2011, we gained 11,000 jobs…OMG (oh, my goodness)!
We cover the differences between the surveys extensively in previous newsletter articles, but keep in mind that changes in the ‘employed’ number is most important in measuring expansion or contraction since it captures self-employed, farm workers and other non-payroll type categories in addition to the traditional employees.
Unemployment June 2011
www.econnewsletter.com/jun112011
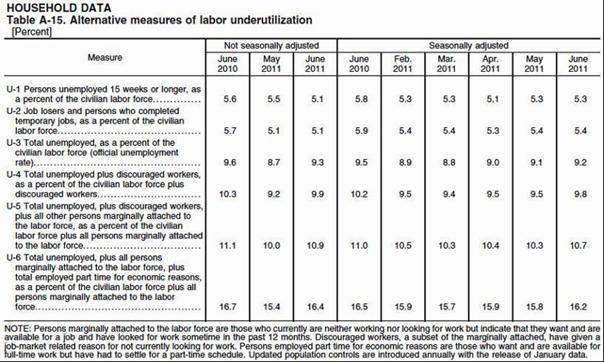
The last item we’ll address is Unemployment. This is the term that confuses most of the public and what obfuscates the measures of unemployment from U-1 through U-6, is that the ‘discouraged workers’ we described previously, numbering 5.1 million (note that the estimation is based on a Labor Force Participation Rate of 66.2%). These are the folks that have given up looking for work and are therefore NOT considered in the Civilian Labor Force and for that reason are NOT, REPEAT, NOT considered unemployed.
Unemployment is simply measured by subtracting the Employed (from the Household Survey) from the Civilian Labor Force. The Unemployment Rate represents the percentage of Unemployed as compared to the Civilian Labor Force. The problems on the Unemployment side are pretty much addressed in the various measures of Unemployment, noted as follows:
U-3 is the officially reported unemployment rate that we see every month in the media. In June 2011, it was 9.2%, higher than May’s 9.1% and lower than the 9.5% reported in June 2010. Keep in mind that the Labor Force Participation Rate was 64.1% in June 2011, while the rate was 65.1% in June 2010.
Comparing apples to apples, if the Labor Force Participation Rate was at 65.1% in June 2011, the unemployment rate would be at 10.3%---wow!
Using the 66.2% Labor Force Participation Rate that was the average from 2001-2008, the U-3 unemployment rate would be 12.1%
The U-6 unemployment rate, the broadest measure of unemployment, captures the marginally attached, part-time, etc., and that rate rose to 16.2%.
Again, comparing apples to apples, if the Labor Force Participation Rate was at 65.1% in June 2011, the U-6 unemployment rate would be at 17.3%.
Ratcheting up to the 66.2% Labor Force Participation Rate, the average from 2001-2008, the U-6 unemployment rate would be 19.1%
A last note on the Labor Force Participation Rate – a good reason, in our estimation, for using the higher Labor Force Participation Rate as a metric (66.2% versus 64.1%) is to help further identify and ‘count’ the discouraged [worker] and what we term as the very discouraged worker. The U.S. Department of Labor, Bureau of Labor Statistics, views the discouraged worker as being part of the smaller pool of Civilian Labor Force as reflected by the current 64.1% Labor Force Participation Rate in U-6, but not in U-3.
www.bls.gov/news.release/pdf/empsit.pdf
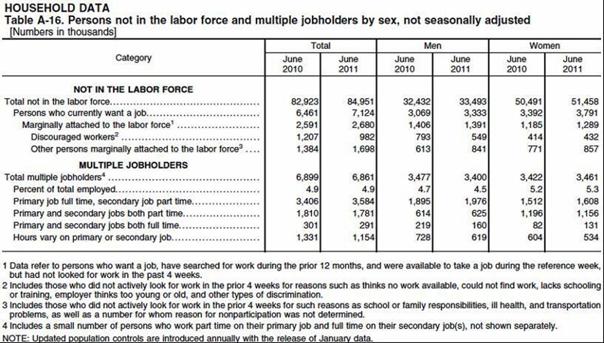
Among the marginally attached, there were 982,000 discouraged workers in June, down by 225,000 from a year earlier. (These data are not seasonally adjusted.) Discouraged workers are persons not currently looking for work because they believe no jobs are available for them. The remaining 1.7 million persons marginally attached to the labor force in June had not searched for work in the 4 weeks preceding the survey for reasons such as school attendance or family responsibilities. (See table A-16.)
Keep in mind, that at the end of the day, we're currently DOWN by around 10 million jobs and we adding on the order of 150,000 to that total each month as our population expands. If we want a return to economic prosperity, these high levels of unemployment cannot continue.
These 10 million people, have families and households to support. These are people who could help a housing recovery, contribute in terms of taxes and produce more of the goods and services we all need.
Unless, or until, we consistently begin to add in the neighborhood of 500,000 jobs on a monthly basis [actually, 550,000 or more] - private sector jobs that is, there will be no recovery, irrespective of political or academic pronouncements.
On a topic we will be going into in greater detail soon, baby-boomers (born 1946 - 1964) are beginning to retire; some at age 65, but many of them at much younger ages. The inherent problem with people retiring, even at 65, is that many of those people will live for another 20-25 years. The increased longevity is a wonderful thing (we're all for it!!!), but it has to be supported. There's no reason why people shouldn't continue to work well into their 'golden years'. It's all a matter of matching people with the suitable job.
On a related topic, we will also delve into other related issues. For instance, we will discuss redistribution of income and redistribution of wealth, and how they relate to economic growth. We'll go into private sector, market oriented options, and government's role in the process of driving the distribution(s) to more equitable levels.
