September 3, 2011
For a downloadable version, click the following:
AUGUST EMPLOYMENT REPORT --- MAKING SAUSAGE ON LABOR DAY WEEKEND
How many jobs are we really down?
- In a robust economy, the Labor Force Participation Rate should be around 66.2% (currently at 64.0%)
- Unemployment Rate should be in the 5.0% range (currently at 9.1% U-3)
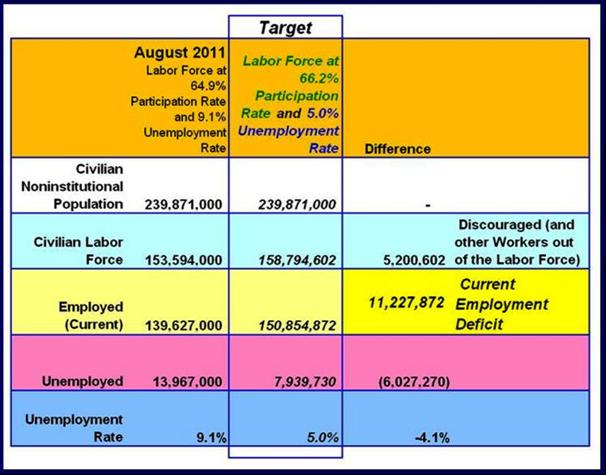
Civilian Noninstitutional Population is 239,871,000 and will likely continue to grow at a 200,000 per month clip over the next few years. From 2001 to 2011, the Civilian Noninstitutional Population growth averaged 204,000 per month.
The Current Civilian Labor Force is at 153,594,000 (at the current Labor Force Participation Rate of 64%), but would be at 158,795,000 if the Labor Force Participation Rate was at 66.2%. The difference is 5.2 million between the two participation rates. The 5.2 million equates to the people who should and would be in the Labor Force if the participation rate was 66.2%.
With the Unemployment Rate currently at 9.1%, this amounts to nearly 14 million unemployed. Since the Unemployment Rate is merely the percentage of the Labor Force (which equals the employed + unemployed) that is unemployed, then if the Labor Force Participation Rate was at 66.2%, which would drive the Labor Force up to nearly 159 million, the 9.1% unemployment rate would push the unemployment up to nearly 14.5 million. If the unemployment rate was at the targeted 5.0%, this would lower the unemployed number to 7.9 million, dropping the unemployed by around 6 million.
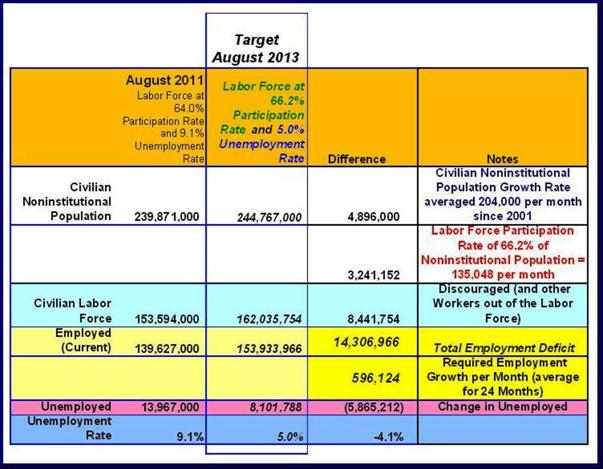
If we take the 5.2 million from the targeted Labor Force Participation Rate of 66.2%, and combine it with the 6 million reduction from adjusting the unemployment rate from 9.1% to 5.0%, we have current “Employment Deficit” of 11.2 million. Projecting a 24-month adjustment period, with around 3.2 million adds (200,000 new entrants per month Noninstitutional Civilian Population, based on 204,000 average monthly adds from 2001-2011) to the Civilian Labor Force, 132,000 per month; this brings us to 14.3 million jobs to be grown in the economy in that two-year window (596,000 jobs per month).
The thing to key on in the months ahead is a rising Labor Force Participation Rate, which reflects encouraged workers (at least a recognition by the labor force that the economy and prospects for employment are improving); and that the unemployment rate will likely remain high, also reflecting an encouraged worker effect. So long as we see adequate job growth in the Household Survey (and eventually the pass-through to the Payroll Survey) the employment situation will improve.
Bottom Line --- Objective
Household Survey (Targeting 66.2% Labor Force Participation Rate and a 5.0% Unemployment Rate)
596,000 jobs added per month in the Household Survey over 2 years would be amazing, but anything more than 200,000 per month would reflect at least some improvement. The last time the U.S. experienced 220,000 sustained monthly employment growth was from 1983 to 1989. In order to accomplish a similar feat, we would have to grow in the neighborhood of 265,000 per month for 7 years. For each monthly shortfall from this figure, the [monthly] target rate for the coming period increases. We leave it to the reader to calculate the needed new jobs each month, based on the assumption that the economy has to absorb at least 130,000 new entrants every month. Remember that those new entrants make this exercise a moving target.
Update on employment picture…
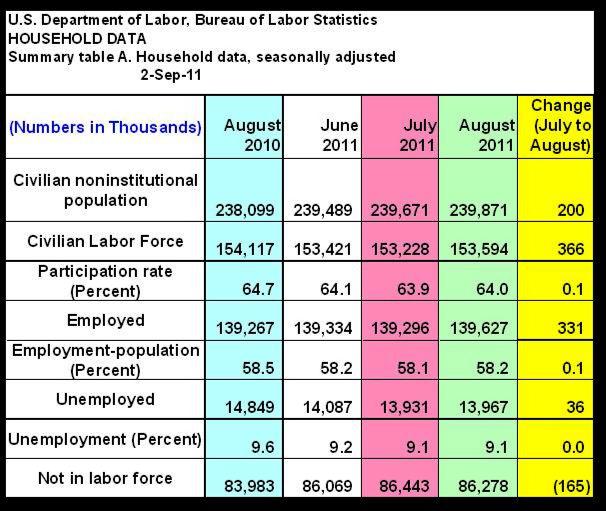
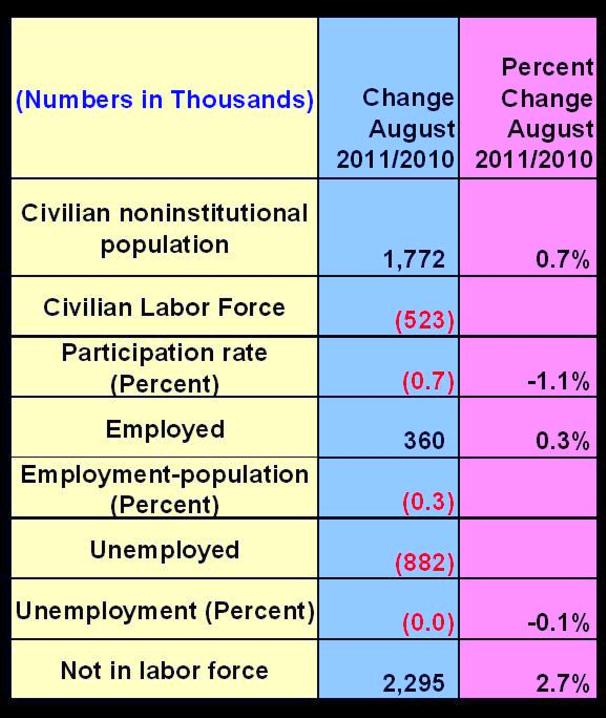
The Noninstitutional Civilian Population (Population age 16 and over) grew 200,000 last month and 1,772,000 from last year.
The Civilian Labor Force is the subset of the Noninstitutional Civilian Population which is either ‘employed’ or unemployed. The Civilian Labor Force grew last month by 366,000, but shrank from August 2010 by 523,000.
Note: the expansion of the Civilian Labor Force improved the Labor Force Participation Rate by 0.1%. The Unemployment Rate remained the same due to the encouraged job searchers moving back into the Civilian Labor Force.
The ‘difference’ between the Noninstitutional Civilian Population and the Civilian Labor Force consists of those people 16 years and older who are non-working individuals, whether they are retirees, spouses, or others who are NOT classified as employed, nor are they classified as unemployed. As we indicated in previous newsletters*, the Labor Force Participation Rate, which compares the Civilian Labor Force to Noninstitutional Civilian Population, was 66.2% through most of the last decade.
Feb 2011 - Unemployment
* www.econnewsletter.com/feb062011
From January 2001 through December 2008, the Labor Force Participation Rate averaged 66.2%.
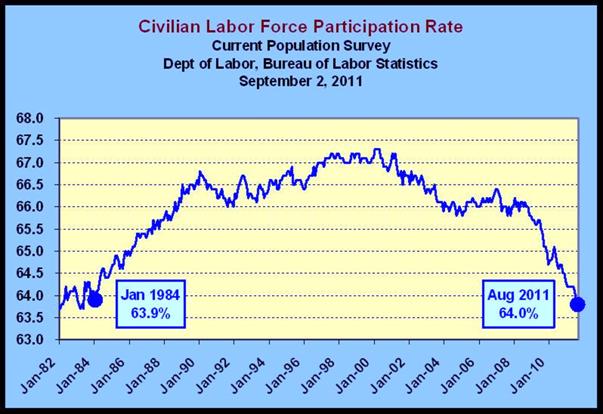
The August 2011 Labor Force Participation Rate was 64.0%. This means that 64.0% of the Noninstitutional Civilian Population, 239,871,000, was counted as being in the Civilian Labor Force -- or 153,594,000. Using the 66.2% (Labor Force Participation) average noted previously, this would add 5.2 million to the Civilian Labor Force. Since those people were obviously not employed, they would certainly be added to the unemployment rolls if they were seeking employment. These folks represent the ‘Discouraged (and other Workers out of the Labor Force)’, those among us who probably would be working if the economy was in better shape.
Note: the last time the Labor Force Participation Rate was below 64.0% was January 1984 when it was 63.9%.
Employment
Employment (employed) grew last month by 331,000 and has grown by only 360,000 since August 2010.
While it seems obvious that employment growth is a requirement for recovery, there is often a confusion between the ‘employed’ numbers from the Household Survey and the ‘jobs’ number from the Payroll Survey. The Household Survey covers a wider swath of the population, while the Payroll Survey provides us with a more detailed, yet smaller image of those comprising the Civilian Labor Force (including those employed and those unemployed).
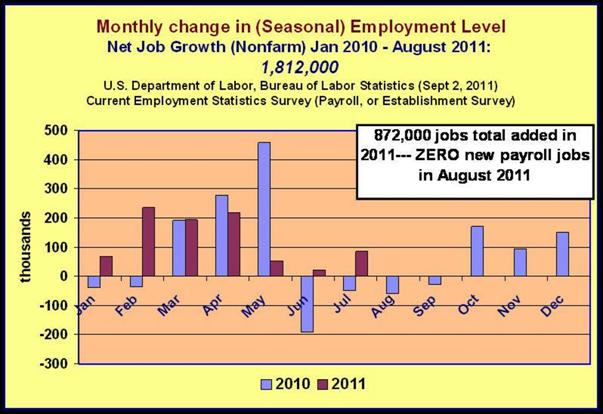
In short, the Payroll Survey is a subset of the Household Survey. Employment in the Payroll Survey was ZERO last month and grew by 1,259,000 since August 2010. Again, while the more inclusive Household Survey (Current Population Survey) gained 331,000 jobs in August 2011 it only showed 360,000 jobs added since August 2010.
Household Survey Employed
- August 2010
- 139,267,000
- August 2011
- 139,627,000
Payroll Survey Employed
- August 2010
- 129,624,000
- August 2011
- 131,132,000
Again, As we pointed out in a previous newsletter article (Down the Rabbit Hole www.econnewsletter.com/may102011), in May 2011 we needed on the order of 525,000 jobs per month over the subsequent 2-years to reach 66.2% Labor Force Participation Rate and 5% unemployment rate, both modest goals. We’ll get to the unemployment rate shortly.
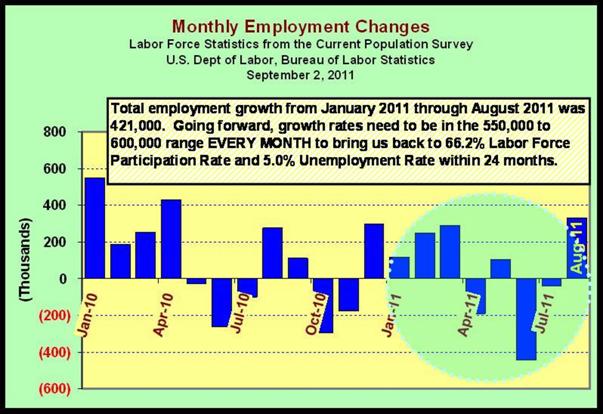
Even after gaining 331,000 jobs in the more inclusive Household Survey in August, allowing for a monthly average of 135,000 new entrants into the Civilian Labor Force, it would require an average of 596,000 jobs to be added each month for 24 months, to reach 66.2% Labor Force Participation Rate and 5% Unemployment Rate.
That amounts to 14 million jobs created over 24 months. From January 2011 to August 2011, we’ve added 421,000 jobs…it’s a start.
Note: let’s not forget that the Civilian Noninstitutional Population expanded from January 2011 to August 2011 by nearly 1.2 million, while the Civilian Labor Force actually fell by nearly 100,000 from January to August!
Household and Payroll Surveys
We cover the differences between the surveys extensively in previous newsletter articles, but keep in mind that changes in the ‘employed’ number is most important in measuring expansion or contraction since it captures self-employed, farm workers and other non-payroll type categories in addition to the traditional employees.
Unemployment June 2011
www.econnewsletter.com/jun112011
Unemployment
The last item we’ll address is Unemployment. This is the term that confuses most of the public and what obfuscates the measures of unemployment from U-1 through U-6, is that the ‘Discouraged (and other Workers out of the Labor Force)’ we described previously, numbering 5.4 million (note that the estimation is based on a Labor Force Participation Rate of 66.2%). These are the folks that have given up looking for work and are therefore NOT considered in the Civilian Labor Force and for that reason are NOT, REPEAT, NOT considered unemployed.
Unemployment is simply measured by subtracting the Employed (from the Household Survey) from the Civilian Labor Force. The Unemployment Rate represents the percentage of Unemployed as compared to the Civilian Labor Force. The problems on the Unemployment side are pretty much addressed in the various measures of Unemployment, noted as follows:
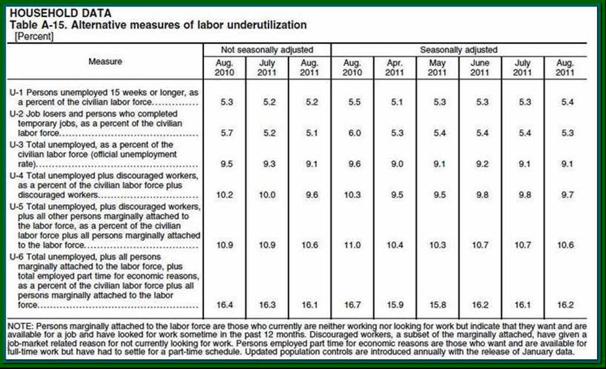
U-3 is the officially reported unemployment rate that we see every month in the media. In August 2011, it was 9.1%, the same as July’s 9.1% and lower than the 9.6% reported in August 2010. Keep in mind that the Labor Force Participation Rate was 64.0% in August 2011, while the rate was 64.7% in August 2010.
Comparing apples to apples, if the Labor Force Participation Rate was at 64.6% in August 2011, the unemployment rate would be at 10.0%, not the stated 9.1%.
Using the 66.2% Labor Force Participation Rate which was the average from 2001-2008, the U-3 unemployment rate would be 12.1%
The U-6 unemployment rate, the broadest measure of unemployment rate, captures the marginally attached, part-time, etc., was at 16.2%.
Again, comparing apples to apples, if the Labor Force Participation Rate was at 64.7% in August 2011, the U-6 unemployment rate would be at 17.1%.
Ratcheting up to the 66.2% Labor Force Participation Rate, the average from 2001-2008, the U-6 unemployment rate would be 18.9%
A last note on the Labor Force Participation Rate – a good reason, in our estimation, for using the higher Labor Force Participation Rate as a metric (e.g., 66.2% versus 63.9%) is to help identify and ‘count’ the unidentified discouraged individuals who we term as the very discouraged worker. The U.S. Department of Labor, Bureau of Labor Statistics, views the discouraged worker as being part of the smaller pool of Civilian Labor Force as reflected by the current 63.9% Labor Force Participation Rate in U-6, but not in U-3.
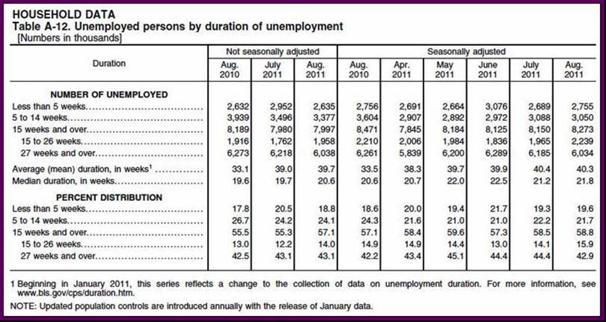
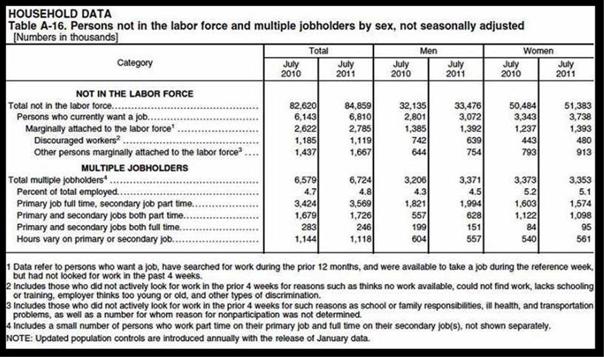
Among the marginally attached, there were 1.1 million discouraged workers in July, about the same as a year earlier. (These data are not seasonally adjusted.) Discouraged workers are persons not currently looking for work because they believe no jobs are available for them. The remaining 1.7 million persons marginally attached to the labor force in July had not searched for work in the 4 weeks preceding the survey for reasons such as school attendance or family responsibilities. (See table A-16.)
Again, when it comes right down to it, we're currently running a deficit of around 11 million jobs and we add around 125,000 (probably more like 150,000) to that total each month as our population expands. This is a situation that cannot continue to go on. These 11 million people have families and households to support. These are people who could help a housing recovery, contribute in terms of taxes and produce more of the goods and services we all need.
Unless, or until, we consistently begin to add in the neighborhood of 300,000 jobs on a monthly basis over the next five years [or 596,000 per month in two years] - private sector jobs that is, there will be no recovery, irrespective of political or academic pronouncements.
Adding to the gravity of the situation, we have seen continued problems with extended duration of unemployment, note the “Average (mean) duration in weeks” for August of 40.3!