
September 9, 2011
For a downloadable version, click the following:
MORE BAD NEWS: THE U. S. TRADE DEFICIT WORSENS, BUT WHICH REGIONS AND STATES ARE LEADING THE RETREAT?
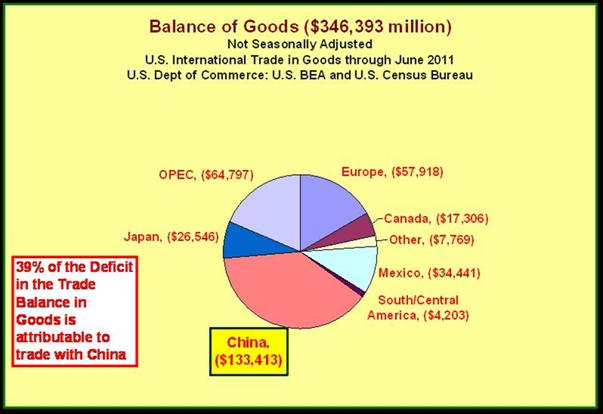
The trade deficit occurs when we import more goods and services from other nations than we export to them. The technical name for the trade balance is the Balance on Merchandise and services Accounts.
Deficits, as we are experiencing, depress the overall level of economic activity and make recovery even more difficult. A trade surplus would stimulate the economy. Why so?
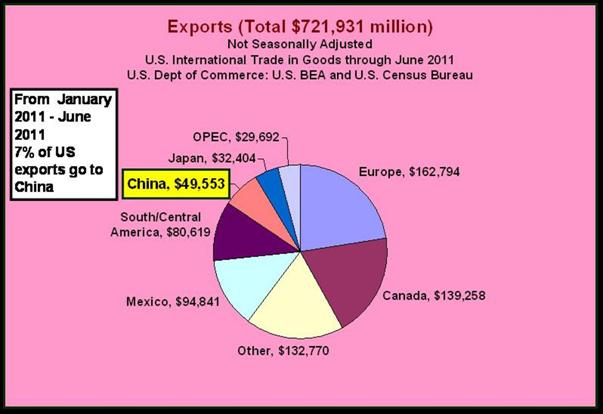
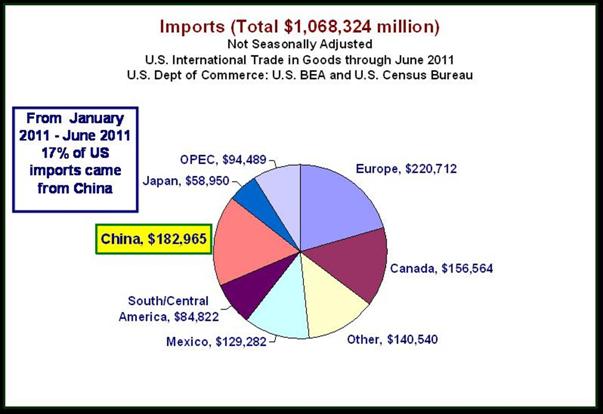
Imports depress the level of economic activity because they demand other nations’ goods and services thus lessening the demand for domestically produced merchandise (also called goods) and services. Exports on the other hand do the opposite, they add to the domestic demand and increase total demand (the more formal name for total demand in macroeconomic theory is aggregate demand) for domestically produced goods or merchandise and services. Since currently we have been experiencing a trade deficit, an excess of imports over exports, our international trade position depresses the level of economic activity and slows the recovery and could help cause a ‘double dip‘ recession. The Great Depression of the 1930s experienced such a double dip in 1937.
Imports are not all bad. If we import those goods and services in which we have what economists call a comparative disadvantage and export those in which we have a comparative advantage, we can experience a higher standard of living on average or per capita basis. However, policies of nations often favor industries in which they have a comparative disadvantage and prevent the importation of those goods and services as their trading partners do the same thing. Political pressures and a variety of economic motives cause these inefficient aberrations thus lowering the average or per capita standard of lining of a nation. Protective tariffs on imports, export subsidies and intervening in foreign exchange markets, are some of the policies resulting in ‘UNFAIR TRADE’.
Over several centuries, as small political units were combining into nations, an economic doctrine developed in conjunction with nation building. It was called mercantilism in England. In France a similar doctrine was called Colbertism and in Germany, Cameralism. A surplus in the trade or merchandise and services balance in those days was called a favorable trade balance. The excess of exports over imports often meant that gold or gold coins were the means of settling the balance with the gold flowing into the nation with the surplus. This was a means of financing the building up of the strength of the budding nation as it could buy mercenaries, such as Hessians for England as they conquered and occupied colonial America.
Today, a similar modernized doctrine version of these policies exists in nations like China and Korea as well as Japan and Germany in the post-WWII era. For want of a beer name it is usually referred to as Neo-mercantilism. The goal is to keep a taught economy at home and export any surpluses products not consumed domestically. China has done this by pegging their currency well below the equilibrium level. In the Post WWII era, the IMF fixed exchange rate system, included pegs for the Japanese Yen and German Mark at dollar prices well below their equilibrium levels. The resulting trade deficits of Japan and Germany with the U.S. were a major cause of the “miracles” of returning these economies to peacetime expansion.
From our Newsletter…
2010 Volume Issue 1
September 23, 2010
HERE WE GO AGAIN - The broken CD (record) routine…before it was Japan and Germany eating our lunch, now it is China
For a more in depth analysis, please review our past articles on this topic in our previous postings…
Why 25+ Years of Trade Deficits?
A tale of High Real Risk-adjusted Interest Rates and the Appreciating/Depreciating Dollar (Jan 12, 2011)
www.econnewsletter.com/jan122011
U.S. Balance of Payments and the Greatest Puppet Show on Earth: China; the Oil Cartel(s); and Energy and the Environment (March 30, 2011)
The Laffer Curve and the J-Curve are Analytically like Two Peas in a Pod (December 2, 2010)
www.econnewsletter.com/dec022010
U.S. Trade Deficit: Good, Bad, or Irrelevant? (October 10, 2003)
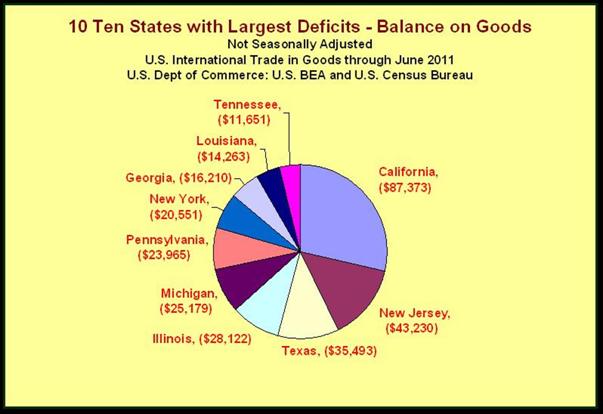
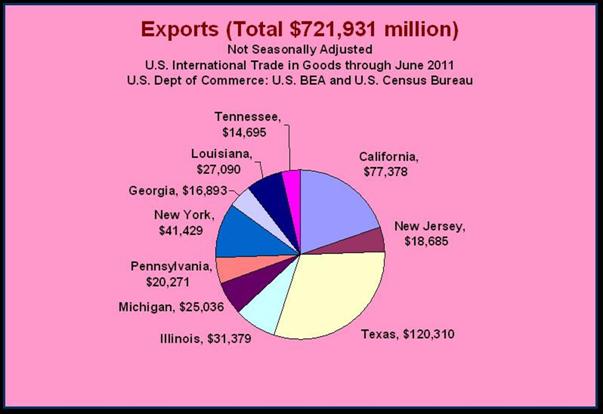
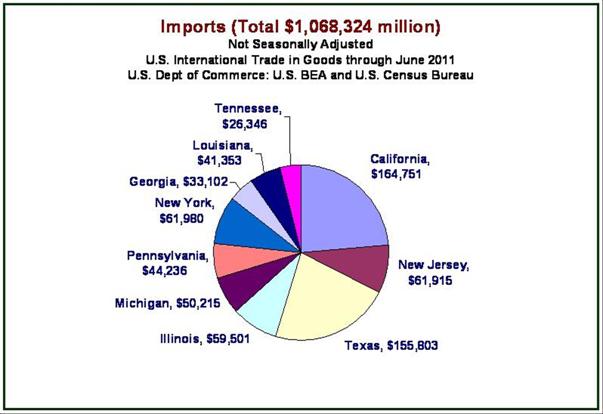
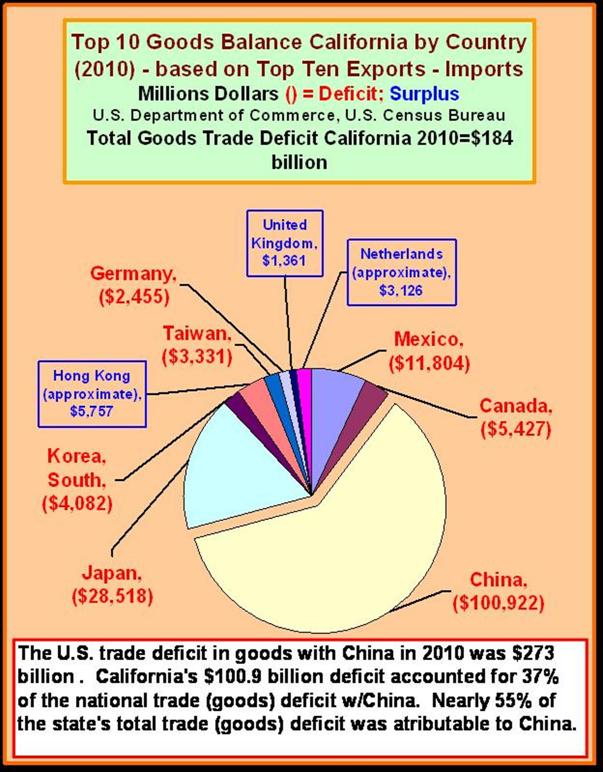
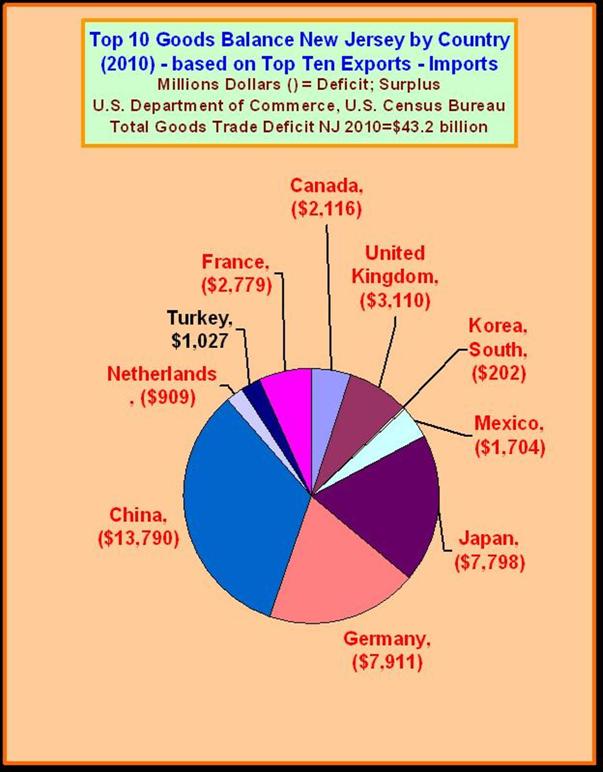
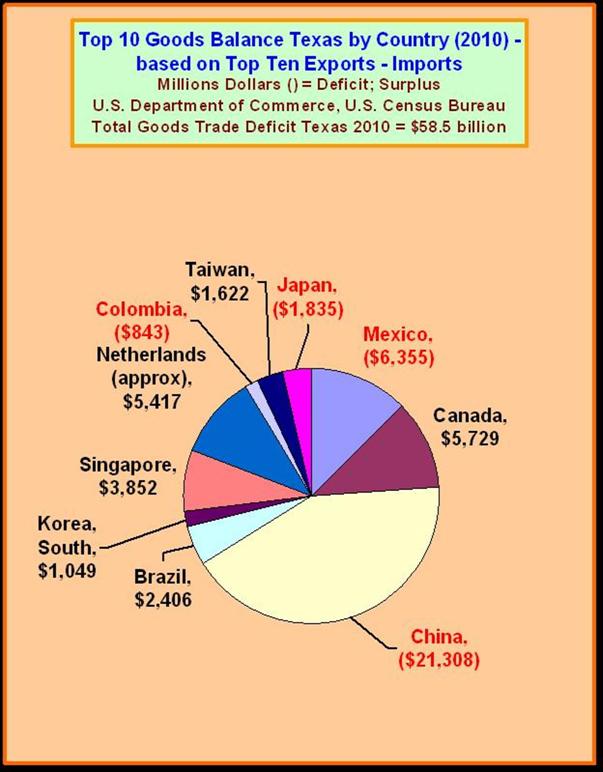
We now scroll down on the top ten states that have contributed the most to the Balance of Goods (or Merchandise) portion of the trade deficit.
The Balance on Goods or Merchandise Account is considered below. It is part of the Trade or Merchandise and Services Balance along with the Services Balance. The Services Account is a very confusing mixture and has a variety of so called ‘drivers’. The Services Account includes such things as transportation and tourism and the repatriation of income on past international investments (not the investments themselves as they appear in the Long-term and Short-term Capital Accounts).
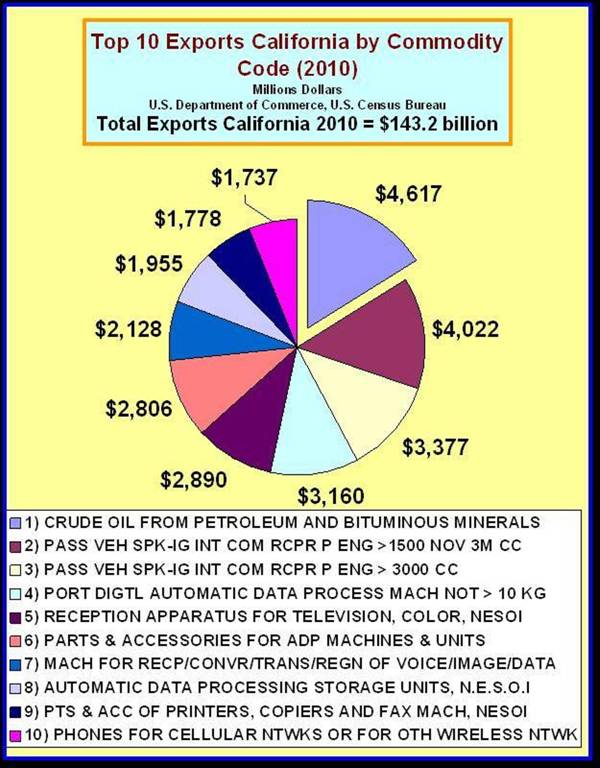
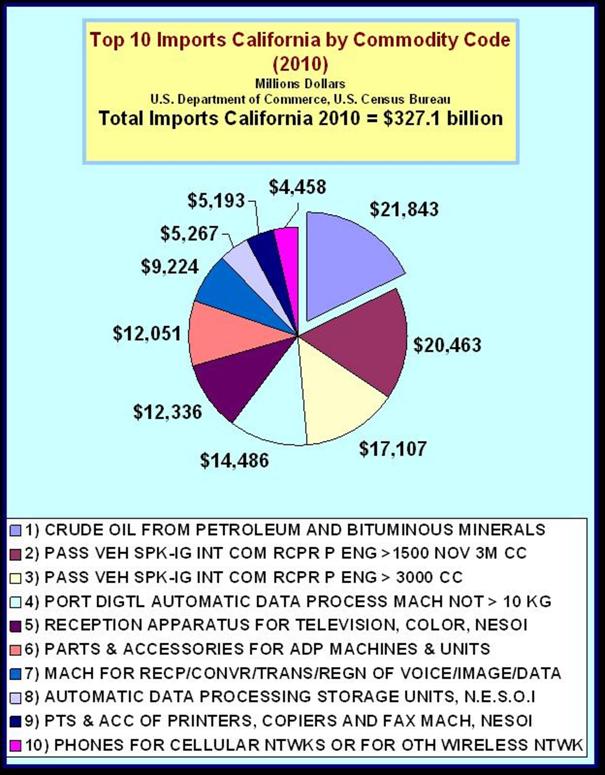
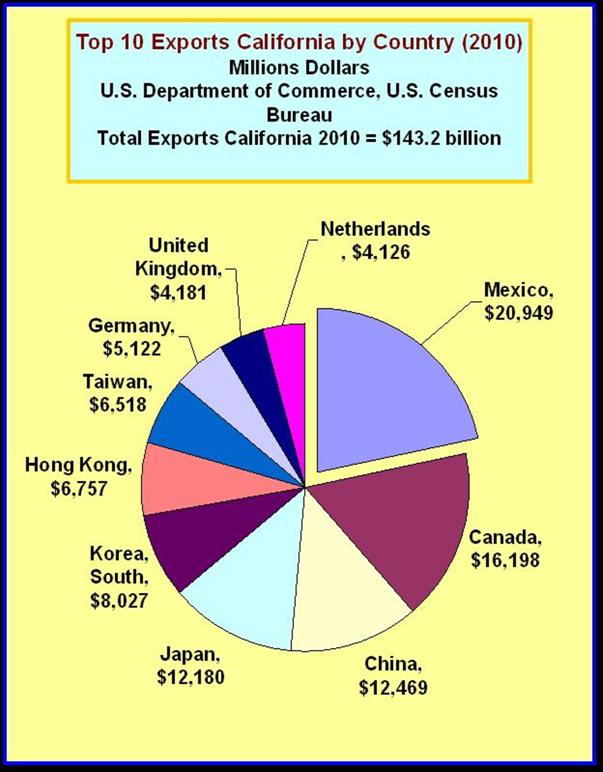
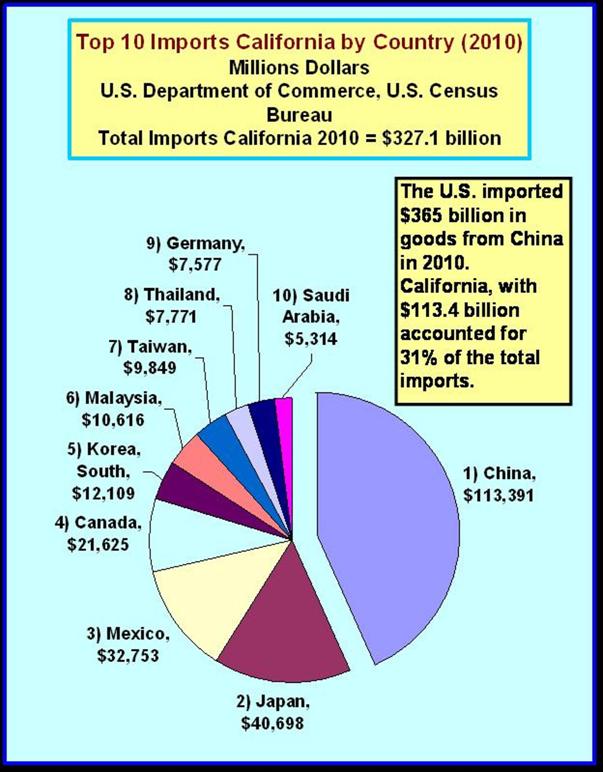
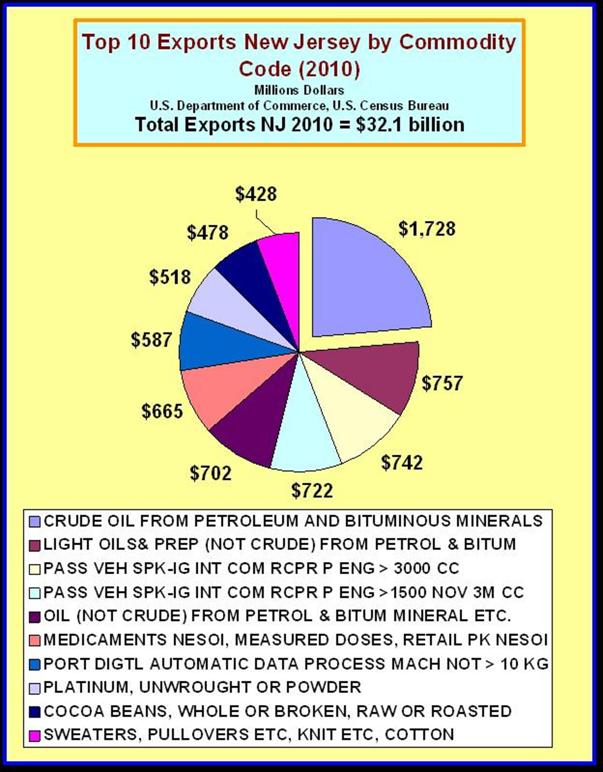
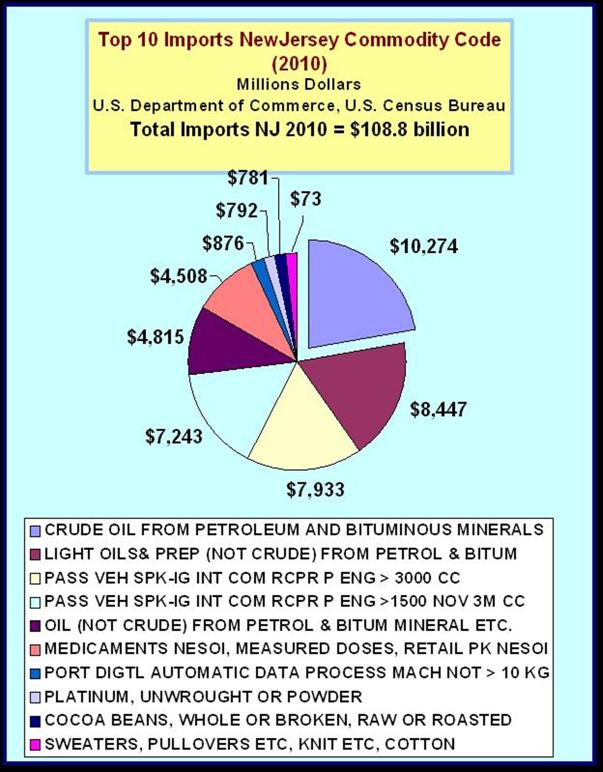
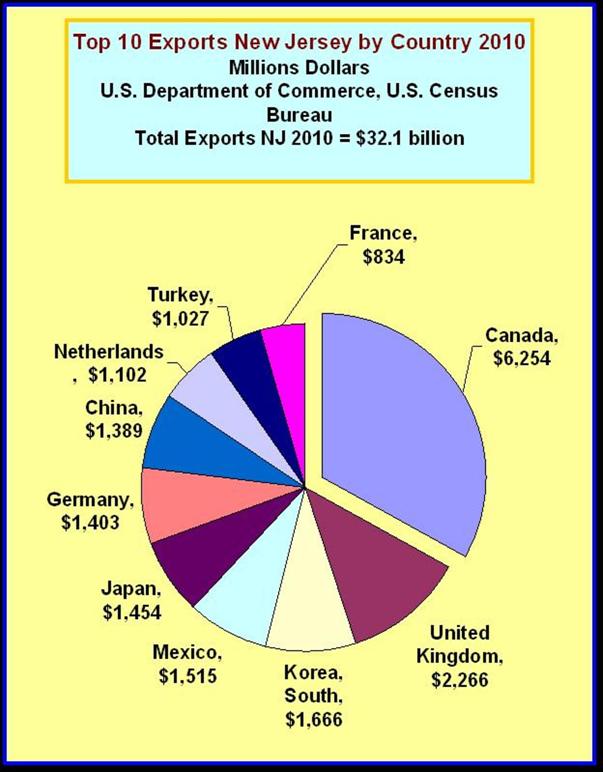
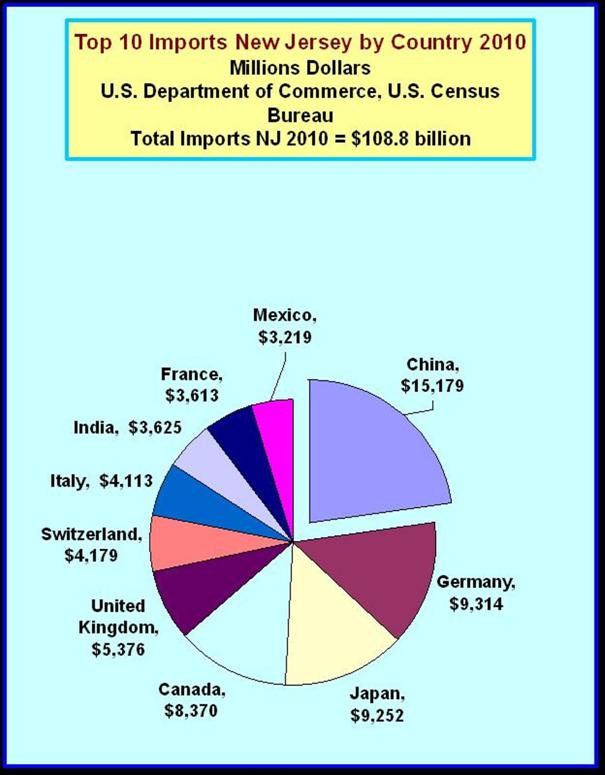
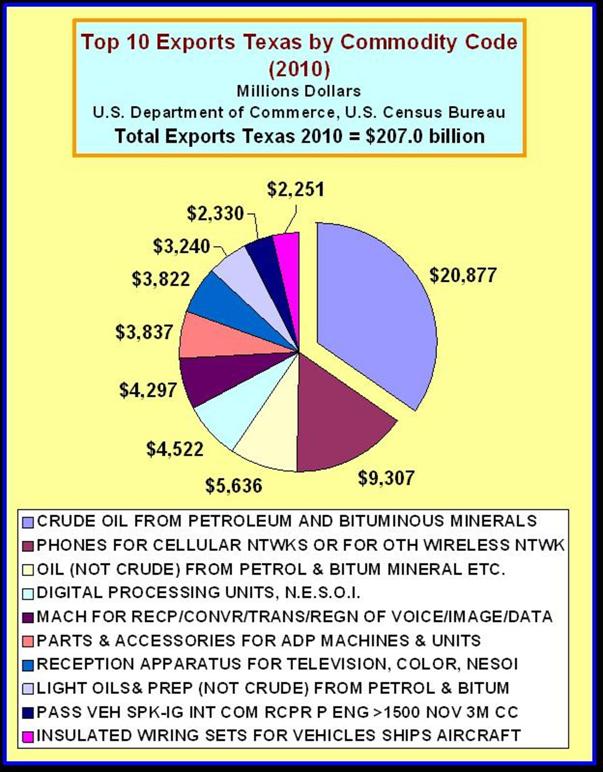
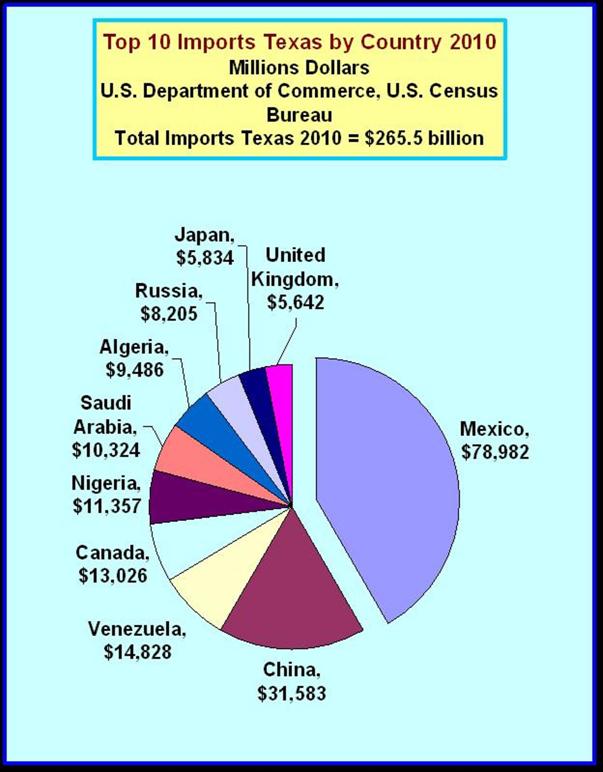
Scrolling down even further on California, New Jersey and Texas for the 2010 calendar year, we can see some details on the composition of the exports and imports.
CALIFORNIA
NEW JERSEY
TEXAS


Be sure to check out the site in coming days for data on:
Illinois, Michigan, Pennsylvania, New York, Georgia, Louisiana and Tennessee
