
2012 Volume Issue 9
April 6, 2012
For a downloadable version, click the following:
…a bit more compressed version of the PDF
How many Jobs are we Short, Really?
On February 2, 2012 Federal Reserve Chairman, Ben S. Bernanke, Before the Committee on the Budget, U.S. House of Representatives:
Nevertheless, as shown by indicators like the rate of unemployment and the ratio of employment to population, we still have a long way to go before the labor market can be said to be operating normally. Since Chairman Bernanke's speech using January 2012 data, the Employment Population Ratio rose in February to 58.6% and then fell back to the 58.5% level as reported in the March Employment Report from the U.S. Department of Labor, Bureau of Labor Statistics
THE EMPLOYMENT SITUATION MARCH 2012
Released April 6, 2012
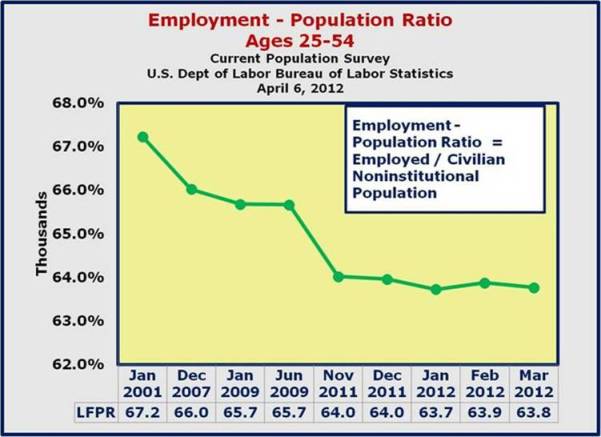
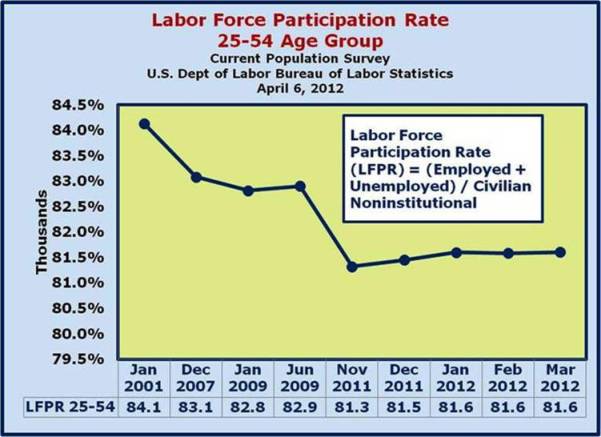
Even more troubling than the overall Employment Population Ratio is the ratio for the 25–54 year olds, who constitute the heart of the working population – those in their prime earning years. The rate has remained at 81.6% for the last three months and just doesn't appear to be budging.
We've been focusing on the employment problem for several issues, paying special attention to the Labor Force Participation Rate. Rather than retread that ground, what we will focus on in this issue is how many jobs we are really short of achieving a Labor Force Participation Rate of 67% with an accompanying 5% Unemployment Rate.
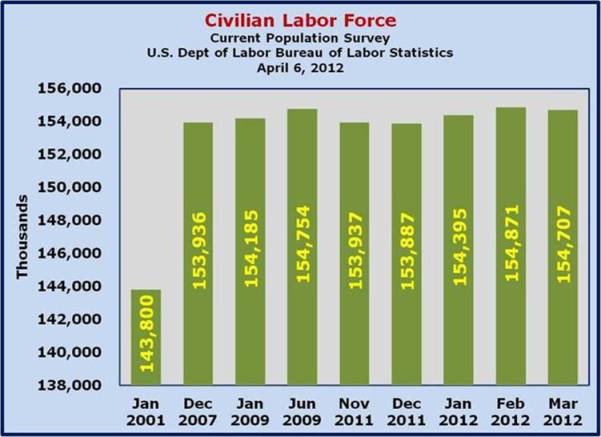
First, the Labor Force Participation Rate is the percent of Employed and Unemployed as a percent of the Civilian Noninstitutional Population.
Again, focusing on a Labor Force Participation Rate of 67%, which last achieved in 2001, and an Unemployment Rate of 5%, which was last achieved in 2008, we want to illustrate how far we are from those levels. Just to reiterate, a higher Labor Force Participation Rate is better than a lower rate; and a lower Unemployment Rate is better than a higher rate.
In the following graphs, we'll walk through the relationships:
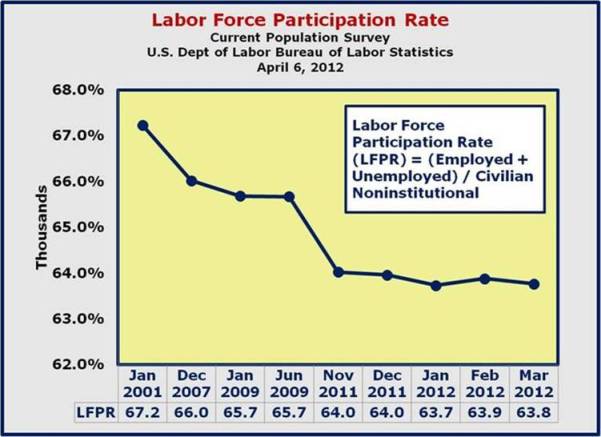
Following an uptick from 63.7% in January 2012 to 63.9% in February 2012, the March Labor Force Participation Rate fell back to 63.8%.
March 2012
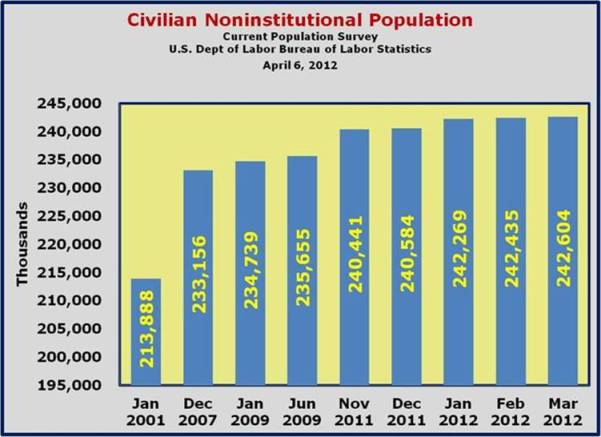
- Civilian Noninstitutional Population grew by 169,000
- Civilian Labor Force fell by 164,000
- The overall (ages 16 and older) Labor Force Participation dropped from 63.9% to 63.8%
- The Labor Force Participation for the 25–54 Year olds remained flat at 81.6%
and the resulting Labor Force Participation Rate, yet again
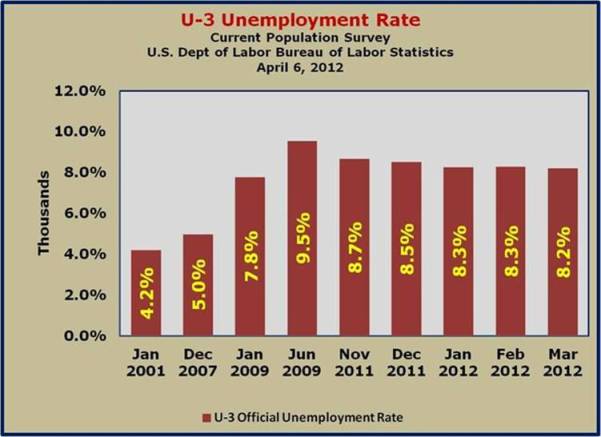
It's clear from the data that while the U–3 Unemployment Rate is falling, something is just not right with the employment picture.
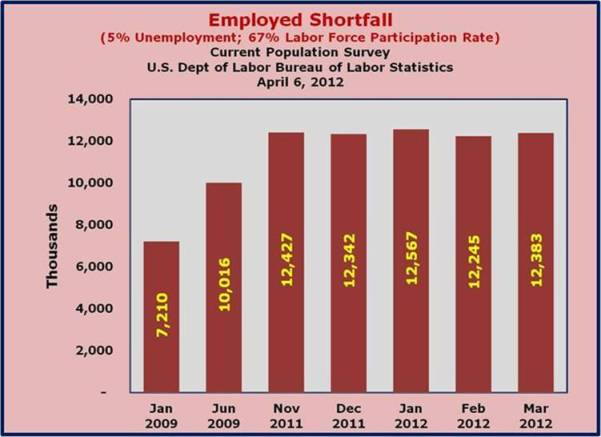
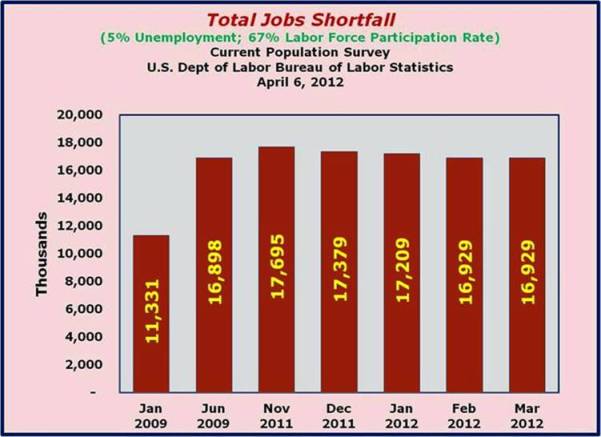
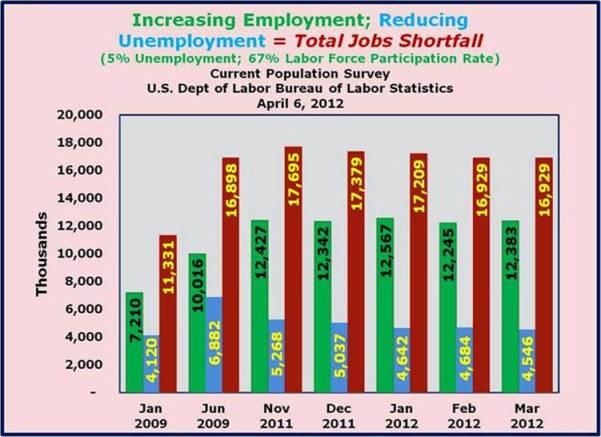
We've stated repeatedly that the objective is to return to a 67% Labor Force Participation Rate and a 5% Unemployment Rate ––– these are levels that we last saw before the economic collapse referred to as the Great Recession. So let's take that journey… First, if we adjust the Employment level to capture those discouraged workers outside of the Labor Force (yet, within the Civilian Noninstitutional Population) who have been sidelined, we are looking at 12.383 million ‘Employment Shortfall’ in March 2012, up from 12.245 million in February.
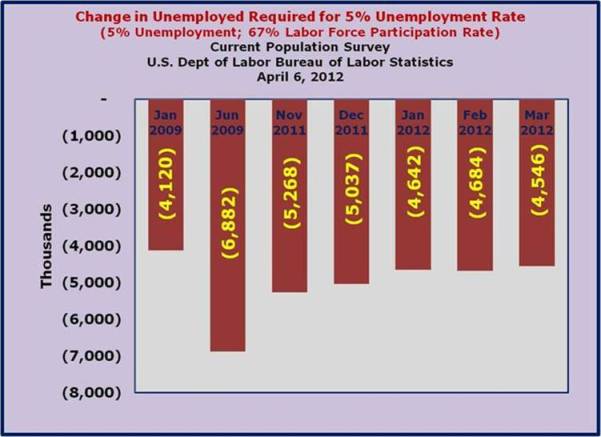
Next, we want to focus on driving down the unemployment rate to 5%. This means that we have to move people WITHIN the Civilian Labor Force from the Unemployed to the ranks of the Employed. Keep in mind that the Unemployment Rate = Unemployed / Labor Force… (and the Labor Force = Employed + Unemployed)
To arrive at the total jobs required, we have to combine the increased Employment number (drawn from the outside of the Labor Force, yet within the Civilian Noninstitutional Population ––– these are the sidelined or DISCOURAGED workers) with the lower Unemployment number (drawn from within the Labor Force – moving from the Unemployed to the Employed) A drum roll, please… Using the 67% Labor Force Participation Rate and 5% Unemployment Rate as a measuring stick, the March jobs shortfall revealed 16.929 million!
So the real question is how do we grow 16.929 million jobs? Keep in mind that the Civilian Noninstitutional Population expands by at 150,000 per month. The math is easy: all we have to do is add 500,000 to the Employment rolls per month for 48 months, (350,000 from current data plus 150,000 in population growth per month)
hmmmm…
The reality is something entirely different. Looking back over the past year, we can see the problems that lie ahead.
The Payroll Survey and the Household Survey
August Employment Report ––– Making Sausage on Labor Day Weekend
September 3, 2011
(While it seems obvious that employment growth is a requirement for recovery, there is often a confusion between the ‘employed’ numbers from the Household Survey and the ‘jobs’ number from the Payroll Survey. The Household Survey covers a wider swath of the population, while the Payroll Survey provides us with a more detailed, yet smaller image of those comprising the Civilian Labor Force (including those employed and those unemployed). In short, the Payroll Survey is a subset of the Household Survey.”
Employment from the BLS household and payroll surveys: summary of recent trends
April 6, 2012
www.bls.gov/web/empsit/ces_cps_trends.pdf
The payroll survey provides a highly reliable gauge of monthly change in nonfarm payroll employment. The household survey provides a broader picture of employment including agriculture and the self employed.
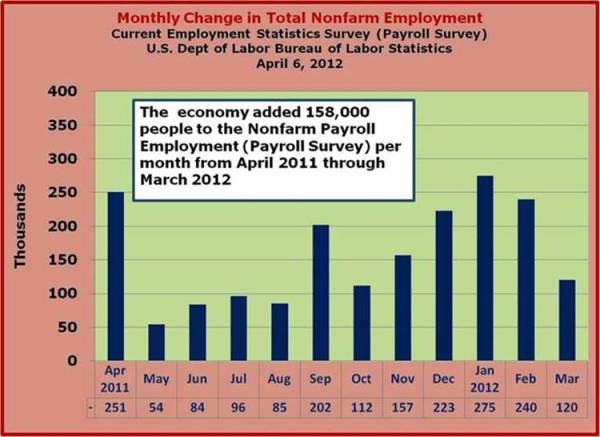
The first monthly measure of change in employment is the Nonfarm Employment Report (Payroll Survey, which includes employment statistics reported on a monthly basis from established businesses. From April 2011 through March 2012 the average employment growth rate was 158,000.
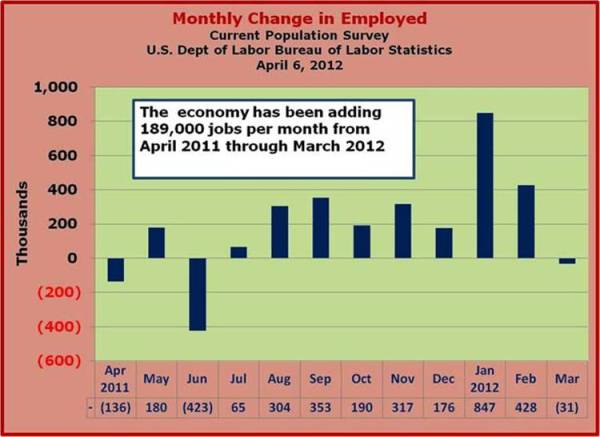
The second monthly measure we'll consider is the data from the Current Population Survey (also referred to as the Household Survey). From April 2011 through March 2012 the average employment growth rate in the Household Survey was 189,000 per month.
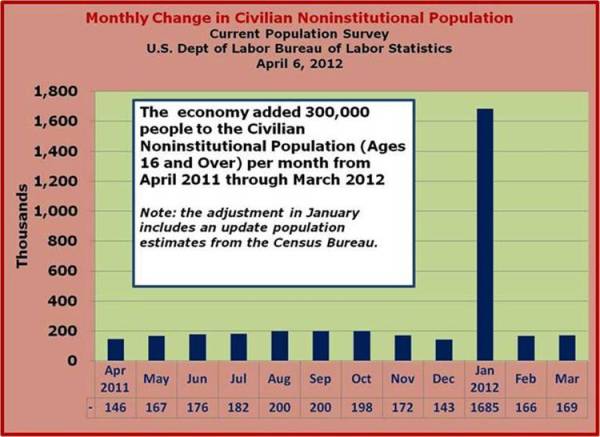
Another consideration regarding economic recovery in the employment situation includes the number of new entrants into the Civilian Noninstitutional Population. Again, measuring from April 2011 through March 2012, we see the number of new entrants averaging 300,000 per month. Note that there was a population adjustment from the Census Bureau in January 2012. Setting the adjustment aside, the average Civilian Noninstitutional population growth was around 174,000 per month.
Given the economic track record over the past year, it is obvious that going forward – unless there is a HUGE INCREASE IN MONTHLY EMPLOYMENT GROWTH, there is no way we will reach an acceptable Labor Force Participation Rate anywhere near 67% in conjunction with an Unemployment Rate of 5% in foreseeable future.
In March 2012, the U–3 Unemployment Rate fell slightly from 8.3% to 8.2%, but the Labor Force Participation Rate fell 63.9% to 63.8! How are we going to get back those 16.9 million lost jobs! Using the 67% Labor Force Participation Rate, there are 12.4 million sidelined or discouraged workers. Measuring the difference in the current U–3 Unemployment Rate of 8.2% and moving down to 5%, we have 4.5 million Unemployed that have to be moved over to the Employed side of the Labor Force equation.
