2012 Volume Issue 26
December 13, 2012
For a downloadable version, click the following:
…a bit more compressed version of the PDF
NOVEMBER 2012 MARKS ANOTHER HORRIBLE MONTH FOR THE EMPLOYMENT SITUATION IN THE U.S.
First, some questions/comments…
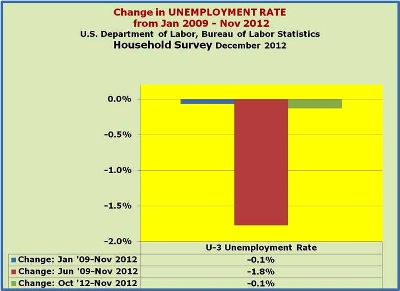
Why isn't the fall in the U-3 unemployment rate and U-6 measure of unemployment good news?
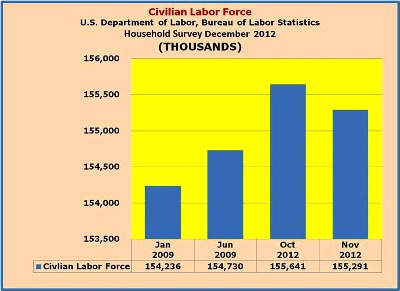
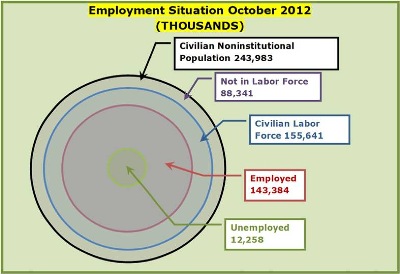
The unemployment rate is the ratio of the number of unemployed as defined in a particular measure or metric such as U-3, which is usually referred to as the ‘official unemployment rate’. The U-3 number of unemployed (only those people actively seeking employment) is divided by the civilian labor force 16 years of age and above. The labor force is equal to the aforementioned unemployed and those employed as shown graphically below.


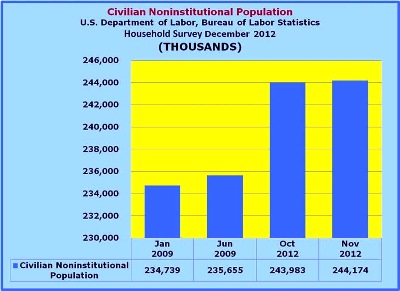
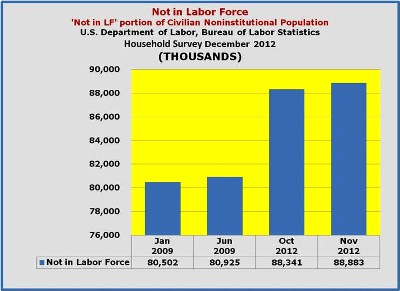
The labor force is a subset of the Civilian Noninstitutional Population which counts the population 16 years and above, excluding those in the military and those that are institutionalized (incarcerated, etc.). In simple terms, the Civilian Noninstitutional Population is comprised of the ‘labor force’ and those ‘not in the labor force’. A clear example of what has been occurring can be seen in the enormous rise in the ‘not in the labor force’ component of the Civilian Noninstitutional Population.


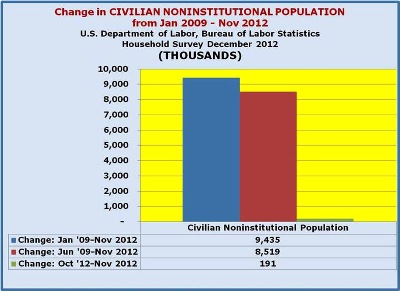
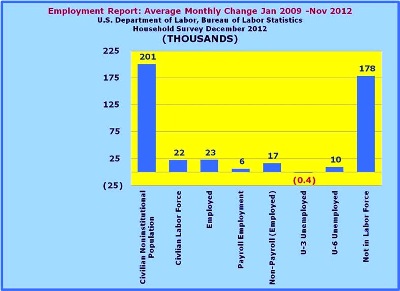
To put things into perspective, over last 47 months, from January 2009 through November 2012:
- Civilian Noninstitutional Population has expanded by 201,000 per month
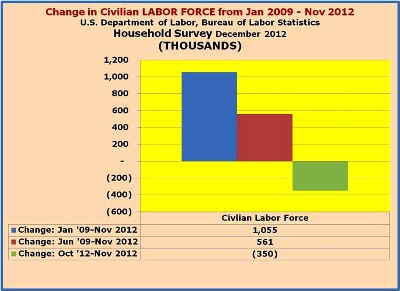
- Civilian Labor Force has expanded by only 22,000 per month
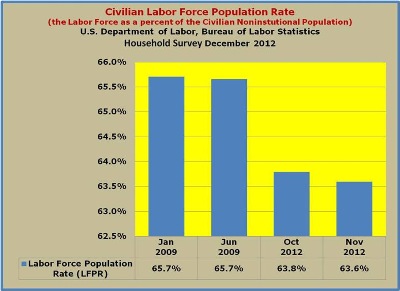
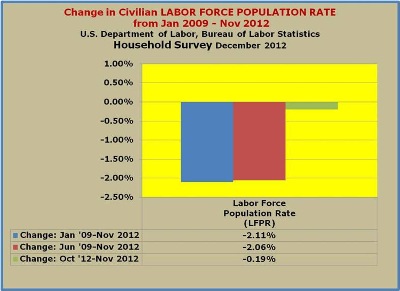
- The (marginal) Labor Force Participation Rate - LFPR (Labor Force as a percent of Civilian Noninstitutional Population) was only 11.2% which caused the LFPR to drop from 65.7% in January 2009 to 63.6% in November 2012
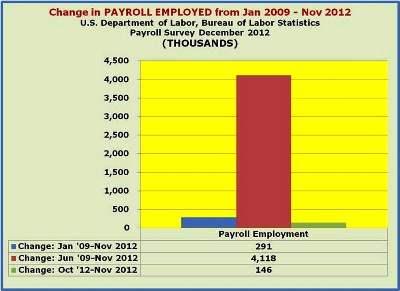
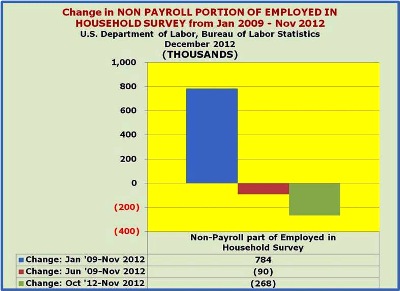
- Employment grew by 23,000 per month on the Current Population Survey side and 6,000 per month on the Payroll Survey side (17,000 per month in the non-Payroll portion of the Current Population Survey employment figure)
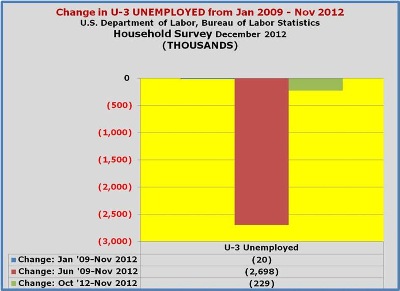
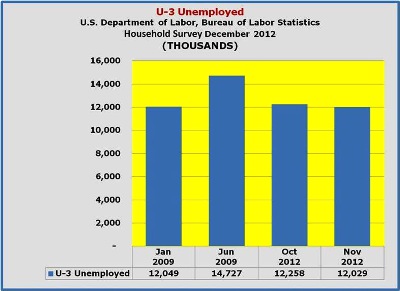
- Unemployment basically remained static, dropping less than 500 per month by the U-3 measure; the U-6 unemployment actually grew by around 10,000 per month per month which includes in their number, discouraged workers and those underemployed
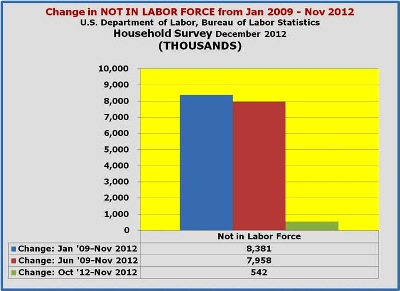
- Lastly, the ‘not in the Labor Force’ portion of the Civilian Noninstitutional Population grew by a whopping 178,000 per month, or reflects 89% of all of those new additions to the Civilian Noninstitutional Population over that same period - discouraged workers and those underemployed would be counted in the group
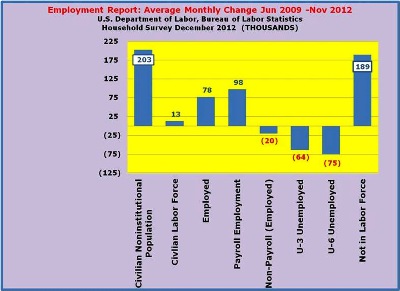
…and now since the “Great Recession” ended in June 2009, over last 42 months, from June 2009 through November 2012:
- Civilian Noninstitutional Population has expanded by 203,000 per month
- Civilian Labor Force has expanded by only 13,000 per month
- The (marginal) Labor Force Participation Rate (Labor Force as a percent of Civilian Noninstitutional Population) went down to 6.6% which caused the LFPR to drop from 65.7% in June 2009 to 63.6% in November 2012
- Employment grew by 78,000 per month on the Current Population Survey side and 98,000 per month on the Payroll Survey side (-20,000 per month in the non-Payroll portion of the Current Population Survey employment figure)
- Unemployment basically remained static, dropped 64,000 per month by the U-3 measure; the U-6 unemployment dropped by 75,000 per month which includes in their number, discouraged workers and those underemployed.
- Lastly, the ‘not in the Labor Force’ portion of the Civilian Noninstitutional Population grew by an even larger 189,000 per month, which points to the startling fact that on a net basis 93% of all of those new additions to the Civilian Noninstitutional Population never made it into the labor force (employed + unemployed)
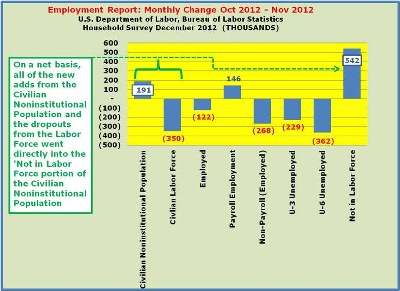
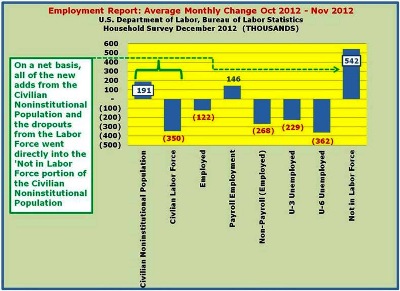
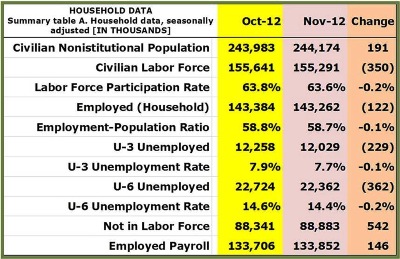
Now, looking at the monthly change in the current Employment Situation Report:
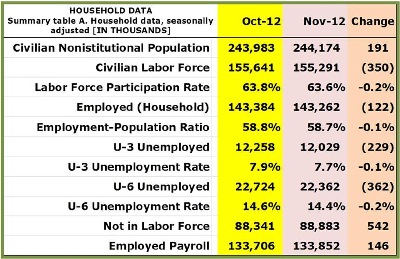
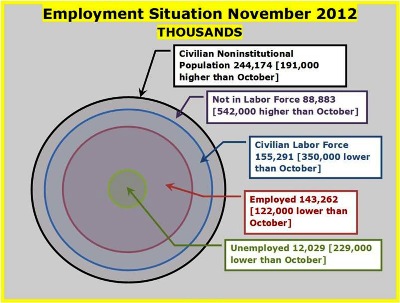
- Civilian Noninstitutional Population expanded by 191,000 in November 2012
- Civilian Labor Force collapsed, dropping 350,000 – again, discouraged workers and those underemployed would be counted in this group
- The [marginal] Labor Force Participation Rate (Labor Force as a percent of Civilian Noninstitutional Population) for November was -183.2% [-350,000 change in the labor force /191,000 change in Civilian Noninstitutional Population]
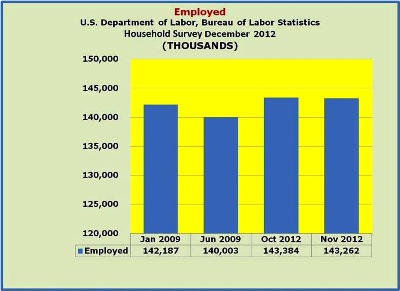
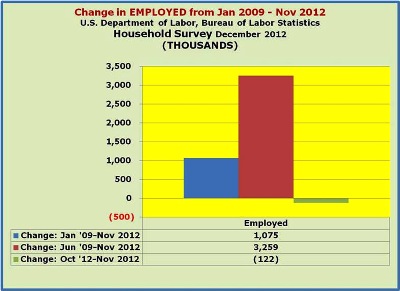
- Employment fell by 122,000 on the Current Population Survey side, while expanding by 146,000 per month on the Payroll Survey side
- U-3 unemployment dropped by 229,000; the U-6 unemployment fell by 362,000 (primarily due to the wholesale movement into the portion of the not in the labor force in the Civilian Noninstitutional Population beyond even the domain of the U-6)
- Lastly, the ‘not in the Labor Force’ portion of the Civilian Noninstitutional Population ballooned by 542,000 for the same reasons as mentioned above
At first blush, you might conclude that the falling unemployment rate is a harbinger of something positive, but you would be wrong in this case.
Let’s walk through in a logical manner looking at it on a net basis:
First, 191,000 people were added to the Civilian Noninstitutional Population (those 16 years of age and older). How many of those people ended up in the Labor Force (either employed or unemployed)? Since the Labor Force actually fell by 350,000, this means that on a net basis NONE of the 191,000 people added to the Civilian Noninstitutional Population ended up in the Labor Force. Instead, the two groupings ended up in the ‘not in the labor force’ portion of the Civilian Noninstitutional Population to the tune of 542,000 people [on a net basis]! The drop on the unemployed side, specifically in terms of the 229,000 in the U-3, was not a good thing since ‘on a net basis’ NONE of them ended up moving to ranks of the employed which also fell by 122,000. This caused the Civilian Labor Force to be reduced by a total of 350,000.
(note: due to rounding, the -122,000 Employed and the -229,000 Unemployed is presented as -350,000, a reduction in the Labor Force in the BLS data).
Because of this, November 2012 resulted in a massacre in the employment picture for the month. On a net basis, the 191,000 new additions to the Civilian Noninstitutional Population and the 350,000 fall-off in the Labor Force (the 122,000 reduction in the employed and the 229,000 that came off the rolls of the unemployed) dumped 542,000 into the nonproducing ‘not in the labor force’ portion of the Civilian Noninstitutional Population.
This above can be seen pictorially in the concentric circle graphs below…
Among the questions begged is what of the reported 146,000 improvement as measured by the Payroll Survey?
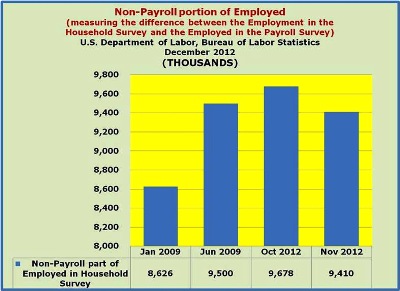
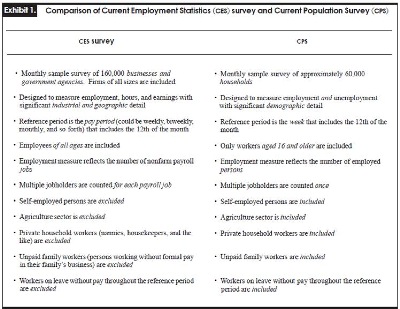
Briefly, the Current Population Survey administered by the Census Bureau for the Bureau of Labor Statistics on a monthly basis measures a larger swath of those employed than does the Payroll Survey which focuses on traditional employment venues, while the former also includes self-employed, farm workers, etc.
Employment Measures
Understanding the employment measures from the CPS and CES survey
www.bls.gov/opub/mlr/2006/02/art2full.pdf
Frequently Asked Questions about Employment and Unemployment Estimates
www.bls.gov/news.release/pdf/empsit.pdf
Why are there two monthly measures of employment?
…the household survey has a more expansive scope than the establishment survey because it includes the self-employed, unpaid family workers, agricultural workers, and private household workers, who are excluded by the establishment survey
http://www.bls.gov/ces/cesfaq.htm
What is the establishment payroll survey?
The establishment payroll survey, known as the Current Employment Statistics (CES) survey, is based on a survey of approximately 141,000 businesses and government agencies representing approximately 486,000 worksites throughout the United States. The primary statistics derived from the survey are monthly estimates of employment, hours, and earnings for the Nation, States, and major metropolitan areas. Preliminary national estimates for a given reference month are typically released on the third Friday after the conclusion of the reference week; i.e., the week which includes the 12th of the month, in conjunction with data derived from a separate survey of households, the Current Population Survey (CPS). The CPS is the source of statistics on the activities of the labor force, including unemployment and the Nation's unemployment rate.
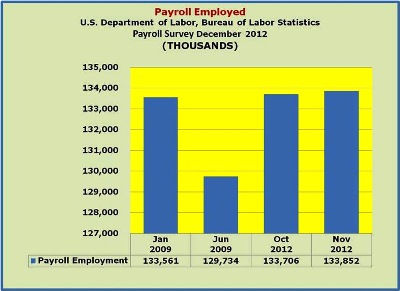
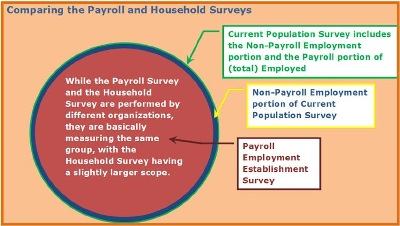
While people can argue about which employment measure is more useful, the fact remains that over time, they tend to mirror one another (with the Payroll portion equating to about 95% of the Household Survey). For the month of November, while the Payroll Survey Employment shows a growth of 146,000, the Household Survey Employed shows a drop of 122,000. The difference can be partly attributed to timing or statistical error, but the majority of the number is due to the job losses from outside of the realm of the Payroll Survey. Keep in mind that that the preceding discussion regarding the Payroll Survey remains within the scope of the Household Survey (or more specifically, outside of the Payroll Survey Employment measure of the Household Survey).
November 17, 2012
Moving the Jobs Needle: Where the heck are we, really? Where do we have to go and how do we get there?
www.econnewsletternov172012.com/
As it turns out, over time, the two surveys pretty much run parallel, with the Current Population Survey measuring a slightly larger swath of the population due to its coverage of farm workers, self-employed or otherwise small firms not tallied by the Payroll Survey or Establishment Survey (Current Employment Statistics). Historically, the Establishment Survey covers about 94 to 95% of the Current Population Survey. In October 2012 the Establishment Survey only covered 93.3% of the Current Population Survey. It is with this in mind; moving back to at least the 94% range, that we assume job growth of 330,000 per month in the Current Establishment Statistics or Payroll Survey which will be slightly higher than the 325,000 monthly employment growth targeted in Current Population or Household Survey over the next 48 months.
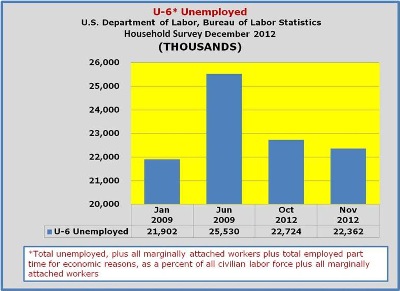
So what explains the even greater drop in the U-6 unemployment?
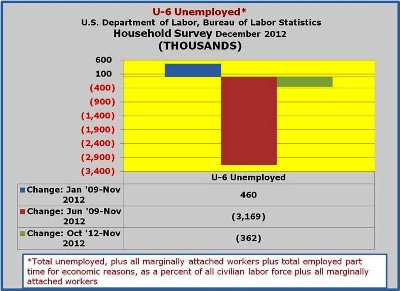
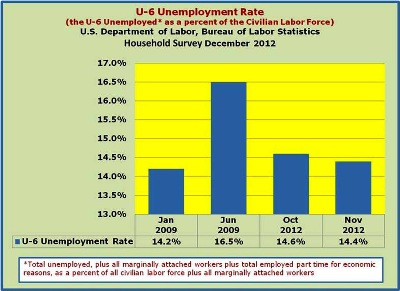
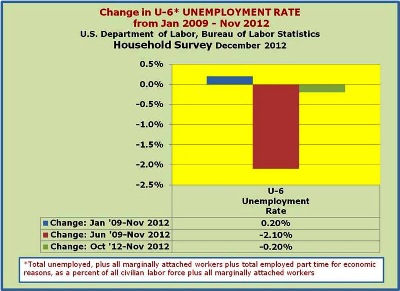
Since the U-6 unemployment rate includes the “total unemployed, plus all marginally attached workers plus total employed part time for economic reasons, as a percent of all civilian labor force plus all marginally attached workers,” you might wonder how that cannot be a good thing. In addition to the 229,000 removed from the rolls of the Unemployed in the Civilian Labor Force and pushed into the ‘not in the labor force’ portion of the Civilian Noninstitutional Population, there were 133,000 more in the U-6 reported number. The combined total of 362,000 as represented by the reduced U-6 reported rate are beyond the even those marginally attached or discouraged workers as noted in the definition. The 362,000 number are those whom we refer to as very discouraged and include people who have either opted for some government assistance (e.g., welfare, Disability, Social Security, etc.) or early retirement since they were unable to find employment.
The Achilles' heel so to speak, of the U-3 definition is if you as a respondent to the Current Population Survey are asked a question such as ‘have you lost your job’ and you respond yes; the next question is then ‘are you looking for work?’ If you say no, you are not unemployed because you are no longer considered to be in the labor force; you have just been defined ‘not in the labor force’ portion of the Civilian Noninstitutional Population.
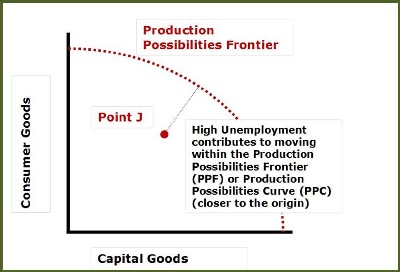
Some of the erstwhile unemployed workers who are no longer officially/actively seeking work are said to be discouraged workers. These discouraged workers are not part of the labor force according to the U-3 definition. This means that the labor force participation rate has decreased and overall capacity of the economy has been reduced. The following graph is a picture of this issue. Just below is what is called a production possibility curve or a production possibility frontier.
On the vertical or Y axis is measured consumer goods, while on the horizontal or X axis is measured all other goods including such items as capital goods, defense goods and services. Unfortunately in the visual we are limited to two axes although by construction and the use of colors etc. we may be able to get to three or four but with increasing complexity that make it increasingly harder to understand.
The reason for its concavity to the origin is a result of the assumption of diminishing returns as we expand production of consumer goods by shifting resources to the production of consumer goods away from the production of other goods such as capital goods, defense goods and services.
If an economy is operating on its production possibility curve the only way it can increase the production of consumer goods and services is by economic growth or reducing the production of other goods and/or services. The economist would say that the opportunity cost of increased consumption is the reduction of other nonconsumer goods.
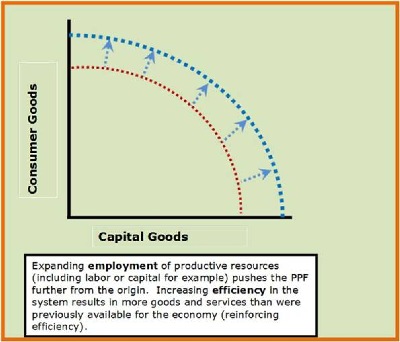
In order to achieve the maximum levels of production, which are restricted by our resources and technology, it would mean that we are operating on the production possibility curve or frontier. Note that the resources at our disposal must be fully and efficiently employed; that is to say, we should be using the appropriate technology available for the level of production being undertaken.
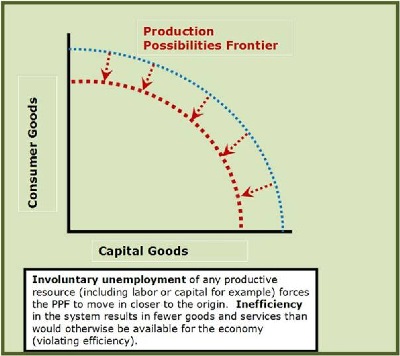
When the economy is operating within (inside or closer to the origin) its production possibility curve, it means that that the economy is not producing at its maximum. This would occur when either the economy is operating inefficiently or when some other resources are involuntarily unemployed. If the latter is serious enough it is generally called a recession or a depression. Unemployed resources also exist when the economy is recovering from a recession and is moving away from the origin towards its production possibility frontier.
We can measure the cost of operating inefficiently. One such example would be featherbedding, that is to say employing labor when it is not needed (or in excess of what is needed). Another example is the use of excessive capital as embodied in Rube Goldberg cartoons or as a result of what the Austrian school of thought terms of mal-investment. As indicated above, the presence of involuntarily unemployed productive resources such as capital or labor would also cause the economy to operate within its production possibility curve.

The distance from where an economy is operating such as point J, to the production possibility curve measures the cost of the inefficiency or a weak economy such as a recession. The graph or picture of this situation shows that society is deprived of a higher level of consumer goods or of all other goods, which were termed capital goods (and defense goods) because of the limit to two dimensions.
The reduced availability of either consumer goods or other goods or some combination of the two is a real decrease in the standard of living of the body politic. This is the cost to society of a lower labor force participation rate. As we shall see shortly, this decrease in the labor force participation rate is not simply an increase in baby boomers retiring.
We can visually see, contrary to the cynics and critics who debunk the drop in the labor force participation rate, its real cost it is a lower standard of living when the labor force participation rate falls. Pictorially it can be seen as the production possibility curve shrinking inward toward the origin as the productive resource, labor decreases.
Now, we’ll revisit the path/trajectory we laid out in a previous newsletter which is required to bring us back to our production possibilities level as described above.
As we indicated in our Newsletter from November 17, 2012, we will have to begin growing employment in the Current Population Survey by at least 325,000 per month for the next four years to drive the U-3 Unemployment Rate down to 5% and the Labor Force Participation Rate back up to the 66% range.
You should keep in mind that since January 2009, we have only grown at a rate of 22,447 jobs per month!
Lest you think that the Payroll Survey side reveals stronger employment growth…from January 2009 through November 2012 the Payroll jobs growth averaged around 6,200 per month.
Moving the Jobs Needle: Where the heck are we, really? Where do we have to go and how do we get there?
www.econnewsletternov172012.com/
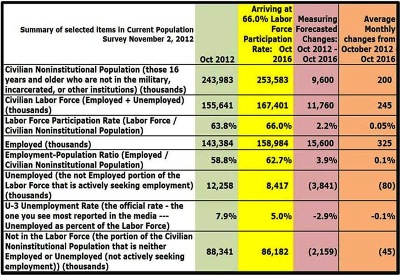
Goals to be achieved by October of 2016
- Unemployment Rate: 5.0% (The average Unemployment Rate from January 2005 through December 2008 was 5.0%)
- Labor Force Participation Rate (LFPR): 66.0% (The average Labor Force Participation Rate from January 2005 through December 2008 was 66.1%)
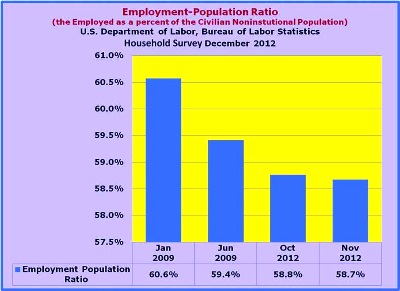
- Employment-Population Ratio: 62.7% (The Employment-Population Ratio was 62.7% at the end of 2007)
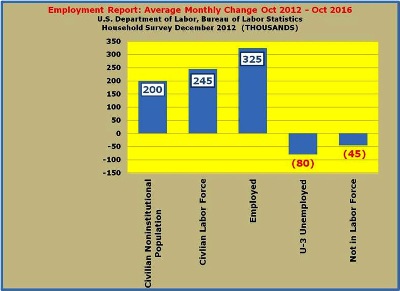
- Employment Report Targets – The preceding ratios requires the achievement of the following (through October 2016):
- Civilian Noninstitutional Population 200,000 per month for a total of 9,600,000 per for 48 months
- Labor Force 245,000 per month for a 48 month total of 11,760,000
- Employment 325,000 per month for a 48 month total of 15,600,000
- Unemployed dropping by 80,000 per month for a 48 month total reduction of 3,841,000
Note…
In going through the various steps noted above, it might seem counterintuitive that, for example, the monthly reduction in unemployment is such a modest figure, but we ask you to think about these items on a NET BASIS as we walk back through them.
- The monthly additions continuously expands the Civilian Noninstitutional Population and causes only modest reductions in the ‘not in the Labor Force’ portion of the Civilian Noninstitutional Population
200,000 move into the Civilian Noninstitutional Population, while only 45,000 are removed from the ‘not in the Labor Force’ portion of the Civilian Noninstitutional Population.
- The 200,000 from the Civilian Noninstitutional Population, combined with the reduction of 45,000 from the ‘not in the Labor Force’ portion of the Civilian Noninstitutional Population result in an expansion of the Labor Force of 245,000 per month. That movement to the Labor Force would drive the Labor Force to the targeted 66% Labor Force Participation Rate.
- The next step on the way is to achieve the targeted 5% unemployment rate. Recall that the unemployment rate is equal Unemployed divided by the Labor Force.
Since the Labor Force is in this example is expanding by 245,000, the required reduction in the actual number of unemployed is substantially reduced. Again, keep in mind that we are looking at this scenario on a net basis. Effectively, what happens on that net basis is that those 245,000 individuals moving into the Labor Force on a monthly basis (on average) move immediately into the ranks of the employed, bypassing the unemployment pool altogether.
Beyond the 245,000 per month influx from the new additions to the Civilian Noninstitutional (200,000) and the ‘not in the Labor Force component of the Civilian Noninstitutional Population (45,000 reduction) an additional 80,000 per month are moved from the ranks of the unemployed to bring the net monthly increase on the Employed side to 325,000.
- The 325,000 additions to the employed has two results: first, by working in concert with the reduction in the unemployed (80,000 per month), it drives the U-3 Unemployment Rate down to 5.0%; secondly, it results in a 62.7% Employment-Population Ratio, where the rises at much higher rate (325,000 per month) than the Civilian Noninstitutional Population (200,000 per month).
While these numbers will certainly confuse you (as they certainly have for us), keep in mind that in order to drive toward the higher Labor Force Participation Rate (66%) and the lower Unemployment Rate (5.0%), we have to grow the Labor Force (245,000 per month) and jobs (Employed 325,000 per month) at a much higher rate than the 200,000 per month new entrants to the Civilian Noninstitutional Population.
Using the preceding graphs/charts as a point of reference (a monthly measure of what we need to move toward the twin goals of an unemployment rate of 5.0% and a Labor Force Participation Rate of 66%), we can truly see the starkness of the latest data and more importantly, how problematic it has become to actually grow those jobs any time soon in light of the current clamoring for higher tax rates (taxes depress) and increased spending, i.e., deficit spending (pushing us ever closer to insolvency/sovereign risk à la Greece).
Now we can look at the data as revealed in the most recent employment report that came out on December 7, 2012.
Employment Situation Summary for November 2012
www.bls.gov/news.release/archives/empsit_12072012.pdf
Scrutinizing the Employment Situation
In the following series of graphs/charts, we want to illustrate where the employment picture currently stands and how it got there.
We basically present the data from the Bureau of Labor Statistic’s (BLS) Current Population Survey (Household) and the Employment figures from the Bureau’s Establishment Survey (Payroll or Current Employment Statistics).
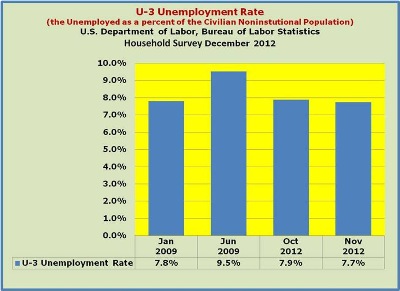
We first show you some relevant BLS data for four points in time:
- January 2009
- June 2009 – end of the Great Recession
- October 2012
- November 2012
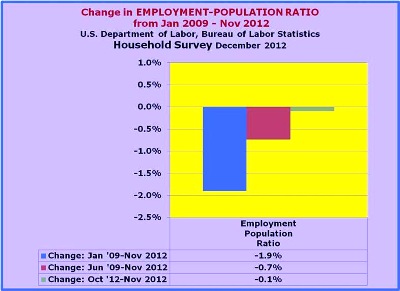
Next, we show you the change over various periods:
- January 2009 – November 2012
- June 2009 – end of the Great Recession --- November 2012
- October 2012 – November 2012
The objective is to simply provide you with some points of reference for reviewing this presentation and for providing the basis for you to sort through the employment data which is released by the U.S. Department of Labor, Bureau of Labor Statistics on the first Friday of each month in the Employment Situation Report
http://www.bls.gov/news.release/pdf/empsit.pdf
That’s all for now…Happy Holidays from Don and Ed!