2012 Volume Issue 3
February 22, 2012
For a downloadable version, click the following:
What's going on with the Civilian Noninstitutional Population?
…a bit more compressed version of the PDF
What's going on with the Civilian Noninstitutional Population?
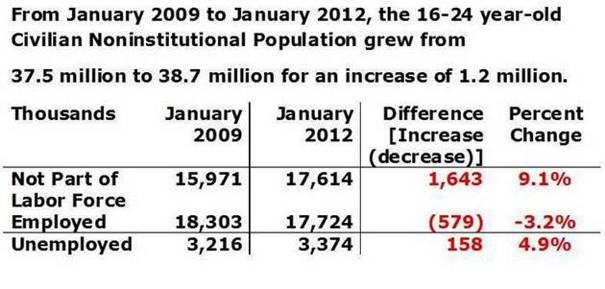
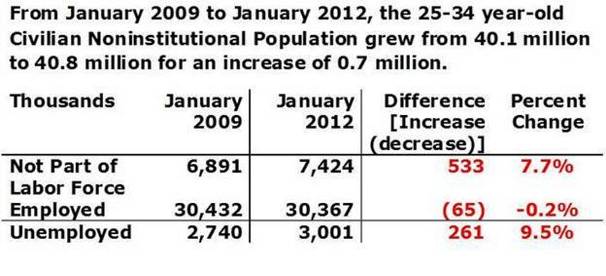
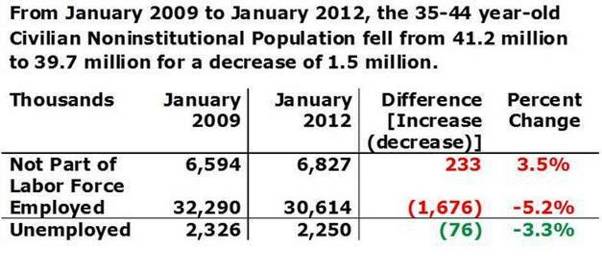
January 2009 to January 2012
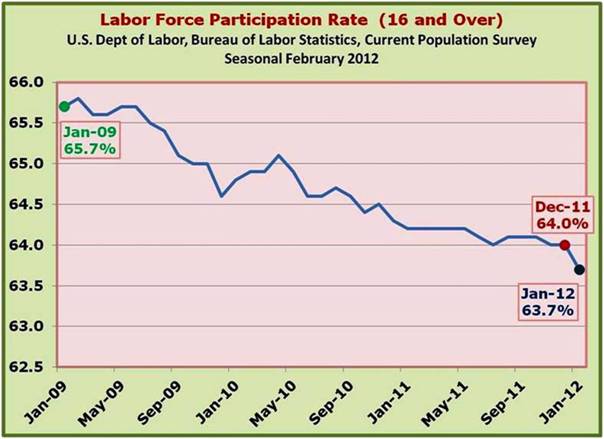
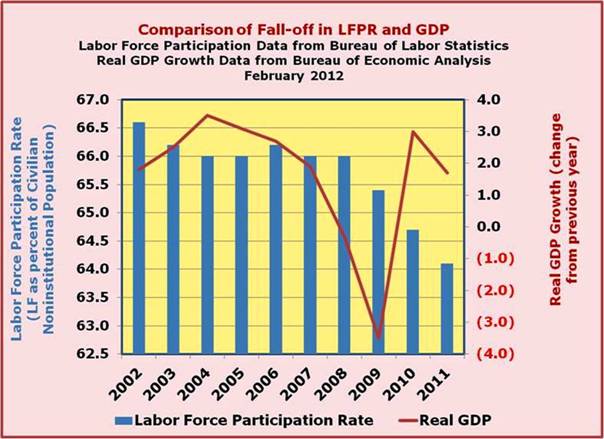
Falling Labor Force Participation Rate (LFPR)
As we have noted in previous newsletter articles, a huge economic challenge facing the U.S. economy is the fall-off in the Labor Force Participation Rate. From January 2009 through January 2012, the LFPR has gone from 65.7% down to 63.7%.
What does this really mean?
The Civilian Labor Force includes those people who are working (employed) and those who are not working, but are seeking employment (unemployed) as defined by the U.S. Department of Labor Bureau of Labor Statistics. The Civilian Labor Force is a subset of the Civilian Noninstitutional Population, which also includes those individuals (16 years and older) who are NOT either employed or unemployed – in short, these are people who are retired, homemakers, students and others who are not part of the Labor Force for a variety of reasons.
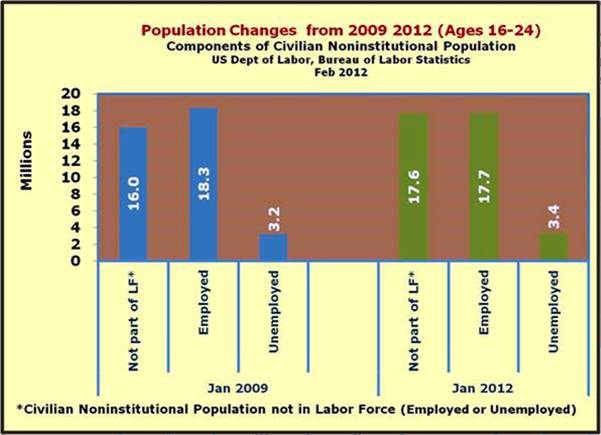
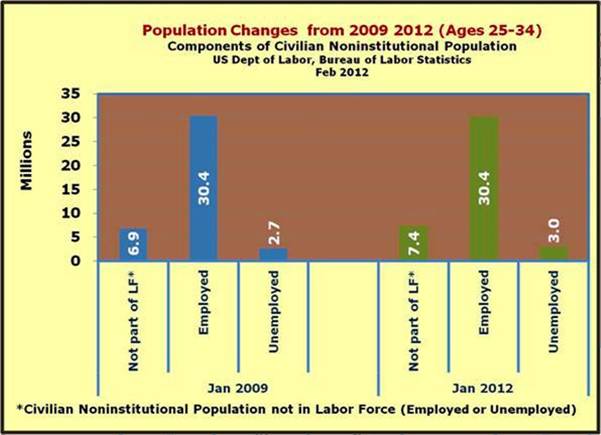
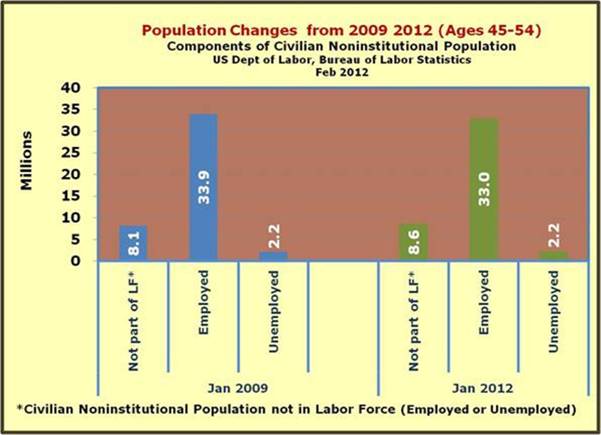
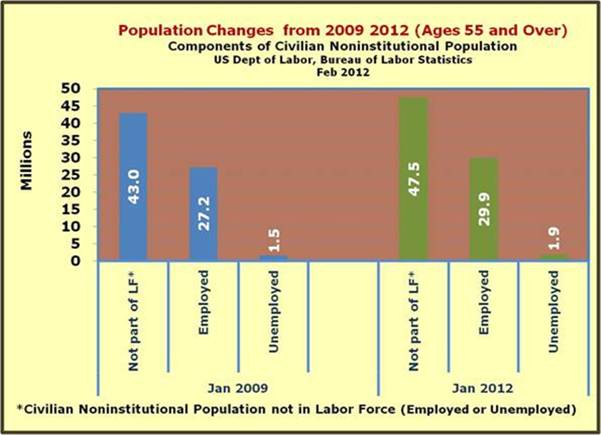
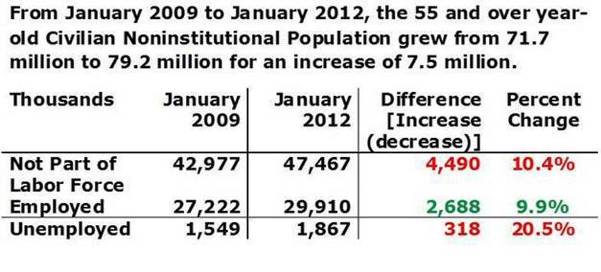
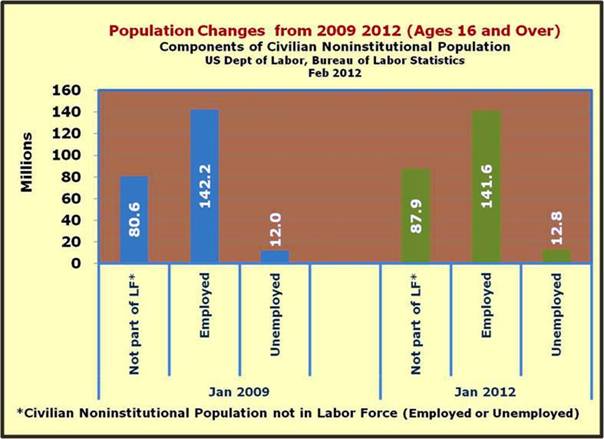
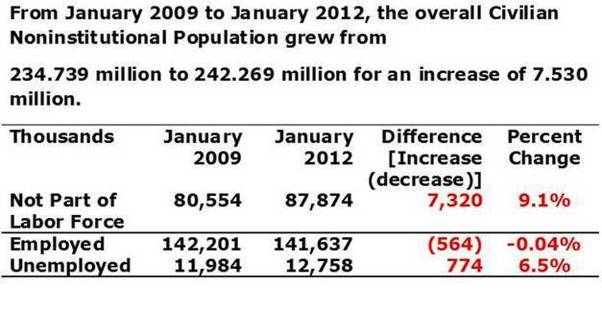
Civilian Noninstitutional Population: Changes from January 2009- January 2012
When we drill down on the difference in the Civilian Noninstitutional Population from January 2009 through January 2012 we can see the reasons for the fall-off in the Labor Force Participation Rate. First, while the Civilian Noninstitutional Population expanded by 7.5 million, 7.3 million opted out of the Labor Force. Secondly, the Labor Force itself actually shrank the result of lower number of employed individuals, 564,000, and an increase in those unemployed by 774,000.
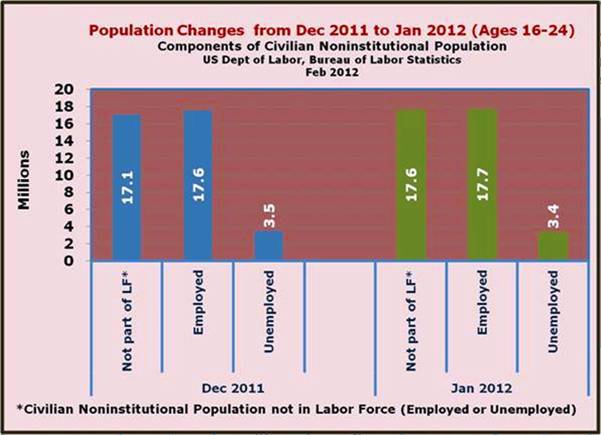
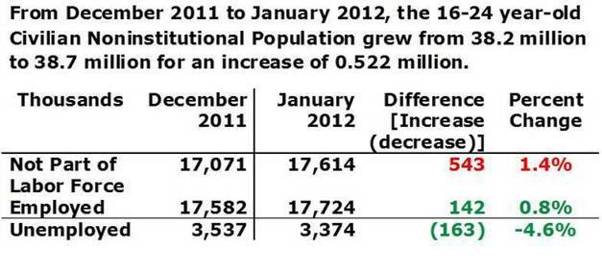
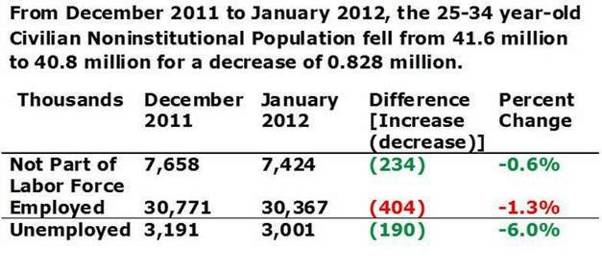
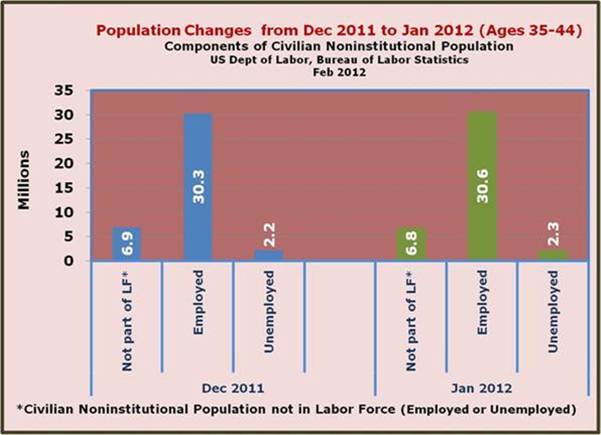
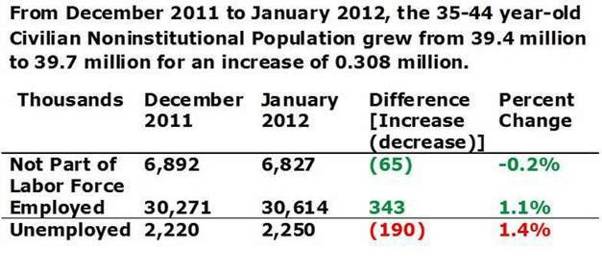
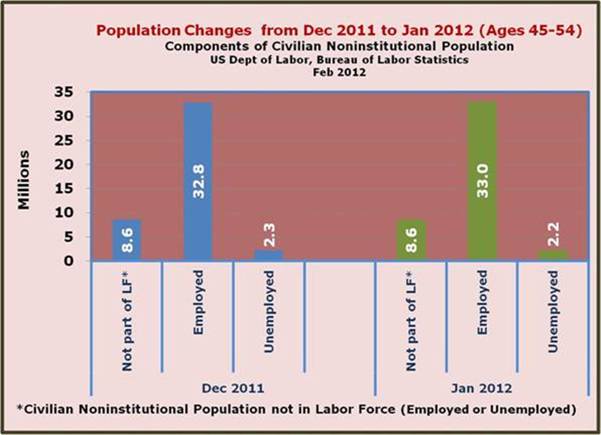
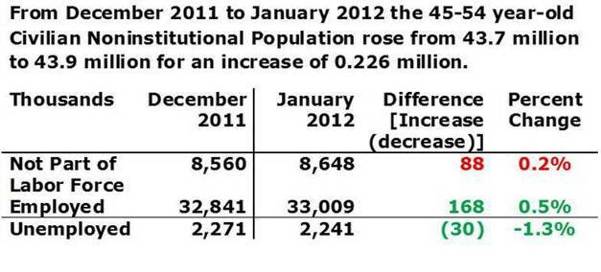
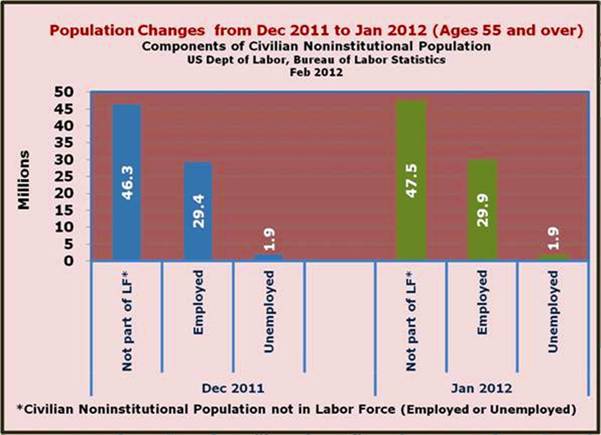
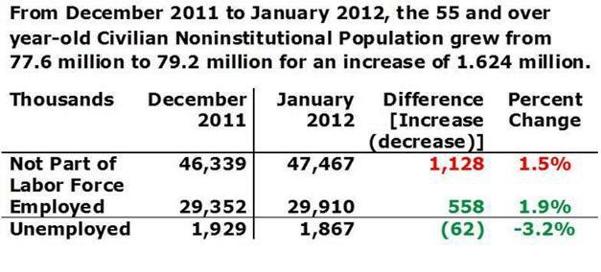
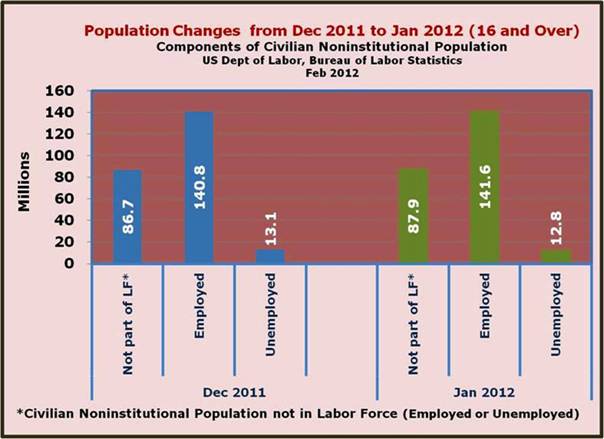
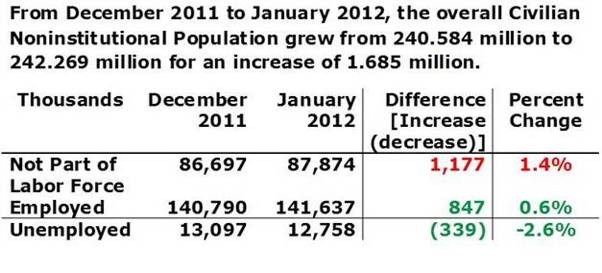
Moving from December 2011 to January 2012 – just one month
In the January 2012 Employment Situation (released February 3, 2012), published by the U.S. Department of Labor, Bureau of Labor Statistics seemed to present a glowing picture:
Total nonfarm payroll employment rose by 243,000 in January, and the unemployment rate decreased to 8.3 percent, the U.S. Bureau of Labor Statistics reported today. Job growth was widespread in the private sector, with large employment gains in professional and business services, leisure and hospitality, and manufacturing.
On the surface, it appeared to be filled with promise for the long-awaited economic rebound. The truth is that while those employed actually did expand by 847,000 (the focus here is on the Current Population Survey or Household Survey as opposed to the Establishment or Payroll Survey which revealed 243,000 jobs added) and the Unemployed fell by 339,000 – so where's the bad news, what's the downside?
Remember now that the Civilian Noninstitutional Population includes Employed (up 847,000 – good news), Unemployed (down 339,000 – good news) and those NOT in the Labor Force (up 1,177,000 BAD news). The large numbers reflected in the monthly change from December 2011 to January 2012 (1,685,000 added to the Civilian Noninstitutional Population) were the result of population updates from the Census Bureau, but the net effect was that Labor Force Participation Rate went from 64.0% down to 63.7% and as we indicated in a previous newsletter, if the LFPR had not changed, the unemployment rate would have actually risen from 8.5% to 8.6%.
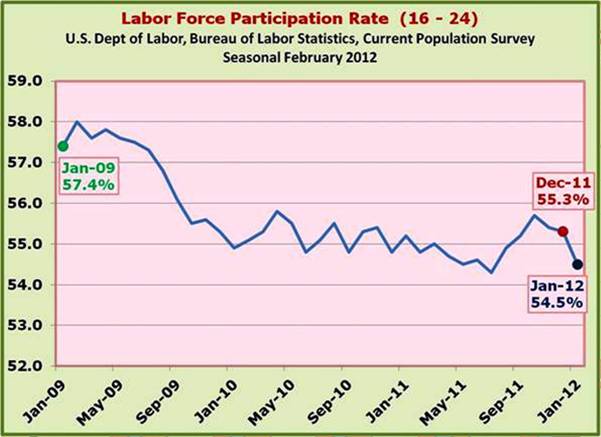
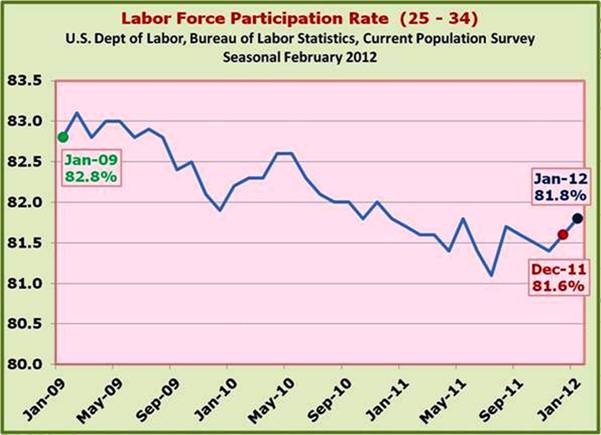
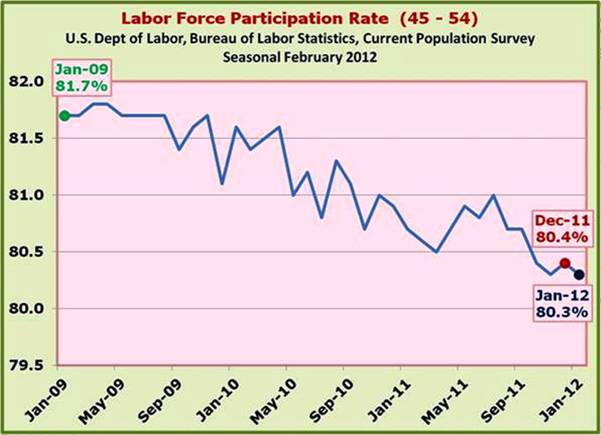
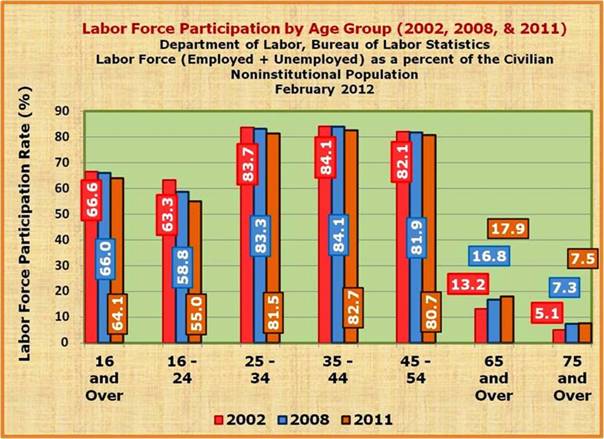
Labor Force Participation Rate by Age Group
www.econnewsletter.com/feb082012.html
If January 2012 LABOR FORCE PARTICIPATION RATE (63.73%) had been the same as December (63.96%)
UNEMPLOYMENT RATE = Unemployed divided by the Labor Force
In December 2011 UNEMPLOYMENT RATE was 13,097,000 / 153,887,000, or 8.5%
Adjusting January 2012 total at the 63.96% December Labor Force Participation Rate UNEMPLOYMENT RATE was 13,327,792 / 154,964,792, or 8.6%
The UNEMPLOYMENT RATE would have risen by 0.1%! This is why the focus has to be on metrics other than the just unemployment.
In the balance of this presentation, we have included charts, breaking out the data according to various age groupings (cohorts) in the Current Population Survey. It's interesting to see the changes over time with the Civilian Noninstitutional Population in general, while the various cohorts expand and contract as the Greatest Generation (1901 – 1924), Silent Generation (1925–1945), Baby-Boomers (born 1946–1964), Generation X (1965–1981), and Generation Y (1982–2000) make the way through the system.
There are two major points to keep in mind as you review the charts:
- The current fall-off in the Labor Force Participation Rate has to be reversed quickly across the board; this is the key to reviving the economy and bringing it back to pre-recessionary levels.
- The current and ongoing trend will be for older workers to remain attached to the Labor Force; this is necessitated by shortfalls in their own income levels, and the need for their marginal productivity in the economy at large. The good news is that technological advances (i.e., medical improvements, less physically demanding jobs, etc.) have paved the way to enable many more people to participate in the labor markets to a much greater degree and with greater longevity than has ever been the case in the past. The new reality is that experienced and educated workers can, should and will be able to contribute and be productive for as long as they are physically able.
In upcoming articles, we will be exploring pension funds issues and the potential [if not impending] crisis for defined benefit funds on the private side with a nearly bankrupt Pension Benefit Guaranty Corporation and in the public sector with the increasing demands on limited tax dollars.
www.econnewsletter.com/jul162011.html
The Pension Benefit Guaranty Corporation (PBGC) www.pbgc.gov/news/other/res/financial-condition.html is another example. It can only withstand one more large hit or so before it becomes bankrupt.
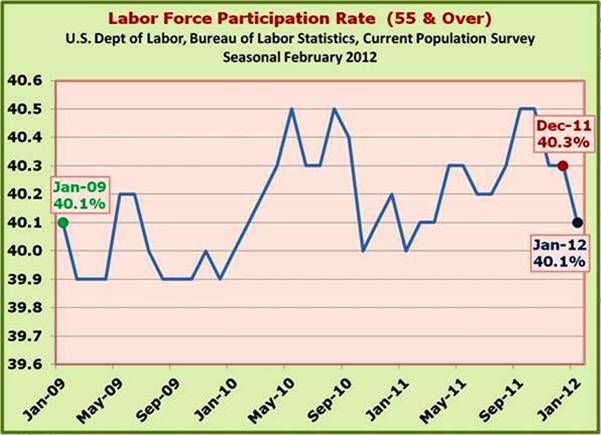
With regard to funding pensions in both the private and public sector, keep your eyes on the Labor Force Participation Rate (LFPR); the baby-boomers will have to maintain much higher rates going forward:
- The current LFPR for 55 and over is around 40%; in 1995, the number was 30%
- The LFPR for 65+ is 18% and in 1995 it was 12%
- For 75+ it is 7.5%; 1995 it was around 4.5%
To paraphrase the fellow in the Dos Equis beer commercials:
Stay healthy my friends www.youtube.com/watch?v=U18VkI0uDxE
Be sure to take a look at your population segment...