
2012 Volume Issue 7
March 15, 2012For a downloadable version, click the following:
WILL THE ECONOMIC ROAD TO RECOVERY FOR THE U.S. BE A ROUGH, ROCKY, AND UPHILL STRUGGLE?
Conference Board Economists: U.S. Economy Transitioning To A New Normal"The economy that we had before the recession is gone," said Kenneth Goldstein, economist at the Conference Board. "It's not coming back."The U.S. economy is transitioning to a new normal in which businesses invest less and consumers spend less than before the recession, Goldstein told The Huffington Post in an interview last week. As a result, he said, economic growth and job growth will be slower than before.
Fed officials, including Chairman Bernanke, have recently testified that the outlook for the job market and personal consumer spending is dismal.
Chairman Ben S. Bernanke: Semiannual Monetary Policy Report to the Congress (February 29, 2012 and March 1, 2012)
The unemployment rate remains elevated, long-term unemployment is still near record levels, and the number of persons working part time for economic reasons is very high.
Real household income and wealth were flat in 2011, and access to credit remained restricted for many potential borrowers.
Reporting by the media portrays little of such pessimism. What is really going on?
CHANGES IN THE EMPLOYMENT PICTURE
Civilian Noninstitutional Population
Civilian Labor Force
- Employed
- Unemployed
- Unemployment Rate
Not in Labor Force
- Labor Force Participation Rate
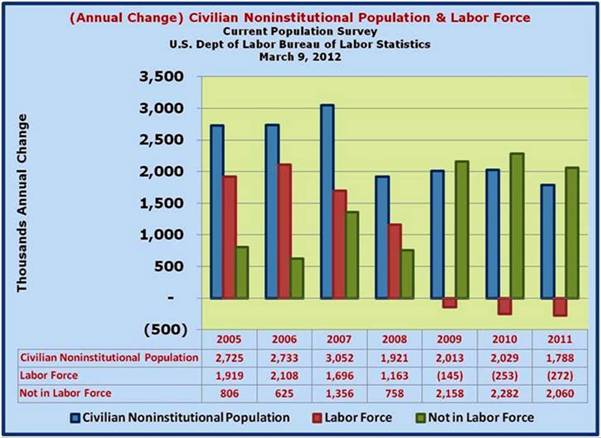
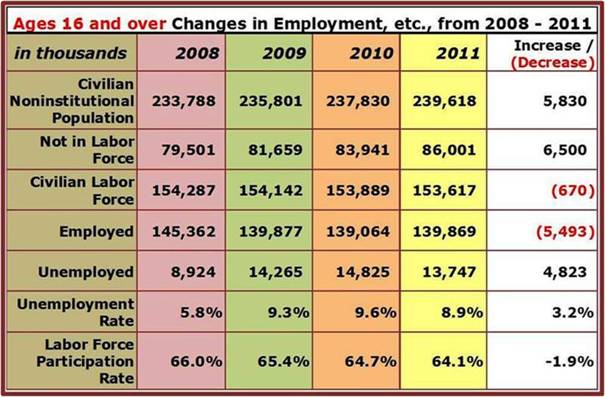
In 2009 there was a reduction in the Labor Force of 145,000; in 2010 a reduction 253,000; and 2011 a drop of 272,000. The last time there was a fall-off in the Labor Force was 1951 when it dropped by 191,000. This could have been related to the to the Korean War. From 1948 through 2011, the Labor Force has grown by around 1.5 million per year on average.
What this means is that in spite of adding 5.83 million to the Civilian Noninstitutional Population from 2009-2011, the Labor Force actually shrank by 670,000. Again, not only were the 5.8 million people (in a net sense) sidelined, but there were an additional 670,000 removed from the Labor Force for a total of 6.5 million that were added to those not in the Labor Force.
The Civilian Noninstutional Population (those 16 years and older, not in the military, incarcerated, etc.) consists of the Civilian Labor Force (Employed and Unemployed) and those not in the Labor Force (discouraged workers, retirees, stay at home spouses, etc.)
Summary – From 2008 through 2011
The Civilian Noninstitutional Population grew by 5,830,000; the Civilian Labor Force contracted by 670,000; and those ‘not’ in the Labor Force grew by 6,500,000. The net efect was a significant drop in the Labor Force Participation Rate. The Labor Force Participation Rate = Civilian Labor Force (Employed + Unemployed) / Civilian Noninstitutional Population
To make the effects more concrete, if we examine the negative impact on GDP both in total and on a per capita basis for the years 2009-2011 (using 2008 as a baseline when the Labor Force Participation Rate was 66% and the Unemployment Rate was under 6%), we can see how it increased the scarcity of goods and services facing the U.S. population. We will calculate this by estimating GDP per member of the labor force that is classified as employed and multiplying that figure by the shortfall of employment if the economy had achieved 6% unemplyment rate (the complement of an employment rate of 94%) and a labor force participation rate of 66%. By historical standards, these are rather modest goals.
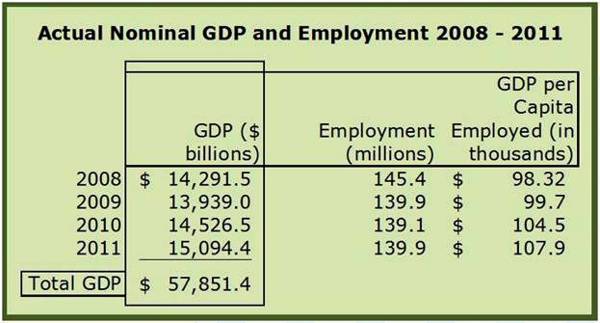
Year ending 2011 annual figures…
- In 2011, the Nominal GDP was $15.0944 trillion.
- The Civilian Noninstitutional Population was 239,618,000
- The Civilian Labor Force was 153,617,000 (with 139,869,000 Employed, and 13,747,000 Unemployed)
- The Labor Force Participation Rate = Civilian Labor Force / Civilian Noninstitutional Population
- The Labor Force Participation Rate = 153,617,000 / 239,618,000
- The Labor Force Participation Rate = 64.1%
- The U-3 Unemployment Rate = Unemployed / Civilian Labor Force
- The Unemployment Rate = 13,747,000 / 153,617,000
- The Unemployment Rate = 8.9%
1) Current Per Capita (Employed) GDP = GDP / Employed
- = $15.0944 trillion /139,869,000
- = $107,918 GDP / Employed
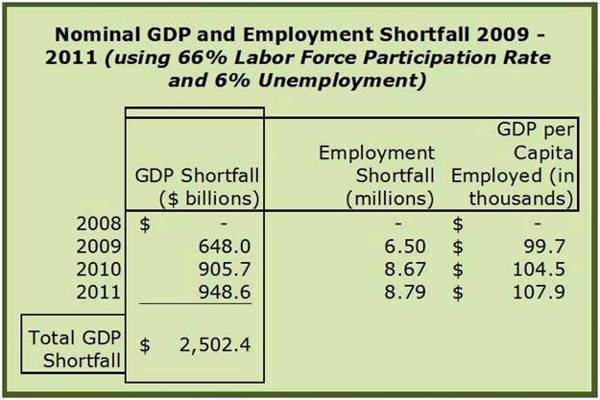
2) If the Labor Force Participation Rate was 66.0% and the Unemployment Rate was 6.0%...
- Civilian Noninstitutional Population 239,618,000 X 66.0% = 158,148,000 Labor Force
- Unemployment Rate = Unemployed / Labor Force
- 6% = Unemployed / 158,148,000
- Unemployed = 6% X 158,148,000
- Unemployed = 9,488,880
- Employed = Labor Force - Unemployed
- Employed = 158,148,000 – 9,488,880
- Employed = 148,659,000
3) Change in Employed [adjusted for 66% Labor Force Participation Rate and 6.0% Unemployment Rate] = (148,659,000 – 139,869,000)
- Change in Employed = 8,790,000
- Using GDP per Employed of $107,918…
- 8,790,000 X $107,918 = $948.6 billion of GDP (or 6.3% of the 15,094 billion total GDP) that could be added if 8.79 million were employed and contributing to the GDP at the same current rate!
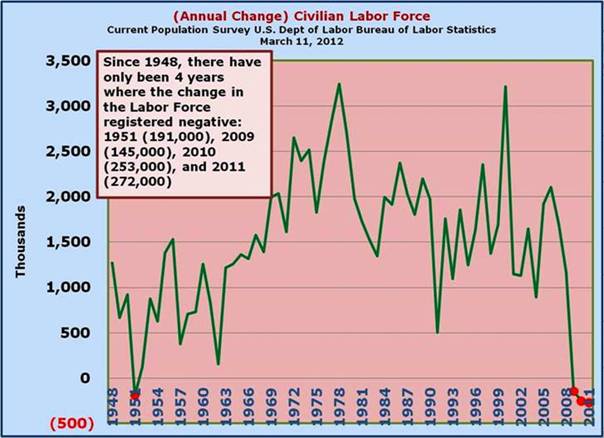
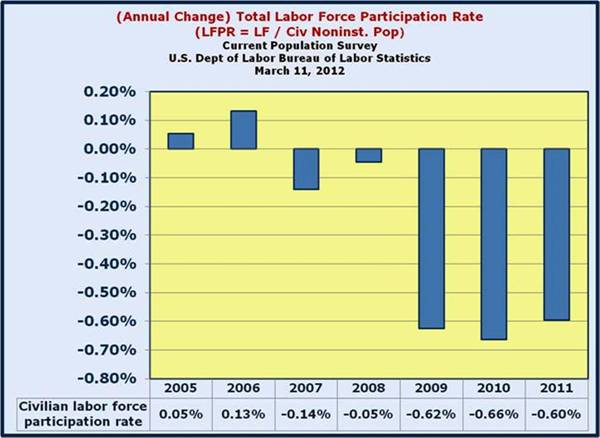
Prior to 2009, a negative annual change in the Labor Force has only occurred once, in 1951, since the Bureau of Labor Statistics began reporting it in 1947. Beginning with 2009, it has turned negative for three consecutive years.
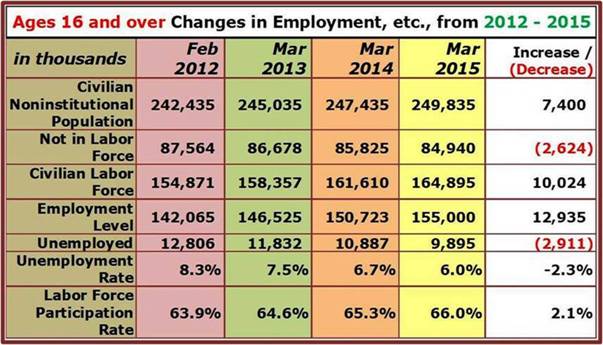
Ages 16 and Over (the overall Employment Picture)
Again from 2008 through 2011, the Civilian Noninstitutional Population grew by 5,830,000 while the Civilian Labor Force contracted by 670,000 resulting in 6.5 million people being sidelined or added into the ‘Not in the Labor Force’ portion of the Civilian Noninstitutional Population (Civilian Noninstitutional Population = those not in the Labor Force and those in the Labor Force). The employment level dropped by 5,493,000 and unemployment increased by 4,823,000 contributing to an increase of unemployment rate by 3.2%, from 2008 to 2011.
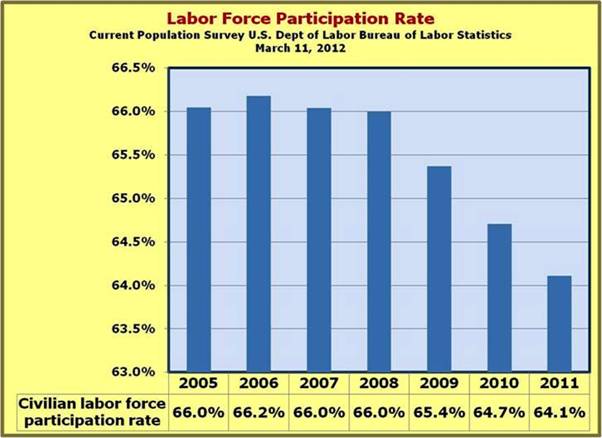
The Labor Force Participation Rate is the ratio between the Civilian Labor Force and the Civilian Noninstitutional Population. In the following chart we are showing the annual change in Labor Force Participation Rate from 2005 through 2011. Our reference to a negative annual marginal LFPR or marginal Labor Force Participation Rate helps to explain why there has been such a precipitous drop in the overall Labor Force Participation Rate over the last few years.
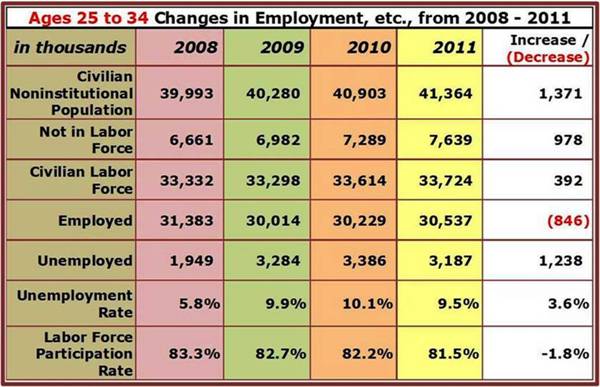
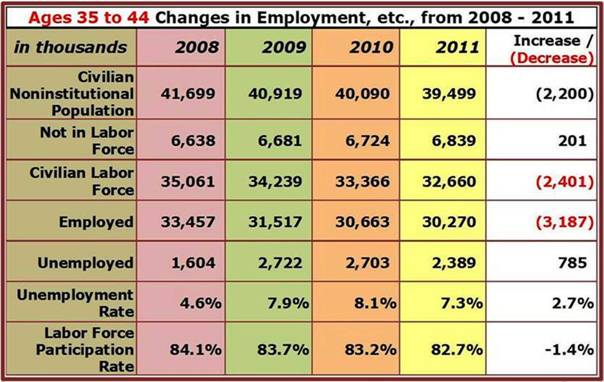
In the following graphs we drill down on employment changes from 2008-2011 for various age groups, ranging from 16-24 to 65 and over. Pay particularly close attention to the net change column on the right, especially the Unemployment Rates and the Labor Force Participation Rates.
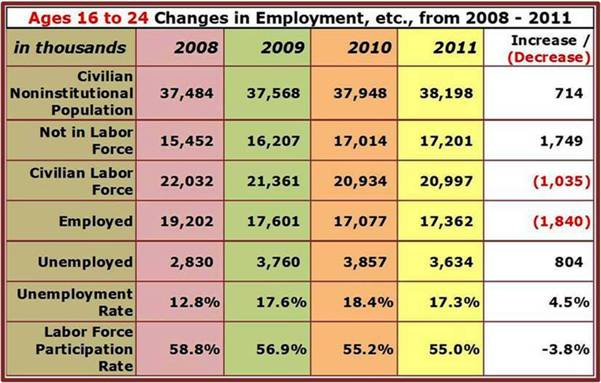
Ages 16 to 24
From 2008 through 2011, the Civilian Noninstitutional Population grew by 714,000 while the Civilian Labor Force contracted by 1,035,000 resulting in 1,749,000 million people being sidelined or added into the ‘Not in the Labor Force’ portion of the Civilian Noninstitutional Population (Civilian Noninstitutional Population = those not in the Labor Force and those in the Labor Force). While some of those in this youngest employment cohort opted to go to school (as typically happens when the economy deteriorates), the unemployment rate hike of 4.5% from 12.8% in 2008 to 17.3% in 2011 highlights the gravity of the problem. On a brighter note, the unemployment rate dropped 1.1% from 2010 to 2011.
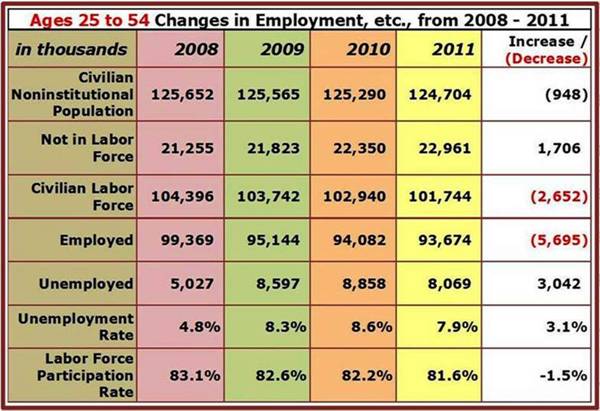
Ages 25 to 54
From 2008 through 2011, the Civilian Noninstitutional Population declined by 948,000 as the baby-boomers (born 1946 through 1964) continued moving into the 55 and over grouping. While the pain of the deterioration in the Employment Picture runs throughout the various age groups, it is in the 25 through 54 segment which are really the prime earning years and are reflected in the very high Labor Force Participation Rate. The problem of course is that this portion of the population was affected the most by the economic collapse. In 2011, this segment (124,704,000) comprised 52% of the Civilian Noninstitutional Population (239,618,000), but accounted for 59% of the unemployed (8,069,000 of the 13,747,000 total unemployed).
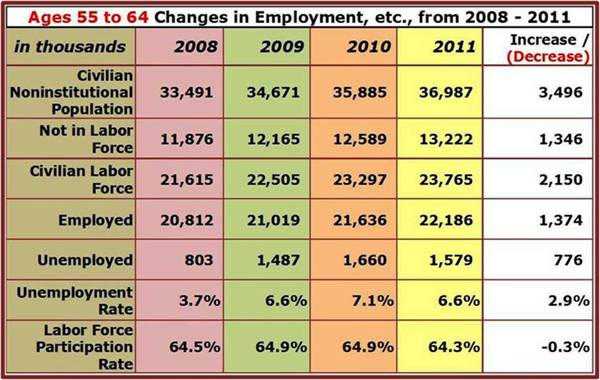
Ages 55 and over
From 2008 through 2011, the baby-boomers (born 1946 through 1964) rolled into this age group, expanding it by 8.5%, from 70,652,000 in 2008 to 76,716,000 in 2011, a 6,064,000 increase. While the younger age groups experienced massive deterioration in terms of the Labor Force, Employment, Unemployment Rate, and the Labor Force Participation Rate, the 55 and older segment showed remarkable improvements in all of those categories.
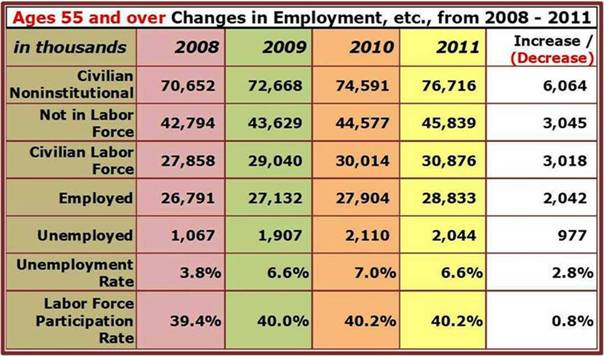
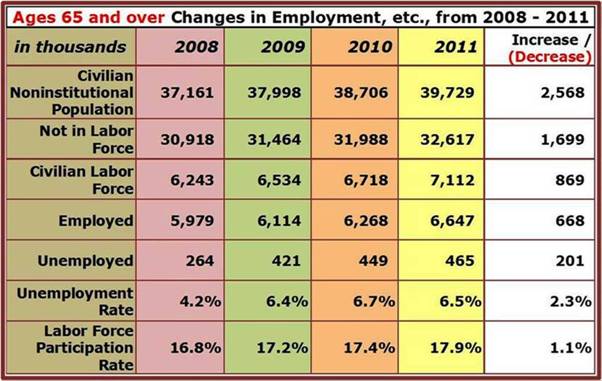
Again, in the following tables we include data reflecting narrower age groupings for the employment picture so that you can see where you fit into the scheme of things. We will leave the exploring up to you, but it is remarkable to note that the 65 and over was the only segment to experience a rising Labor Force Participation Rate. Seniors are rejoining (or never leaving) the working ranks. This might be due to the economic hardship, the desire to continue working, pension shortfalls, etc. We will be addressing the pension issue very soon. There are many more observations, but we’ll leave it at that.
Be sure to scroll down to the bottom for some final words on how a recovery will look.

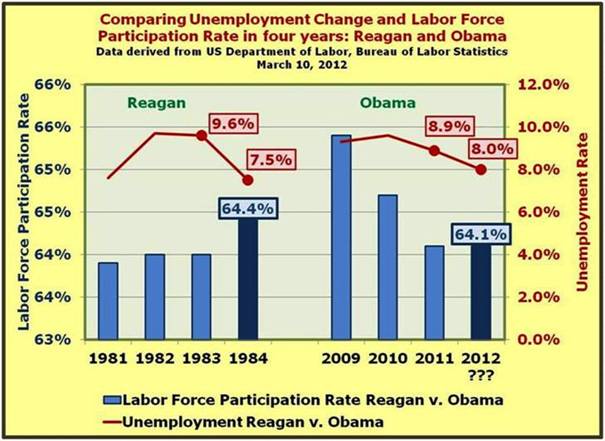
Tale of the Tape…Reagan – Obama
A quick look back at challenging times for two presidential administrations.
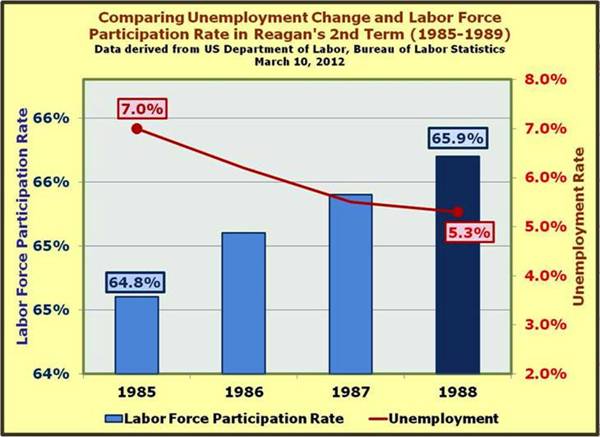
Both Reagan and Obama were beset with economic challenges in their respective administrations. Under Reagan’s watch, from 1985 through 1988, the Unemployment Rate went from 7% to 5.3% and the Labor Force Participation Rate went from 64.8% to 65.9%.
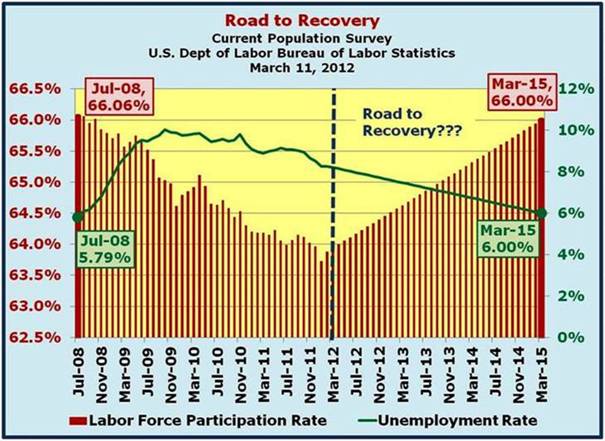
Road to Recovery by March 2015, or wishful thinking?
- 6.0% Unemployment
- 66.0% Labor Force Participation Rate
- Employed increasing 12.9 million
- Unemployed falling by 2.9 million
- Labor Force expanding by 10 million
A hopeful(?) scenario…assuming the following:
- Civilian Noninstitutional Population expands by 200,000 per month
- Unemployment Rate falls by 0.06% per month
- Labor Force Participation Rate improves by 0.057% per month
The likelihood of a U.S. economy recovery as depicted above really depends on the extent that we aggressively pursue policies aimed at growing the GDP at a more rapid pace, focusing on economic expansion and fostering a more competitive economic environment. We will be posting articles relating to the American Economic Vision going forward very soon.
