
2013 Volume Issue 11
September 8, 2013
For a downloadable version, click the following:
…a bit more compressed version of the PDF
Yet Another Lousy Jobs Report…but how can that be with a lower unemployment rate and growth in payroll jobs?
When we first saw the August 2013 Employment Situation Report from the U.S. Department of Labor, Bureau of Labor Statistics, we were appalled at the numbers revealed on the summary table (page 4 of the report – Household Summary Table A):

Let’s walk through this quickly…
The Civilian Noninstitutional Population (16+ year olds) is comprised of the Civilian Labor Force (those Employed and those Unemployed seeking employment) and the ‘Not in the Labor Force’ component of the Civilian Noninstitutional Population (those 16+ years olds who are neither employed nor unemployed seeking employment).
So while there were 203,000 added to the Civilian Noninstitutional Population for the month of August, a total of 312,000 left the Labor Force. This means that was a net increase of 516,000 (rounding) in the ‘Not in the Labor Force component of the Civilian Noninstitutional Population. Again, on a net basis, 203,000 people entered the Civilian Noninstitutional Population but did not join the Labor Force. In addition 312,000 people left the Labor Force, the combined net effect was that the ‘Not in the Labor Force’ component of the Civilian Noninstitutional Population swelled by 516,000 for the month of August.
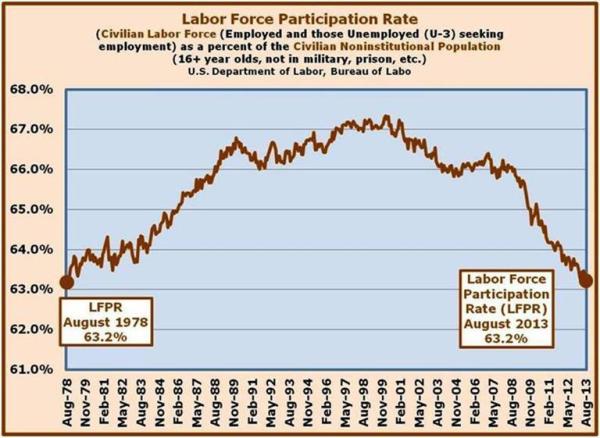
The next item is the Labor Force Participation Rate (LFPR), which is arrived at by dividing the Labor Force (those Employed and those Unemployed seeking employment) into the Civilian Noninstitutional Population. The Labor Force shrank by 312,000 (-115,000 Employed + -198,000 Unemployed rounded to -312,000 total) for the month of August and the Civilian Noninstitutional Population grew by 203,000. The LFPR dropped from 63.4% in July to 63.2% in August which was its lowest reading since August 1978.
While the Labor Force Participation Rate dropping to a 35-year low is compelling enough, if we take into consideration the marginal change in the LFPR over a period of time, the fall-off is even more troubling.
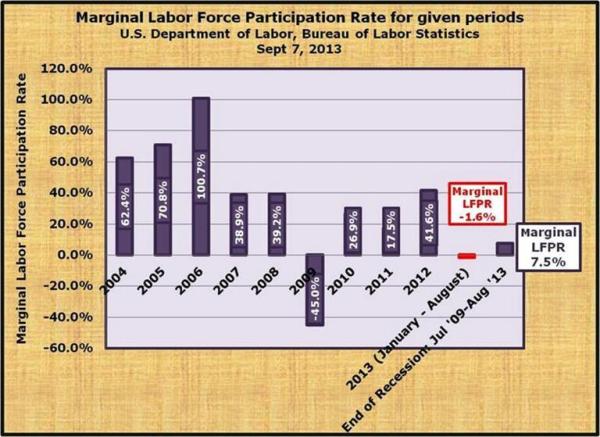
What we mean by the ‘Marginal Labor Force Participation Rate’ is that when we look at the change in the Civilian Labor Force as a percent of the change in the Civilian Noninstitutional Population over a specified period of time, it is easier to identify those movements. The Labor Force Participation Rate for 2007 was 66.0% (66 out of every 100 people in the Civilian Noninstitutional Population were either employed or unemployed but seeking employment the U-3 Unemployment Rate was 4.6%).
Since the end of the Recession in June 2009 the Marginal Labor Force Participation Rate was a horrible 7.5% (July 2009 through August 2013). From July 2009 through August 2013 the Labor Force expanded by 776,000, while the Civilian Noninstitutional Population grew by 10,304,000 (776,000 / 10,304,000).
From January 2013 through August 2013 the Marginal Labor Force Participation Rate was a negative 1.6%, registering -25,000 and Civilian Noninstitutional Population rose by 1,609,000 (-25,000 / 1,609,000).
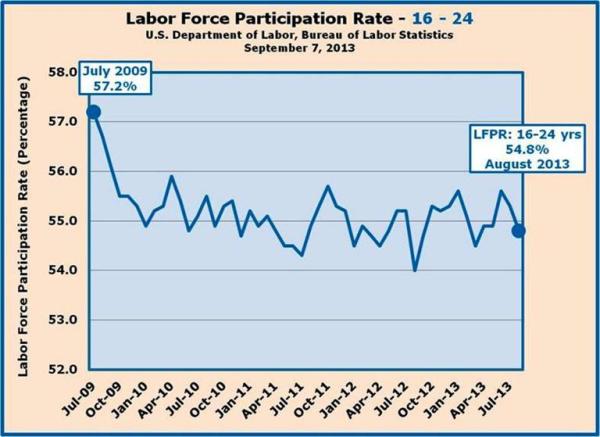
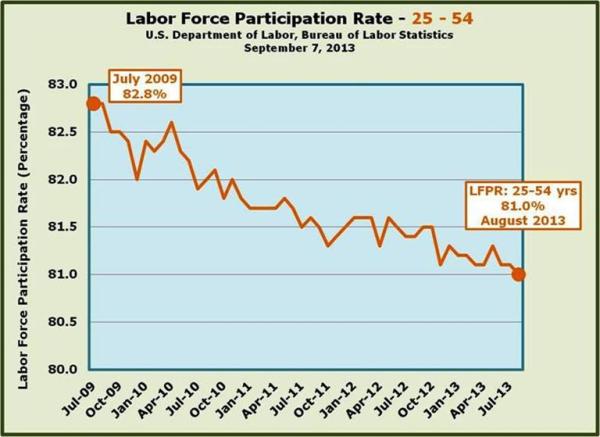
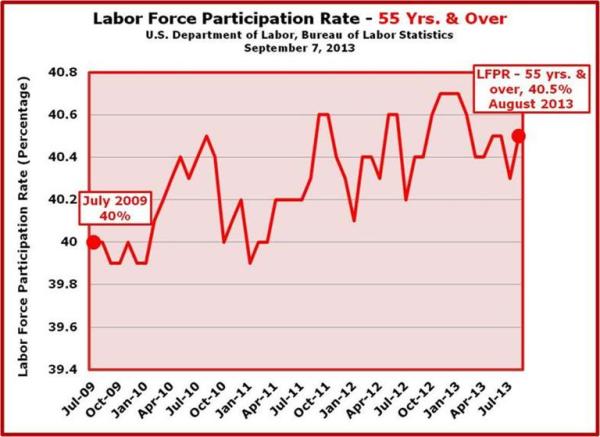
While many have passed this massive movement out of the Labor Force off as being driven primarily by Baby-boomers retiring (born 1946 – 1964), the truth is that 55 and older group have held their own, while the younger cohorts (16-24 yr olds and 25-54 yr olds) have lost ground.
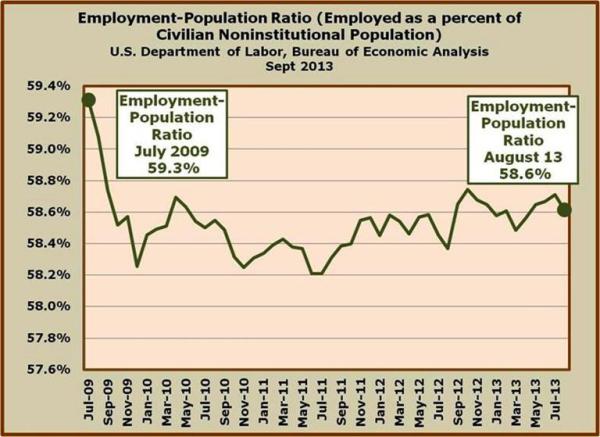
Keeping in mind that FED (as in the Federal Reserve System) keeps a close eye on the employment situation, especially the Employment-Population Ratio, which compares employment levels to the Civilian Noninstitutional Population. Historically (from 2001 – 2008), the Employment-Population Ratio registered in the 62 to 63% range. As late as December 2008, it was 61%. Since this last month dipped from 58.7% down to 58.6%, there’s reason to believe that the FED is less likely to implement restrictive monetary policies – at least for the next month or so.
In the arena of the employed or employment numbers we seemingly have conflicting reports for August 2013. On the one hand, in the Payroll (CES) Survey, we have a published payroll report touting 169,000 new jobs in August 2013 (we’ll get to the unemployment rate shortly), while we have 115,000 jobs lost in the Household (CPS) Survey:
August 2013 Employment Situation Report
"Total nonfarm payroll employment increased by 169,000 in August, and the unemployment rate was little changed at 7.3 percent. Employment rose in retail trade and health care but declined in information."
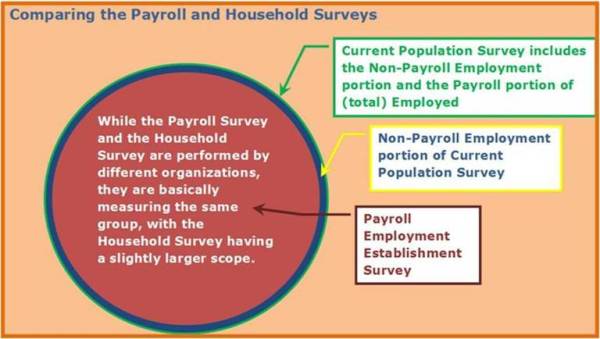
We’ve discussed the differences between the Payroll (Current Employment Statistics or CES) Survey and the Household (Current Population Survey or CPS) on numerous occasions…what it boils down to is that the Payroll Survey targets businesses (establishments) that are typically larger, tracking such things as hours worked, overtime, etc., in addition to the number of workers employed for the month. The Household Survey contacts people directly, querying them on their job status, etc., for the month. The scope of the Household Survey is a bit larger than the Payroll Survey in that includes those workers from the latter as well as self-employed, small businesses, farm-workers, etc.
http://www.bls.gov/ces/cesfaq.htm
What is the establishment payroll survey?
The establishment payroll survey, known as the Current Employment Statistics (CES) survey, is based on a survey of approximately 141,000 businesses and government agencies representing approximately 486,000 worksites throughout the United States. The primary statistics derived from the survey are monthly estimates of employment, hours, and earnings for the Nation, States, and major metropolitan areas. Preliminary national estimates for a given reference month are typically released on the third Friday after the conclusion of the reference week; i.e., the week which includes the 12th of the month, in conjunction with data derived from a separate survey of households, the Current Population Survey (CPS). The CPS is the source of statistics on the activities of the labor force, including unemployment and the Nation's unemployment rate.
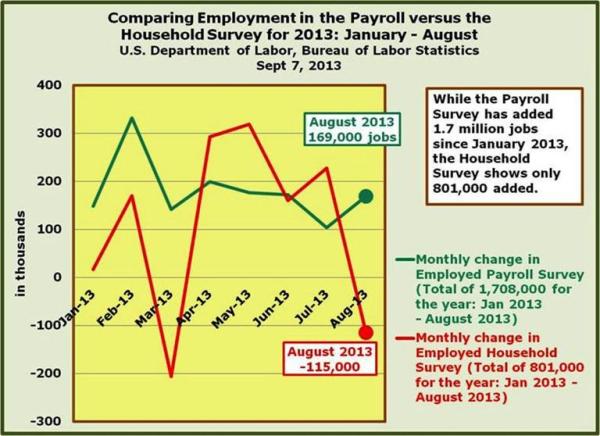
While people can argue about which employment measure is more useful, the fact remains that over time, they tend to mirror one another (with the Payroll portion equating to about 95% of the Household Survey). For the month of August 2013, while the Payroll Survey Employment shows a growth of 169,000, the Household Survey’s ‘Employed’ shows a drop of 115,000. The difference can be partly attributed to timing or statistical error, but the majority of the number is due to the job losses from outside of the realm of the Payroll Survey. Keep in mind that that the preceding discussion regarding the Payroll Survey remains within the scope of the Household Survey (or more specifically, outside of the Payroll Survey Employment measure of the Household Survey).
November 17, 2012
Moving the Jobs Needle: Where the heck are we, really? Where do we have to go and how do we get there?
www.econnewsletternov172012.com/
As it turns out, over time, the two surveys pretty much run parallel, with the Current Population Survey measuring a slightly larger swath of the population due to its coverage of farm workers, self-employed or otherwise small firms not tallied by the Payroll Survey or Establishment Survey (Current Employment Statistics). Historically, the Establishment Survey covers about 94 to 95% of the Current Population Survey. In October 2012 the Establishment Survey only covered 93.3% of the Current Population Survey. It is with this in mind; moving back to at least the 94% range, that we assume job growth of 330,000 per month in the Current Establishment Statistics or Payroll Survey which will be slightly higher than the 325,000 monthly employment growth targeted in Current Population or Household Survey over the next 48 months.
So how is it that a falling unemployment rate is not such a great thing?
Well, at first blush, a downward move from 7.4% in July 2013 to 7.3% in August 2013 would certainly indicate good news, right?
Unemployed fell by 198,000 for the month of August, but the Employed also fell by 115,000. This means that on a net basis, those 198,000 that left the ranks of the unemployed joined the 115,000 in the employed group in departing from the Labor Force entirely. The 313,000 movement from the Labor Force (-198,000 Unemployed + -115,000 Employed), joined with the 203,000 new adds to the Civilian Noninstitutional Population to swell the ranks of the ‘Not in the Labor Force’ portion of the Civilian Noninstitutional Population by 516,000!
Since the U-3 Unemployment Rate is equal to the Unemployed divided by the Civilian Labor Force, and the Unemployed fell by 198,000 and the Labor Force fell by 313,000, it’s only natural that this would drive down the Unemployment Rate – which it did, moving from 7.39% down to 7.28%...
In spite of the seemingly small movement, this is really quite a large swing, owing to the large number of folks departing the Labor Force.
To put the unemployment situation into perspective, we have included a graphic, wherein we chose to show what the U-3 Unemployment Rate might be using the Labor Force Participation Rate [Labor Force (Employed + Unemployed seeking employment) / Civilian Noninstitutional Population] from July 2009 (65.5%); the end of the Recession http://money.cnn.com/2010/09/20/news/economy/recession_over/index.htm, according the National Bureau of Economic Research (NBER).
In July 2009, with a 65.5% Labor Force Participation Rate (LFPR), the U-3 Unemployment Rate stood at 9.5%. By August 2013, the U-3 Unemployment Rate fell to 7.3% - hooray! Not so fast…by simply adjusting the LFPR to the July 2009 (end of the recession) level, the August 2013 U-3 Unemployment Rate would have come in at 10.5%, a full percentage point increase over the July 2009 level and 3.2% higher than the current actual.

There is much more ground to cover in digging into the labor market numbers. In the future, we plan on focusing more attention on the various age groups and other aspects of the available data. The bottom line is that while the media has seemed to focus on a modest rebound in the job market (as indicated by the Payroll Report and U-3 Unemployment Report), the truth is that there really hasn’t been a rebound at all if we dig into the numbers a bit.
Keep focusing on the Employment Status: Household Summary Table A; that will provide the most insight into how the labor market is actually performing.
