2014 Volume Issue 11
NOVEMBER 6, 2014
For a downloadable version, click the following:
…a bit more compressed version of the PDF
Breaking down the Civilian Noninstitutional Population and Labor Markets by Age and Gender – or why the Fed is less likely to completely/permanently break away from Quantitative Easing
We’ve been trying to adequately explain the condition of the U.S. labor markets for a number of years – going back at least to 2010 (www.econnewslettermay122010.com/) in pointing out the fall off in the Labor Force Participation Rate (LFPR) among other issues. Here’s a quick background.
While the media has focused on job growth and a falling unemployment rate, a robust Wall Street, and a low but relatively strong GDP as measured against the rest of the world, the fact is that the underlying weakness in the labor markets have continued to stay the FED’s (Federal Reserve System, the central bank of the U.S.) efforts to permanently back out of the quantitative easing mode, while maintaining its huge portfolio of securities. Keep in mind that the FED has now gone through three rounds of quantitative easing programs, with (at times) several month pauses between each phase.
What this points to is a very frail economy that hasn’t gained enough strength to grow out of the malaise brought on by the so-called Great Recession: (http://en.wikipedia.org/wiki/Great_Recession) “According the U.S. National Bureau of Economic Research (the official arbiter of U.S. recessions) the US recession began in December 2007 and ended in June 2009, and thus extended over 18 months.”
The FED would like to begin considering moving toward at least a soft landing, or a more restrictive monetary policy stance in the event inflationary pressures warrant such actions. Recall that its portfolio due to a succession of QEs has grown to around $4.5 trillion (up from around $700-$800 billion prior to reacting to the financial crisis in late 2008). The FED’s fallback position regarding its targeted inflation rate remains very low – the CPI registered 0.1% for the month of September 2014, remains well under the FED’s target of around 2% [Why does the Federal Reserve aim for 2 percent inflation over time? --- “The Federal Open Market Committee (FOMC) judges that inflation at the rate of 2 percent (as measured by the annual change in the price index for personal consumption expenditures, or PCE) is most consistent over the longer run with the Federal Reserve's mandate for price stability and maximum employment.”].
Consumer Price Index Release
U.S. Department of Labor, Bureau of Labor Statistics
www.bls.gov/news.release/cpi.nr0.htm
10/22/2014
On a seasonally adjusted basis, the Consumer Price Index for All Urban Consumers increased 0.1 percent in September after declining 0.2 percent in August. The index for all items less food and energy rose 0.1 percent in September after being unchanged in August.
While the near-term FED monetary policy changes remains to be seen, it’s apparent that there is some degree of hesitancy in discontinuing the Quantitative Easing Program(s) entirely.
www.bloomberg.com/news/2014-10-16/bullard-says-fed-should-consider-delay-in-ending-qe.html
Bullard Says Fed Should Consider Delay in Ending QE
Oct 16, 2014
Inflation expectations are declining in the U.S.,” he said in an interview today with Bloomberg News in Washington. “That’s an important consideration for a central bank. And for that reason I think that a logical policy response at this juncture may be to delay the end of the QE.
Remember that all of this is juxtaposed to the FOMCs (Federal Open Market Committee) overtures at scaling back the latest version of quantitative easing, QE 3, or www.federalreserve.gov/newsevents/press/monetary/20140917a.htm
FOMC (Federal Open Market Committee)
Release Date: September 17, 2014
The Committee [FOMC – Federal Open Market Committee] currently judges that there is sufficient underlying strength in the broader economy to support ongoing improvement in labor market conditions. In light of the cumulative progress toward maximum employment and the improvement in the outlook for labor market conditions since the inception of the current asset purchase program, the Committee decided to make a further measured reduction in the pace of its asset purchases. Beginning in October, the Committee will add to its holdings of agency mortgage-backed securities at a pace of $5 billion per month rather than $10 billion per month, and will add to its holdings of longer-term Treasury securities at a pace of $10 billion per month rather than $15 billion per month.
Note: the QE 3 program noted above, began in September 2012 and included monthly purchases of $40 billion of agency MBS (mortgage-backed securities) and $45 billion of U.S. Treasury Securities…they began tapering at the end of 2013 and are/were scheduled to halt it altogether in October 2014.
FED Monetary Policy Tools
As we’ve pointed out on numerous occasions, the FED has a slew of options at its disposal, especially geared toward and suited to driving up interest rates for the purpose of stanching inflationary pressures.
www.federalreserve.gov/monetarypolicy/policytools.htm
The Federal Reserve has a variety of policy tools that it uses in order to implement monetary policy.
- Open Market Operations
- Discount Rate
- Reserve Requirements
- Interest on Required Reserve Balances and Excess Balances
- Overnight Reverse Repurchase Agreements
- Term Deposit Facility
- Expired Policy Tools
The Mercurial Labor Markets
So how does all of this tie into the labor markets? It’s clear that while the FED says in the FOMC Statement on Sept 17, 2014 that it was prepared to scale back its purchases based on signs of strengthening labor market; it quickly ducks for cover, changing its position a few weeks later in St. Louis FED President Bullard’s comments, pointing to continued low inflation levels as a reason to continue with the ‘Quantitative Monetary Easing’ program or even adding to it.
FOMC Press Release Oct 29, 2014
www.federalreserve.gov/newsevents/press/monetary/201401029a.htm
It has to be said that the FED (FOMC) officially noted in its meeting minutes from Oct 29, 2014 that “The Committee judges that there has been a substantial improvement in the outlook for the labor market…Accordingly, the Committee decided to conclude its asset purchase program this month.”
Labor Force Participation Rate fall-off due to Baby-Boomer Retirements?
When we begin looking at issues regarding the current and ongoing economic underperformance we have been criticized for pointing out that the Labor Force Participation Rate (the Labor Force (those employed and those unemployed) as a percent of the Civilian Noninstitutional Population) has fallen from the 66% and higher rate prior to 2009 range to the current 62.7% rate in September 2014 (the lowest rate since 1978). Conventional wisdom points to the fact that the Baby Boomers (born 1946–1964) are rolling past the 65 year age mark (retirement age) at a rate of 10,000 per day according to the Pew Research Institute beginning in January 2011 www.pewresearch.org/daily-number/baby-boomers-retire/) for the next 19 years.
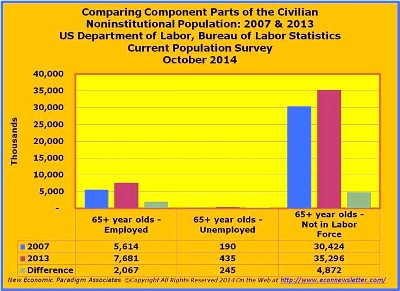
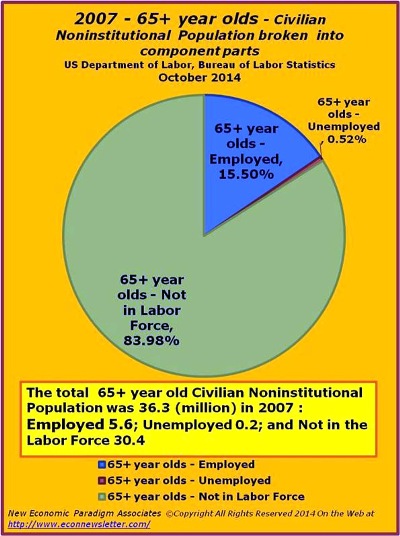
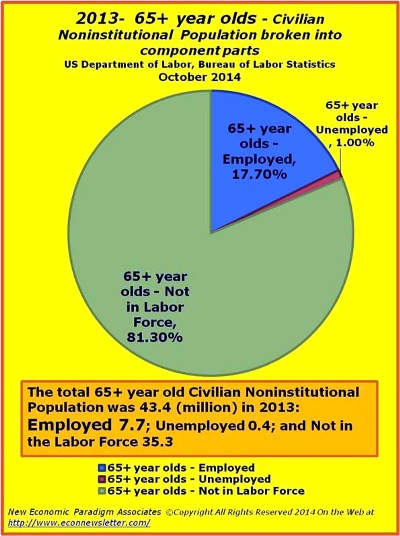
The reality is that while the 65+ group is certainly expanding, the Labor Force Participation Rate for that group is also growing. The truth is that since January 2009, the LFPR for the 65+ age group is the only population segment that has experienced growth.
When UP is DOWN and DOWN is UP: September 2014 Labor Report
October 12, 2014
www.econnewsletteroct122014.com/
The collapsing LFPR [Labor Force Participation Rate] has been blamed on an aging population (Baby Boomers born 1946-1964), but the fact is that the participation rate for the 65+ has actually been increasing significantly, while the LFPRs for younger population segments have been shrinking, as has been reflected in the less than robust labor markets.
Continued Confusion with the Labor Force Participation Rate (LFPR)
For some reason the discussions relating to the Labor Force Participation Rate have not really resonated in the media or with the public in general for that matter. In going over this issue we’ve concluded that we have to present a bit more detail illustrating the impact on the labor markets, something that captures the “improved” unemployment rate as well as the “growth” in employment. Given that these two measures are highlighted on a very regular basis as pointing to the strengthening labor markets, we’d like you to see the following charts to see how the unemployed and employed, along with the other portions of the employment picture [Civilian Noninstitutional Population=Civilian Labor Force (employed + unemployed) and the Not in the Labor Force] actually stacks up over the last several years.
Breaking down the Labor Force Participation Rate by Age and Gender
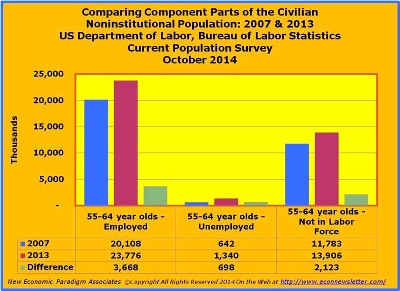
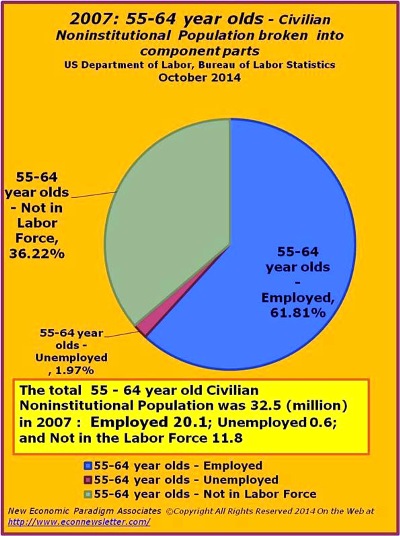
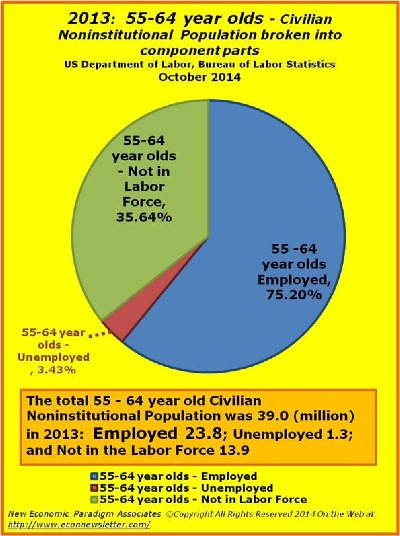
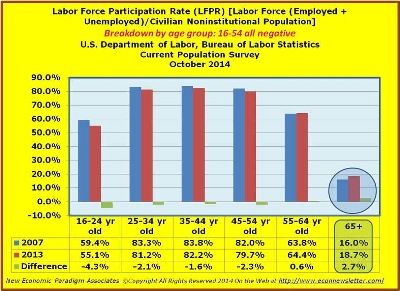
The Labor Force Participation Rate (LFPR) is typically shown in its totality, measured using the entire Civilian Noninstitutional Population (ages 16+). The LFPR is equal to the Labor Force (Employed + Unemployed) divided by the Civilian Noninstitutional Population, 16 years and over. In looking at the data going from 2007 through 2013, the Labor Force Participation Rate for 16 years and older dropped from 66.0% to 62.7. In drilling down by various age segments – the Bureau of Labor Statistics breaks down the groups in ten year segments (except for the 16-24 year age group), ranging from 16 through 64, it is readily apparent that the younger groups (16-54) have really taken a major hit over the last six years from 2007 through 2013. It is interesting to note that those ages 55 and older have actually improved since 2007. The clear message is that the younger age groups have been more negatively impacted by issues with labor markets.
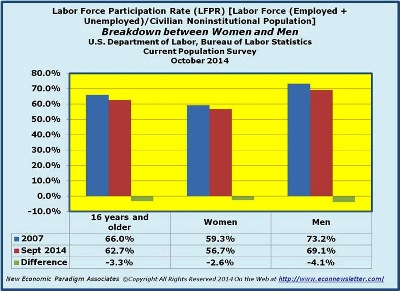
In looking at the breakdown between female and male, it is clear that both groups have been negatively affected by the falling Labor Force Participation Rate since 2007, with men being more adversely affected by the weak labor markets.
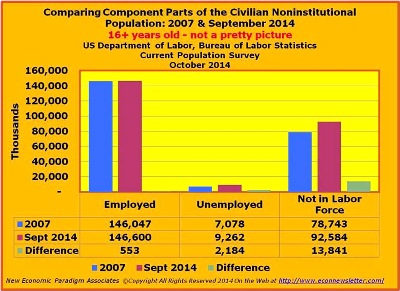
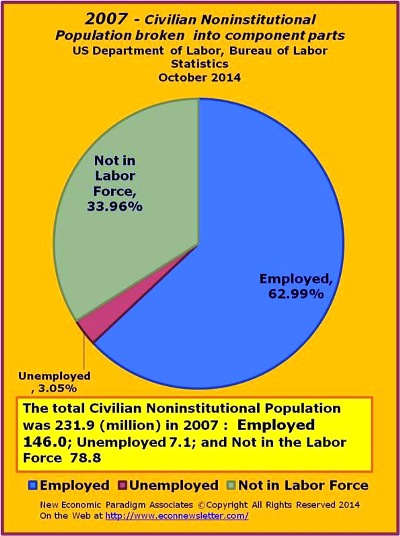
Civilian Noninstitutional Population: Employed + Unemployed + Not in the Labor Force
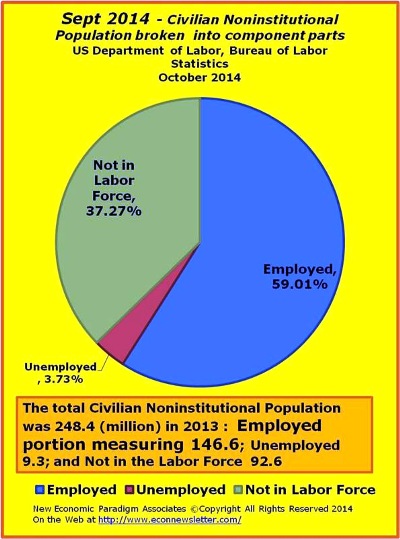
Between 2007 and September 2014, the Civilian Noninstitutional Population grew by 16.6 million: with 0.6 million added to Employed; 2.2 million added to Unemployed; and 13.8 million to the ‘Not in the Labor Force’ segment.
For all of the talk of millions of new jobs added over the past several years, it is important to note the Employed number has only reached the 2007 level in the last few months – yes, that is five plus years later
The employed number has recently passed the 2007 level, crossing back over the 146 million mark in June 2014, after having fallen to under 139 million in 2009 and 2010. In the meantime, the unemployed level has fallen to 9.3 million, from a high of more than 15 million in 2009 and 2010. Finally, the ‘Not in the Labor Force’ component of the Civilian Noninstitutional Population has gone from under 80 million in 2007 to 92.6 million in September 2014, growing by 13.8 million.
While it’s certainly troubling to see that the employed number has only recently passed the pre-recession level (Great Recession, dating from December 2007 – June 2009 per the National Bureau of Economic Research), and the unemployed level is 2.2 million higher than those levels, the real issue is revealed in the number of people in the Civilian Noninstitutional Population who are no longer in the labor force at all: 13.8 million more in the Not in the Labor Force category.
Marginal Labor Force Participation Rate between 2007 through September 2014 – measuring the change
Focusing just on the marginal Labor Force Participation Rate (keying in on the change between 2007 and September 2014, [Labor Force 2.7 million (Employed 553,000 + Unemployed 2,184,000)] / Civilian Noninstitutional Population 13.8 million = 19.8% Marginal Labor Force Participation Rate.
The low marginal Labor Force Participation Rate is what drove the LFPR in 2007 registering 66.0% down to 62.7% in September 2014. The 62.7% Labor Force Participation Rate is the lowest since February 1978. It has to be noted that this anemic LFPR has not shown any signs of recovery, in spite of the fact that employment has rebounded and the unemployment rate has fallen. What all this adds up to is that the employment has simply not grown sufficiently. To get us back to the 66% LFPR level of 2007, the employed number would have to be at least 17 million higher – yes, we are 17 million jobs short today! Just to get us back to that (2007) 66% level, we would have to grow at a rate of more than 415,000 each month for the next 60 months (25 million jobs in 5 years) – assuming that we continue to add around 200,000 to the Civilian Noninstitutional Population each month.
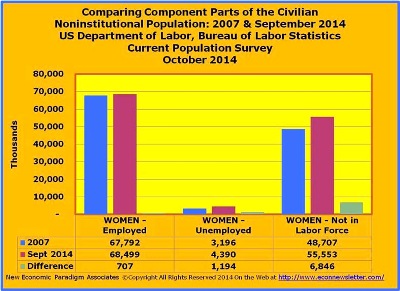
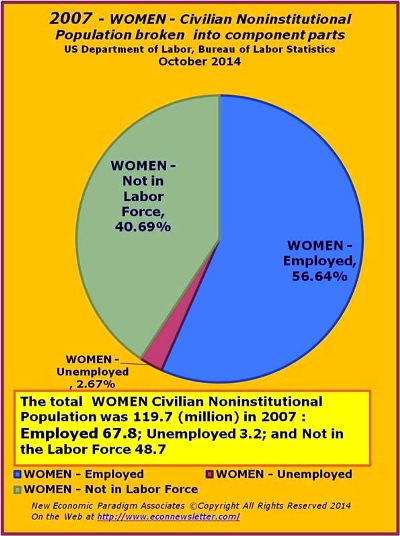
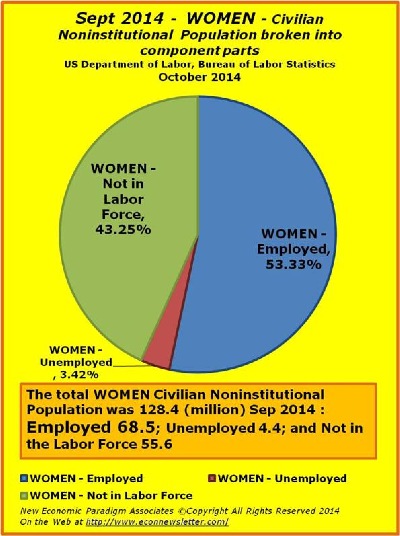
WOMEN in the Labor Markets: Changes from 2007 through September 2014: 27.8% Marginal Labor Force Participation Rate
Let’s just focus on the marginal Labor Force Participation Rate (keying in on the change in the measured data between 2007 and September 2014, [Labor Force 1.9 million (Employed 0.7 million + Unemployed 1.2 million)] / Civilian Noninstitutional Population 8.7 million = 27.8% Marginal Labor Force Participation Rate. The low marginal Labor Force Participation Rate is what drove the LFPR in 2007 registering 59.3% down to 56.7% in September 2014. The 56.7% Labor Force Participation Rate is the lowest since September 1988.
The need to grow more jobs
It has to be noted that this anemic LFPR has not shown any signs of recovery, in spite of the fact that employment has rebounded and the unemployment rate has fallen. What all this adds up to is that the employment has simply not grown sufficiently. To get us back to the 66% LFPR level of 2007, the employed number would have to be at least 7.7 million higher – yes, 7.7 million! Just to get us back to that (2007) 59.3% level, we would have to grow at a rate of more than 190,000 each month for the next 60 months (11.5 million jobs in 5 years) – assuming that we continue to add around 110,000 to the Civilian Noninstitutional Population each month.
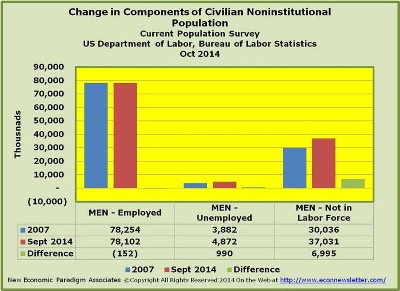
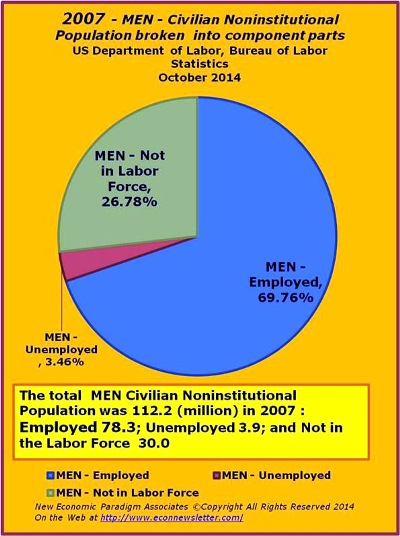
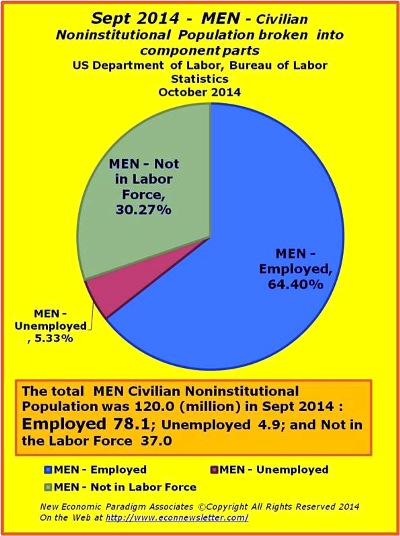
MEN in the Labor Markets: Changes from 2007 through September 2014: it’s not just a war on women
A few things to note regarding the labor markets for Men 16+:
- The labor market for men in 2014 is beyond dismal. The Labor Force Participation Rate has been hovering in the 69.1- 69.3% range for the last 12 months (it was above 73% in 2007). This sub 70% LFPR is the lowest EVER recorded by the Bureau of Labor Statistics, going back to 1948.
If there’s a war on women, then men have certainly already lost their struggle in the labor markets.
- The marginal Labor Force Participation Rate (again, keying in on the change between 2007 and September 2014, [Labor Force 2.7 million (Employed 0.5 million + Unemployed 22 million)] / Civilian Noninstitutional Population 13.8 million = 19.8% Marginal Labor Force Participation Rate.
- Again, just to get us back to that (2007) 73% level, we would have to grow at a rate of just under 225,000 each month for the next 60 months (nearly 13.5 million in 5 years) – assuming that we continue to add around 90,000 to the Men’s Civilian Noninstitutional Population each month.
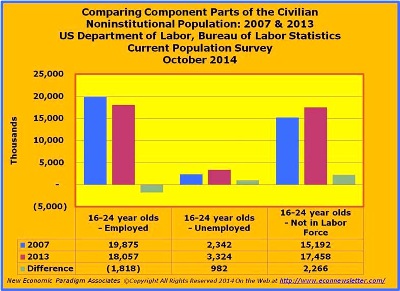
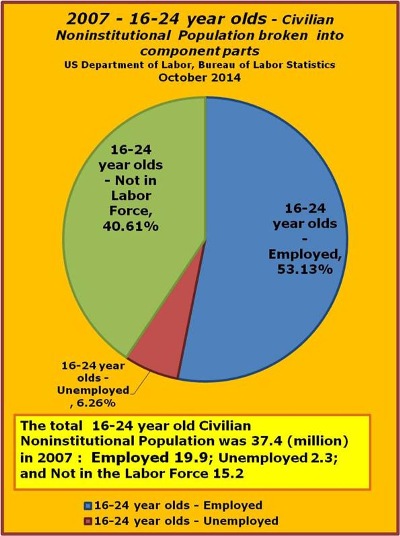
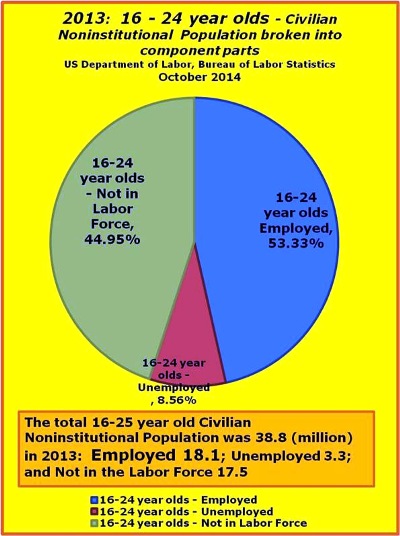
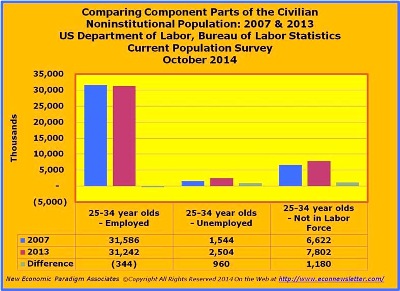
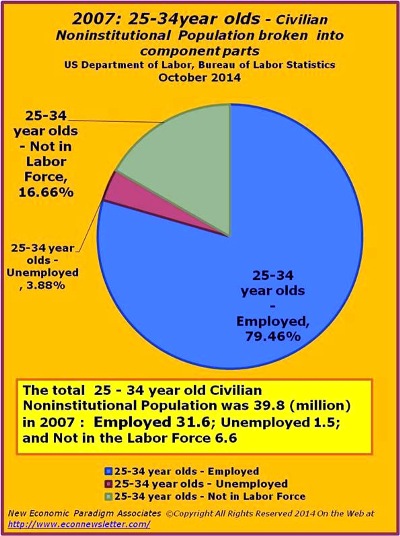
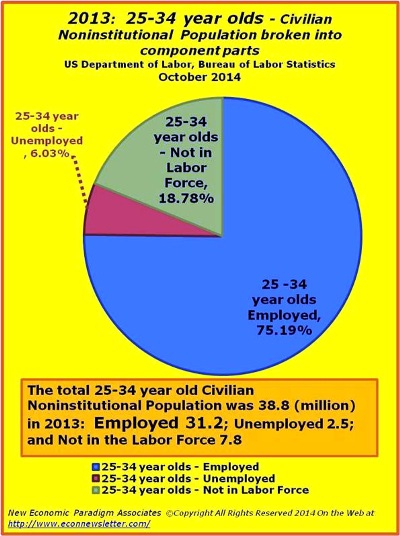
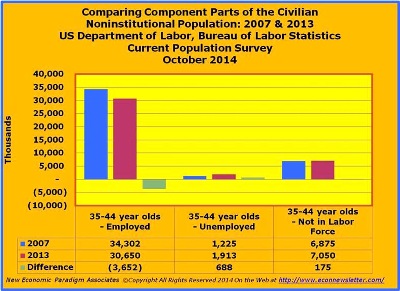
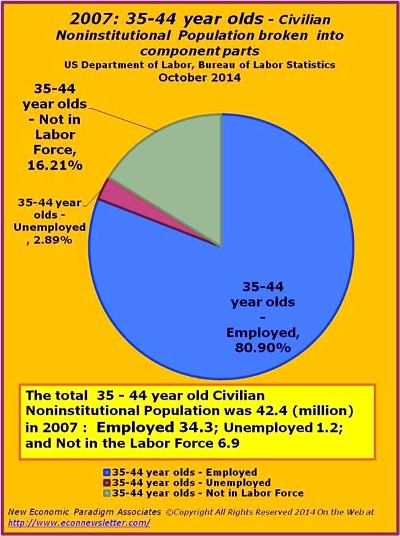
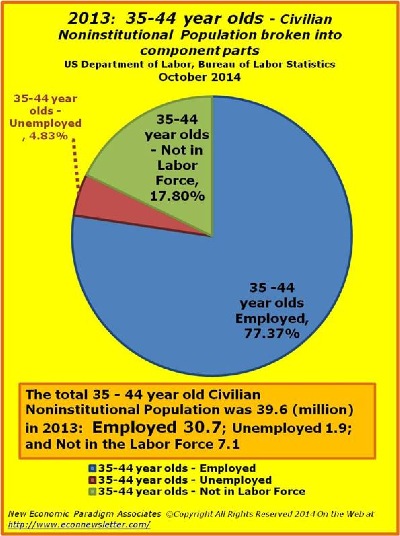
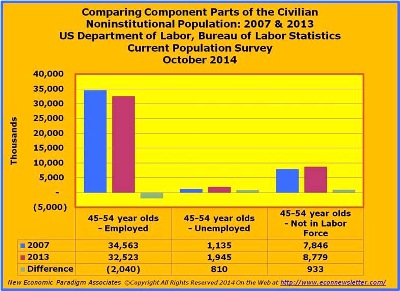
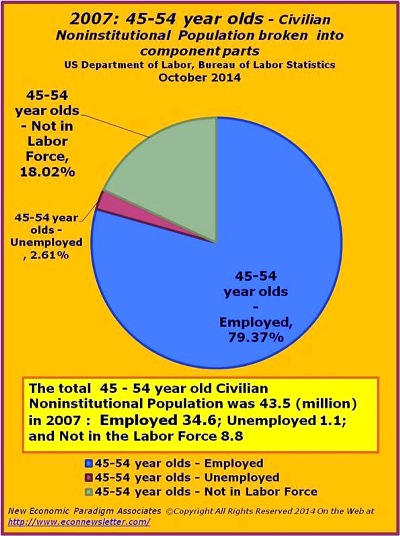
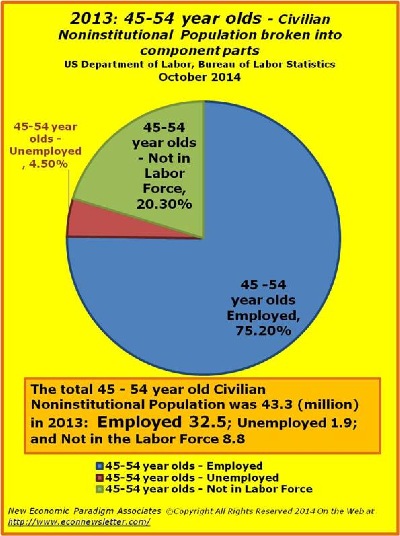
Drilling Down on the Civilian Noninstitutional Population by Age Group
Something to keep in mind when going through the Civilian Noninstitutional Population break outs by age group is that the younger segments have really taken a beating over the last several years, the 16 to 54 year olds in particular. The reality is that while the Baby-Boomers are adding to the numbers in the ‘not in the Labor Force’, thus lowering the Labor Force Participation Rate, this really misses the point that the younger groups are the ones who have really been the most affected by the lower participation rate. There are numerous reasons why the 55+ years old groups have either remained in the Labor Force or joined (or rejoined), ranging from a need for income to a desire and ability to remain productive members of the workforce. The main thing to note is that the real problem lies with the younger groups in their prime earning years that have been sidelined by virtue of weak labor markets. Whether you want to point to a lack of salable skills, weak economic conditions, or fiscal (or monetary) ineptitude in government, the fact remains that so long as the younger age groups remain outside of the labor force, the country as a whole will suffer and those age groups will continue to suffer in terms of garnering their ‘fair share’ of the income distribution.
No matter how you slice it in terms of age or gender, the Labor Force Participation Rate is at historic lows
On a last note, while women and men (families) have suffered, it has not been in equal measure with the latter being harmed to a greater degree. This is not an opinion, but fact. The real tragedy here is that while we celebrate monthly employment gains and reduced unemployment rates, those improvements have masked the underlying truth that the greatest change in the labor markets has been a move to the ‘not in the labor force’ category; the falling unemployment rate hasn’t translated into high enough employment numbers to offset the growth in the Civilian Noninstitutional Population. Again, the net result has been that Men’s Labor Force Participation Rate is at an all time low, Women’s Labor Force Participation Rate is at a 25 year low, and millions of working age people have been excluded from the labor markets – as the saying goes, sometimes the only thing worse than having a job is not having one.
Go through the following graphs and find your age group(s). While you may well have transitioned from one age group to the next, it’s important to see how each group has been affected and be sure to keep in mind that the overall Labor Force Participation Rate over the last several years has dropped precipitously. It’s very frustrating to hear from our readers, former students and people in general that the while their continues to be good news reported in terms of employment growth and a falling unemployment rate, the jobs are simply not there. As one long-term unemployed friend (now in the Not in the Labor Force since he has pretty much given up on going back to work) mentioned, if you don’t already have a job, it’s pretty much a foregone conclusion that you won’t be hired. This hasn’t really changed much since 2009…
Only the Employed Need Apply
June 30, 2009
http://online.wsj.com/articles/SB10001424052970203872404574257983795638374
But many employers are bypassing the jobless to target those still working, reasoning that these survivors are the top performers.
If they’re employed in today’s economy, they have to be first string,” says Ryan Ross, a partner with Kaye/Bassman International Corp., an executive recruiting firm in Dallas. Mr. Ross says more clients recently have indicated that they would prefer to fill positions with “passive candidates” who are working elsewhere and not actively seeking a job.