
2014 Volume Issue 9
October 12, 2014
For a downloadable version, click the following:
When UP is DOWN and DOWN is UP: September 2014 Labor Report
On October 3, 2014 the US Department of Labor, Bureau of Labor Statistics released its Employment Situation (www.bls.gov/news.release/archives/empsit_10032014.pdf) report for September 2014. The immediate take on it in the media was that the Labor Report was a very good one where the U-3 Unemployment Rate fell by two-tenths of a percent, from 6.1% down to 5.9% driven by a fall in the Unemployed of 329,000. This was the lowest Unemployment Rate reading since July 2008 when it came in at 5.8%. In addition, the Current Population Survey’s Employment number rose by 232,000 for the month of September, while the Payroll Employment number registered 248,000. What could possibly be wrong with a month like this?
“…the September increase was much better than the consensus forecast of 215,000 net new jobs and an unemployment rate holding steady at 6.1%. The unemployment rate fell to 5.9% in September, the lowest level since July 2008.”
www.latimes.com/business/la-fi-jobs-report-unemployment-economy-20141003-story.html
We’ve gone over the differences between the two surveys that the Bureau of Labor Statistics uses in its monthly reporting scheme on numerous occasions:
1) for changes in jobs, they – along with the media, tend to point to the Payroll Survey/Report [Current Employment Statistics - CES (National)] which tallies up numbers drawn from surveys submitted by various entities – “Each month the Current Employment Statistics (CES) program surveys approximately 144,000 businesses and government agencies, representing approximately 554,000 individual worksites, in order to provide detailed industry data on employment, hours, and earnings of workers on nonfarm payrolls.”
2) For changes in unemployment (and other household measures), the statistics are drawn from the Household Survey (Current Population Survey – CPS), “The Current Population Survey (CPS) is a monthly survey of households conducted by the Bureau of Census for the Bureau of Labor Statistics. It provides a comprehensive body of data on the labor force, employment, unemployment, persons not in the labor force, hours of work, earnings, and other demographic and labor force characteristics.”
So what’s the big deal? We saw the unemployment rate fall and the employment level rise in both the Payroll and Household Surveys.
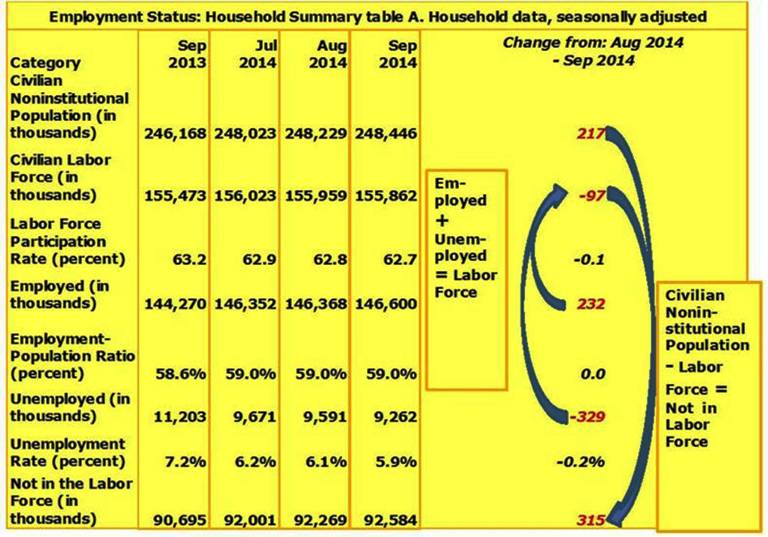
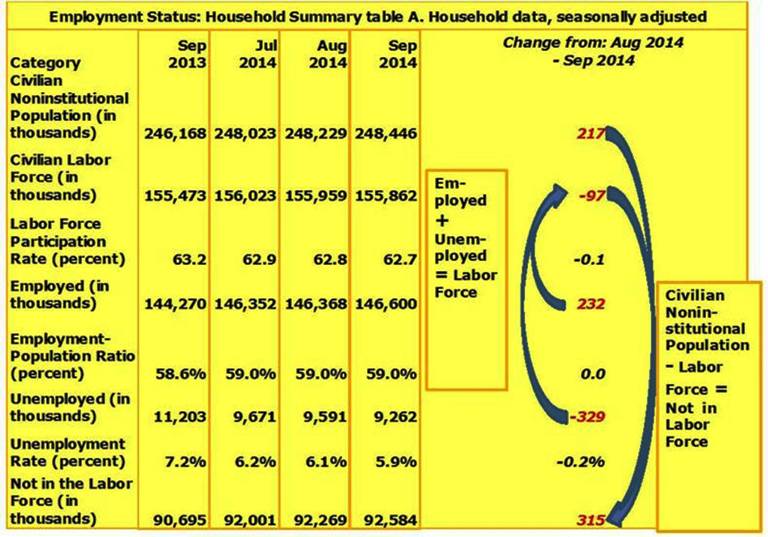
Focusing once again on the Household Survey, we want to look at the flow through the system for the month of September.
The Civilian noninstitutional Population (CNP) includes those people 16+ who are not otherwise accounted for in institutions, e.g., military, prison, etc.
Note: Illegal (undocumented) immigrants are likely embedded in at least some of the survey data – “It is likely that both surveys include at least some undocumented immigrants. However, neither the establishment nor the household survey is designed to identify the legal status of workers.”
www.bls.gov/news.release/empsit.htm
The CNP typically grows by 180,000 to 210,000 monthly. The growth includes all age groups (16+) so the individuals could be new entrants or those re-entering the pool from institutions. For the month of September 217,000 were added to the Civilian noninstitutional Population.
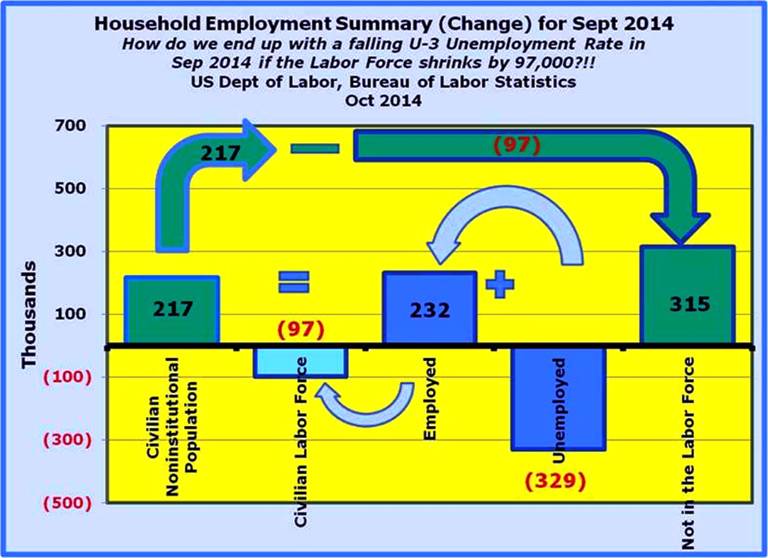
The Civilian Labor Force (LF) includes those Employed and those Unemployed (actively seeking employment). Specifically, the Employed are added to the Unemployed to arrive at the Labor Force number. For the month of September 2014, the Labor Force shrank by 97,000 [Labor Force 97,000 = Employed 232,000 – Unemployed 329,000]. What this means is that while employment increased by 232,000, it was not enough to absorb the 329,000 people who left the ranks of the unemployed, let alone the 217,000 that were added to the Civilian noninstitutional Population for the month.
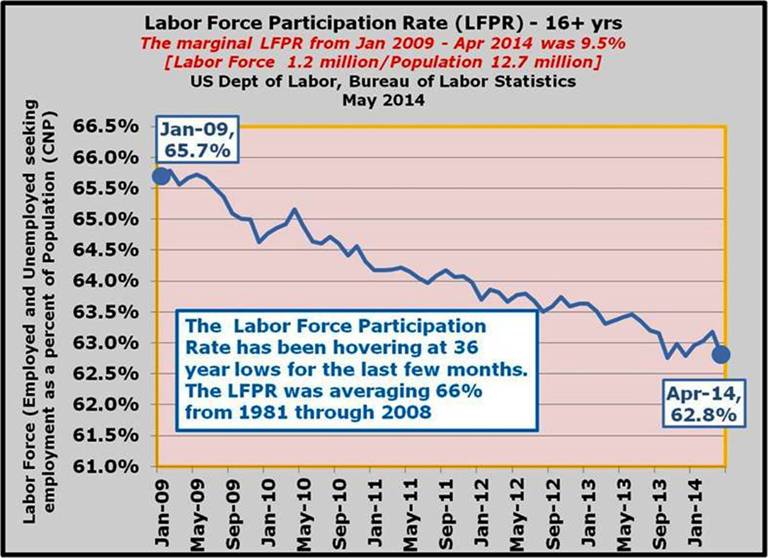
The Labor Force Participation Rate (LFPR) simply measures the ratio between the Labor Force and the Civilian noninstitutional Population in total. Since the Labor Force fell by 97,000 and the Civilian noninstitutional Population rose by 217,000 the monthly (marginal) Labor Force Participation Rate registered -44.7%, moving the total LFPR from an anemic 62.8% down to 62.7%. This represents the lowest reading for the LFPR since 1978. The collapsing LFPR has been blamed on an aging population (Baby Boomers born 1946-1964), but the fact is that the participation rate for the 65+ has actually been growing significantly, while the younger population segments have been shrinking, as has been reflected in the less than robust labor markets.
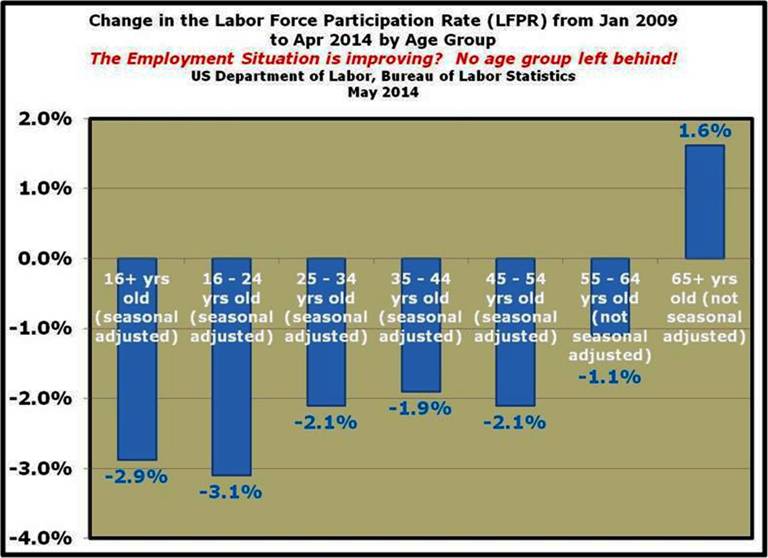
“While we’re focusing on the youngest group (16 – 24) and the oldest at 65+, it’s important to understand that ages 16 through 64 experienced a decline in the Labor Force Participation Rate since 2009. This means that we continue to underutilize people who are in their prime earning years.”
www.econnewsletter.com/jun202014
Again, the Employed numbers are drawn from the Payroll or Establishment Survey (Current Employment Statistics) as well as the Household or Current Population Survey. While the media typically points to the Payroll Survey number for the monthly changes in employment, the Household Survey is ultimately the more inclusive, larger measure of employment. For the month of September, the numbers were fairly close with the Establishment Survey registering 248,000 and the Household Survey coming in at 232,000.
We’ve taken some flak for focusing more heavily on the Household Survey number, but that does in fact measure employment more broadly and over time, represents a clearer picture of the employment situation. Regardless, the employment number we tend to key on is the one from the Household Survey since that is what is used in the overall Civilian noninstitutional Population figure (CNP = Labor Force (Employed + Unemployed ) + Not in the Labor Force).
http://www.bls.gov/news.release/empsit.htm
1. Why are there two monthly measures of employment?
The household survey and establishment survey both produce sample-based estimates of employment, and both have strengths and limitations. The establishment survey employment series has a smaller margin of error on the measurement of month-to-month change than the household survey because of its much larger sample size. An over-the-month employment change of about 100,000 is statistically significant in the establishment survey, while the threshold for a statistically significant change in the household survey is about 400,000. However, the household survey has a more expansive scope than the establishment survey because it includes self-employed workers whose businesses are unincorporated, unpaid family workers, agricultural workers, and private household workers, who are excluded by the establishment survey. The household survey also provides estimates of employment for demographic groups. For more information on the differences between the two surveys, please visit:www.bls.gov/web/empsit/ces_cps_trends.pdf.
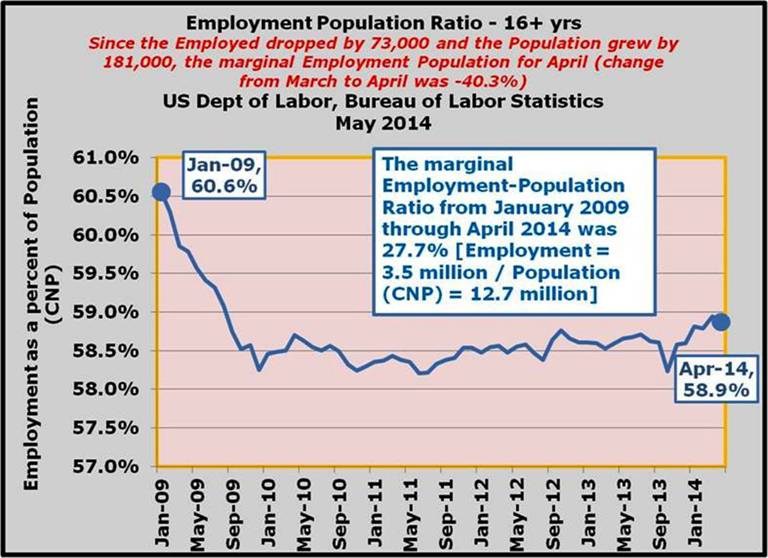
The Employment-Population Ratio shows the relationship of those Employed to the Civilian noninstitutional Population. The significance of this is that it provides some insight into what portion of the population is actually shouldering the burden of providing the productive resource, labor, in producing goods and services. Not unlike the Labor Force Participation Rate, the Employment-Population Ratio has remained very low for a significant period of time. We’ve noted on several occasions that the Federal Reserve tends to pay particularly close attention to the Employment-Population Ratio when weighing its strategy regarding the FOMC (Federal Open Market Committee) in terms of targeting the Federal Funds Rate and/or its bond-buying programs.
www.econnewsletter.com/jun202014
The Employment-Population Ratio came in at 59.0% in September, reflecting a continued pattern of relatively low numbers going back to 2009.
www.econnewsletter.com/jun202014
The continued fall-off in the Labor Force Participation rate, registering 62.7% in September 2014, points to the fact that while employment growth may be in the positive range, it is certainly not expanding enough to offset those coming off the unemployment rolls or to meet the needs of a growing population. Case in point: the total employment number just passed the peak level from January 2008. That is good news; however, the problem is that the Civilian noninstitutional Population expanded by more than 14 million over that same period.
Again, the Unemployed dropped by 329,000 in September, driving down the U-3 Unemployment Rate from 6.1% to 5.9%, the lowest level since 2008. The unfortunate thing was that on a ‘NET’ basis, that didn’t translate into equivalent numbers on the employment side of the Labor Force equation (Labor Force = Employed + Unemployed). By the way, the U-6 Unemployment Rate (Total unemployed, plus all marginally attached workers plus total employed part time for economic reasons) continues to remain relatively high, registering 11.8% in September 2014.
Given the preceding data, the much vaunted Unemployment Rate (U-3 Unemployment) falling from 6.1% to 5.9% in September 2014 is less than great news, especially considering the fact that while 329,000 dropped from the unemployment rolls, only 232,000 were added to the employed. That, taken in conjunction with the additional 217,000 added to the mix from the expanding Civilian noninstitutional Population makes the labor situation that much more troubling.
The last grouping in the Household Summary is the ‘Not in the Labor Force’ portion of the Civilian noninstitutional Population. This number is derived by subtracting the Labor Force from the Civilian noninstitutional Population. In September 2014 the Civilian noninstitutional Population increased by 217,000 and the Labor Force fell by 97,000 (Employed 232,000 – Unemployed 329,000) for a total increase in the Not in the Labor Force of 315,000 (rounding).
The take away from this presentation is that while the media tends to focus on the Payroll Survey number in reporting employment and uses the U-3 Unemployment Rate from the Household Survey, the health and true state of the labor markets are simply not reflected in those data sets. It makes much more sense to simply walk through the Household Summary Table to get a quick view on the performance.
On a further note, this analysis points to two other more politically oriented issues in the public square (there are of course many more):
Immigration Reform/Amnesty – when you consider the ongoing problems facing the underperforming labor markets, you have to wonder why there is such a push for expanding immigration, especially in the low-skilled arena. This is not a condemnation of immigration by any means (we are certainly a nation of immigrants), but considering the huge number of Americans who are unemployed, underemployed, unhappily sitting in the vast pool of people in ‘not in the labor force’, it makes little sense to open wide the door to huge numbers of unskilled (and skilled) people when we have Americans waiting in the wings for their own shot at employment.
Income Inequality – again, with the expanding group of people in the ‘not in the labor force’ it only makes sense that they are, for the most part, unable to partake in the income distribution pie. Many of these people are being sustained by disability, Social Security, some measure of public assistance or simply living with relatives, friends or are homeless and depending upon charity. Without adequate economic growth and a robust demand for labor, the income distribution disparity will only continue to worsen. According to the US Department of Commerce, Census Bureau, the median household income in 2013 was $51,939 (2013 dollars), $2,484 lower than it was in 2008 ($54,423 in 2013 dollars).
www.census.gov/hhes/www/income/data/historical/household/
In our next newsletter or so (coming very soon) we will be taking a bit of different look at the Civilian noninstitutional Population and its component parts in particular.
