
2014 Volume Issue 12
NOVEMBER 29, 2014
For a downloadable version, click the following:
…a bit more compressed version of the PDF
Is the monthly jobs report for October 2014 too good to be true?
As we read through the report, we here at the New Economic Paradigm Associates looked at the calendar to make sure it was not April 1, due to some time warp. No, it was early November – first Friday of the month and time for the latest Employment Report.
U.S. Department of Labor, Bureau of Labor Statistics
www.bls.gov/news.release/archives/empsit_11072014.pdf
Total nonfarm payroll employment rose by 214,000 in October, and the unemployment rate edged down to 5.8 percent, the U.S. Bureau of Labor Statistics reported today. Employment increased in food services and drinking places, retail trade, and health care.
Once again the media fell for the Payroll data as we have warned the world not to do. That report evoked a sizeable yawn from most. The new jobs were decent but less than expected or hoped for, so the media told us.
Forbes
Nov 7, 2014
Friday morning The Bureau of Labor Statistics released a weaker than anticipated October jobs report but made significant positive revisions to its August and September readings. Employers added 214,000 jobs last month compared to the 230,000 or so economists were predicting.
The Population Survey (Current Population Survey)
The real story is in the broader population survey (Current Population Survey) as we have pointed out in our newsletters on this web site over the past few years. The October jobs report was probably the best in several years. In fact it was almost surreal: the changes were all moving in the right direction with the unemployment rate falling; the Labor Force Participation Rate (LFPR) rising; the Employment-Population Rate rising; and the ‘not in the labor force’ component falling.
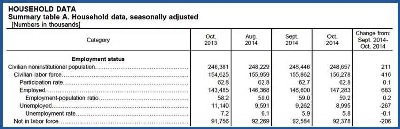
Here are a few of the major points reported in the Current Population Survey for October 2014:
www.bls.gov/news.release/archives/empsit_11072014.pdf
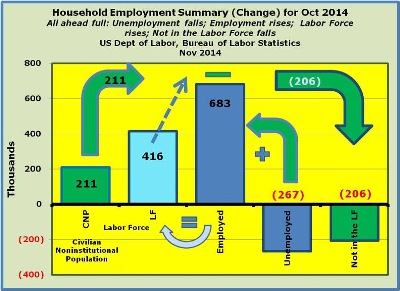
Tale of the Tape - Employment Picture for the month of October
The following explains in a bit more detail about what changes occurred in the Employment Picture for the month of October as illustrated above.
The Civilian Noninstitutional Population (16 years and over) increased by 211,000.
In looking at the [Civilian] Labor Force (LF), it grew by 416,000. The change in the Labor Force is equal to the change in the Employed [683,000] [plus] the change in the Unemployed [-267,000], which equaled the 416,000 added to the Labor Force for the month of October 2014.
The Labor Force Participation Rate (LFPR) rose one-tenth of a percent from 62.7% to 62.8%…while that might not seem like much, it is moving in the right direction.
Employment rose by a whopping 683,000 in the Current Population Survey (CPS), while it only registered a growth of 214,000 in the Current Employment Statistics (CES) or Establishment Survey.
The Employment-Population Ratio rose two-tenths of a percent from 59.0% to 59.2%. Keep in mind that this is a statistic that the FED keeps a close eye on. The Employment-Population Ratio measures those employed 147,283,000 as a percent of the Civilian Noninstitutional Population 248,657,000. The 683,000 added to the employed in October really moved the needle on this measure.
Unemployment declined by 267,000. Remember that the change in the Labor Force is equal to the change in the Employed plus the change in the Unemployed [683,000 + (267,000) = 416,000]. This means that on a net basis, those unemployed didn’t just move out of the Labor Force, but they found employment…good news by any measure. Again, this doesn’t mean that every person falling off the rolls of the unemployed found work, but on a net basis, the fall-off in unemployed did not result in a net gain in ‘Not in the Labor Force’ component…they did not move out of the Labor Force as has happened quite frequently of late and resulted in a drop on the Labor Force Participation Rate.
The decline in unemployed resulted in a fall in the unemployment rate, moving from 5.9% to 5.8%
As noted before, the change in the ‘Not in the Labor Force’ category dropped by 206,000, the biggest drop since March 2014. The change in the ‘Not in the Labor Force’ is arrived at by taking the change in the Civilian Noninstitutional Population of 211,000 and subtracting the change in the Civilian Labor Force (LF) of 416,000 with the difference being a drop in the ‘Not in the Labor Force’ component of 206,000 (rounding).
Barring a major retraction or revision(s), let’s hear a glory, alleluia! You really couldn’t ask for a better employment report than October 2014.
Is it Sustainable?
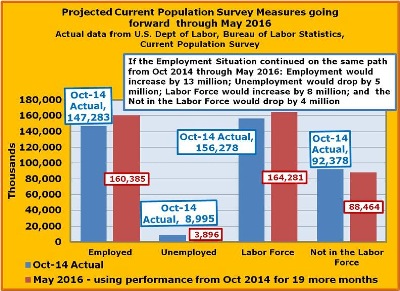
The real test of this improvement is that of sustainability. Will this reversal continue over the following months and years? We still have a long way to go to get back to the pre 2008 crisis levels. “One robin does not a spring make.”
Using the current change in the October 2014 Employment, if the same performance were to continue from November 2014 through May 2016 (19 months) Employment would increase by 13 million; Unemployment would drop by 5 million; the Labor Force would increase by 8 million; and the Not in the Labor Force component would fall by 4 million (with the Civilian Noninstitutional Population growing by the same 4 million).
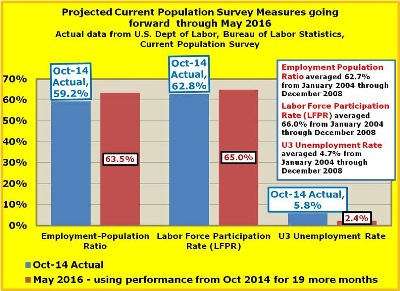
The resultant ratios and rates would also follow
- The Employment-Population Ratio would improve from 59.2% in October 2014 to 63.5% in May 2016
- Employment Population Ratio averaged 62.7% from January 2004 through December 2008
- The Labor Force Participation Rate would go from 62.8% in October 2014 to 65.0% in May 2016
- Labor Force Participation Rate (LFPR) averaged 66.0% from January 2004 through December 2008
- The U3 Unemployment Rate would go from 5.8% in October 2014 to 2.4% in May 2016
- U3 Unemployment Rate averaged 4.7% from January 2004 through December 2008
Quo vadis Federal Reserve System?
Is this the end of quantitative easing or just the end for the time being? The members of the Federal Open Market Committee (FOMC) are not unanimous in this regard. Will this jobs report quell the dissent for the end of the QE policies?
If indeed the worst is over, an economic and financial Nirvana is not here. If interest rates begin to rise to more historical levels (especially if unemployment rates fall rapidly and the FED sees any inflationary pressures mounting), investors are in for a difficult time. Recall the inverse relationship between interest rates and asset prices. As interest rates rise, it exerts downward pressure on asset prices. The value of an asset is determined by the discounted present value of the future cash flow or equivalent values the asset generates. The rate at which the assets future cash flows is discounted will increase as interest rates rise.
International Scene
Another problem arises in the area of international trade. Imports of goods and services depress and exports stimulate the level of economic activity. Along with a better jobs environment, the U.S. Dollar has strengthened in foreign exchange markets. This means the price of foreign currencies is cheaper in terms of Dollars but the price of dollars is more expensive in terms of foreign currencies. Thus the dollar price of imports into the U.S. decreases tending to increase our imports; but the foreign currency price of U.S. exports increases tending to decrease our export to the rest of the world. A strong dollar may sound good but it tends to depress our level of economic activity by worsening our trade balance.
The dollar prices of investment in the rest of the world also decrease and can cause an increase of investments by U.S. firms in the rest of the world making domestic funds for investment that much more scarce. For the same reason, the cost of foreign firms investing in the U.S. rises, tending to lessen that source of funds for financing investment in the U.S.
Pension Funds and other Sundry Things
Then there is the increased pressure on defined benefit pension funds that dominate the government retirement plans. As interest rates rise, the market prices of pension fund assets tend to fall, thus exacerbating the problem of underfunded pension programs.
While the rates of return rise on new investments, those of the existing investments, such as coupon bonds, do not.
There are other problems that result from rising interest such as on adjustable rate mortgages (sound familiar?), but you get the idea.
THE FEDERAL RESERVE: CONTINUED RESTRICTIVE MONETARY POLICY AND ITS FALLOUT
January 5, 2006
www.econnewsletterjan052006.com/
In the area of variable rate mortgages (ARMs), the Fed’s actions are gradually triggering the adjustment clauses in these mortgages. This increases the monthly payments, reducing further the disposable income available to purchase other goods and services and also reduces the cushion protecting homeowners from defaulting on mortgages.
Remember the old expression: be careful of what you wish for, your wish may be granted.
Bear in mind that the Federal Reserve (FED), especially with its vast portfolio of assets, is at the ready to do whatever it takes to slow down any economic growth it sees as excessive and harmful in terms of inflationary pressures.
… the FED’s target of around 2% [Why does the Federal Reserve aim for 2 percent inflation over time? --- “The Federal Open Market Committee (FOMC) judges that inflation at the rate of 2 percent (as measured by the annual change in the price index for personal consumption expenditures, or PCE) is most consistent over the longer run with the Federal Reserve's mandate for price stability and maximum employment.”].
