2015 Volume Issue 6
June 19, 2015
For a downloadable version, click the following:
…a bit more compressed version of the PDF
The effects of floors on wages, minimum wage legislation and collectively bargained minimum wages: a labor market analysis
Supply and Demand in the Market Place
As most readers realize, the prices of all goods and services in all markets are determined by supply and demand for the good or service in question. In markets that are not competitive, such as the markets for petroleum products, the control of supply or demand, will influence the price and reduce the economic welfare of society in various ways as we have explained in several newsletters on this website over the years. Government intervention by establishing price ceilings and floors will also influence the prices in markets as is the case of farm price supports, the control of rent or legislating minimum wages in labor markets.
WHEN ARE WE EVER GOING TO LEARN THAT FREE MARKET CAPITALISM, SO LONG AS IT IS COMPETITIVE, IS THE BEST POSSIBLE ECONOMIC SYSTEM TO ACHIEVE THE ECONOMIC WELFARE OF ITS CITIZENS?
April 18, 2014
www.econnewsletter.com/apr182014.html
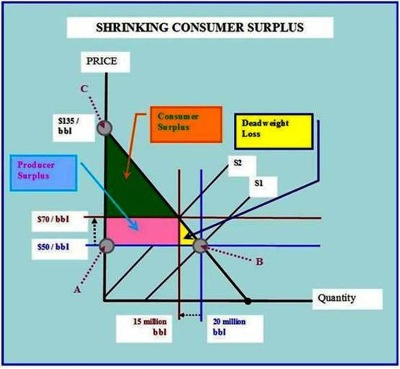
Shrinking Consumer Surplus in Crude Oil --- Restricting Supply
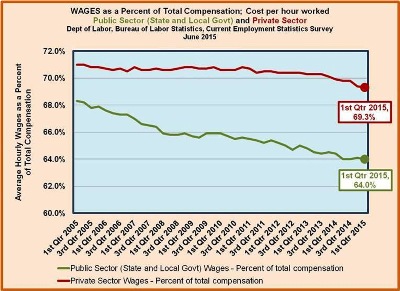
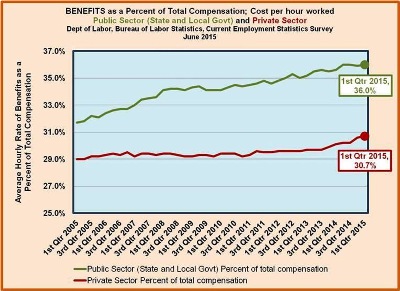
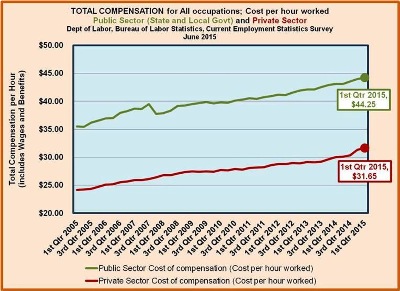
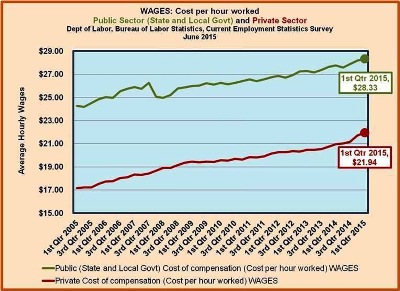
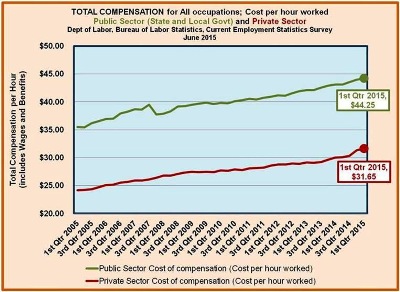
What determines the supply and demand for each good or service is a much more complex question. The labor market is the market in which the productive resource, labor service, is bought and sold. The price is the compensation rate labor is paid, which in the U.S. is currently, according to Department of Labor estimates, composed of two parts. In the recent past, the average labor compensation rate consisted of about 70% money wages and 30% non-wage benefits paid for by the employing firms. That rate has shifted as money wages as a percent of total compensation have fallen to 68.3% for all civilian employees and benefits have risen to 31.7%. Keep in mind that ‘benefits’ are typically either non-taxable or tax-deferred for employees.
video presentation
www.bls.gov/news.release/pdf/ecec.pdf
Note: Employer Costs for Employee Compensation (ECEC) measures the average cost to employers for wages and salaries and benefits per employee hour worked.
ECEC includes the civilian economy, which includes data from both private industry and state and local government. Excluded from private industry are the self-employed and farm and private household workers. Federal government workers are excluded from the public sector. The private industry series and the state and local government series provide data for the two sectors separately.
Comparing Benefits and Total Compensation in the Federal Government and the Private Sector
www.cbo.gov/sites/default/files/cbofiles/attachments/2012-04FedBenefitsWP_0.pdf
(Years: 2005 -2010)
Overall, federal benefits were about 48 percent higher, on average, than the benefits received by measurably similar private-sector workers. The most important factor contributing to differences between the two sectors in the costs of benefits is the defined-benefit pension plan that is available to most federal employees. Such plans are becoming less common in the private sector.
Overall, total compensation for federal employees was about 16 percent higher, on average, than total compensation for measurably similar workers in the private sector.
The Substitution Effect – the longer the time involved, the greater the impact
The price or in this case, the compensation rate that equates the supply of and demand for labor, that clears the market by equating the quantity demanded with the quantity supplied is referred to as the equilibrium price for labor. When the price in any market changes, it sets off reactions by buyers and sellers in each market. In the labor markets, one such reaction is called the substitution effect. The substitution effect is one of the most powerful reactions in all of economics. The longer the time period studied, the greater tends to be the total reaction as the substitution effect.
Any price above the equilibrium price will result in a surplus of labor, that is, the quantity supplied will exceed the quantity demanded. Some labor economists view this as voluntary unemployment since it results from an excessively high compensation rate resulting in a disequilibrium in that market. Any price below the equilibrium price will result in a shortage of labor, that is, the quantity demanded will exceeds the quantity supplied of labor.
The slopes of the demand for and supply of labor curves embody such ‘effects’ as the substitution and income effects. For those readers not wanting to delve into the theory of markets such as the labor market, let us remind you that if you use the term automation or outsourcing, you are speaking of the vernacular term for the substitution effect.
Nearly a quarter of a century ago, I was lecturing on this subject when a student commented that he had just returned from a trip to California and had noted that a fast food franchise he had frequented there, had only two observed employees, everything else was automated. As the push for legislation to enact ever higher minimum wages of these employees has spread eastward across the nation, this type of transformation has been occurring rapidly in our “neck of the woods.”
You need only look so far as most fast food establishment where you receive an empty cup when you order a drink. It’s clearly less expensive to hire an additional worker dedicated to filling soft drink cups than it is to allow the customer to help themselves to refills of their chosen beverage.
The substitution of capital for labor is driven by the increasing cost of labor and the resulting attempt to pass such costs on the buyers of fast food products. The result has been twofold and triggered the substitution effect in the product market as eating at traditional restaurants became more competitive with eating at fast food establishments. The substitution effect gained even greater strength. This was in addition to the substitution of capital for labor or automation. As kiosks and the acceptance of debit and credit cards has begun to replace the need for human labor to take orders and act as cashiers.
The so-called ‘Affordable Health Care Act’ or ACA (The Patient Protection and Affordable Care Act (PPACA)) has also taken its toll as most new jobs are part-time in order to avoid the rising cost of health care premiums paid for by the firms employing labor on a full time basis.
As we have argued in this newsletter over the years, the best way to achieve a less excessively unequal income distribution, is first to promote the economic growth needed to stimulate job creation and secondly, to promote vigorous competition so some arbitrary winners in the productive resource mix do not garner more than their share of the goodies associated with economic growth. This market power controlled by some productive resources and their employing firms allows some productive resources to earn far above their opportunity costs while many others not so empowered fare far worse and are also exposed to excessively high prices for the goods and services they buy in their role as consumers.
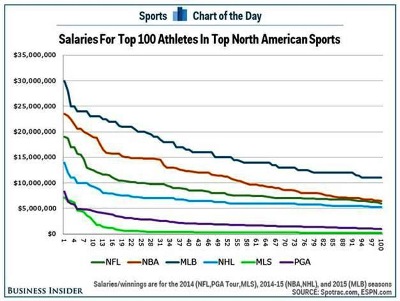
The high rollers include a very large numbers of households whose primary source of income is in the form of labor compensation and not interest and dividends. Athletes, auto workers and government employees are among the high rollers undermining the economic welfare of the economic system.
www.businessinsider.com/mlb-nfl-nba-nhl-mls-pga-salaries-2015-2
Redistributive Policies have Failed
The attempt to directly redistribute income to lessen excessive inequality in that distribution by such things as the ‘War on Poverty’ of the Lyndon Johnson years and the ‘Affordable Health Care Act’ of the Obama years has proven to be a resounding failure both in reducing the excessively unequal income distribution as well as ca using a slowing rate of economic recovery and growth that is causing a falling medium real income of society.
When will they/we learn?
COMPETITION IS THE MOST MISUNDERSTOOD, MISUSED, AND MALIGNED WORD IN THE PUBLIC’S VOCABULARY
October 18, 2014
www.econnewsletter.com/oct182014.html
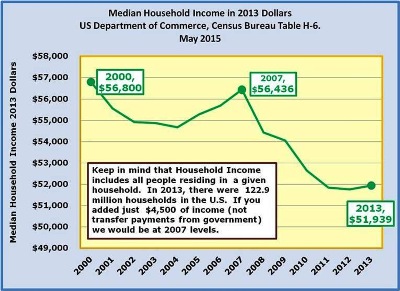
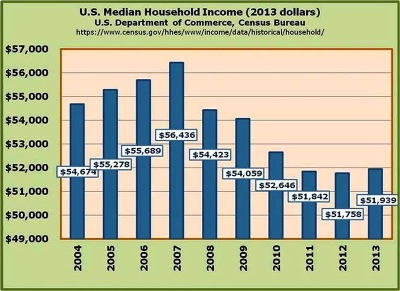
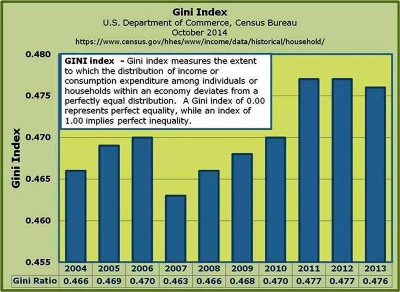
In the U.S. since 2007 the real median Household Income has fallen by $4,497, from $56,436 to $51,939. In addition, the Gini Index (sometimes referred to as the Gini Coefficient) has also shown significant signs of increasing income disparity over the last several years. There’s little doubt that the monetary and fiscal policies employed to combat the recession and the subsequent failure of the labor markets to adequately rebound has led to lower incomes and increased disparity. In a normal environment – in this case, meaning a robust recovery accompanied by policies promoting competition, those competitive forces would move to both increase the median income level by drawing more people into the labor pool, which would in turn reduce disparity (lower the Gini Ratio) due to those same competitive forces working in a like manner in the labor (productive resource) markets.
But what about the Living Wage Argument?
For those good-hearted people crying for such things as “living” wages, we ask them to drop such clichés and do a bit more analyzing of what is a sustainable income for productive resources such as labor. The demand for labor is not too difficult to understand. It is determined by the revenue that the productive resource [labor] generates for the firm employing the labor in question. What does this mean in everyday terms? It equates to the money value of the production contributed by the additional labor employed.
If a person is compensated $35 per hour for performing a given task in the production process, the assumption is that the $35 of labor employed contributes a certain amount of revenue (typically much more than $35 is required to justify that expense) much more in terms of revenue for a firm for that one hour of performance.
If additional production requires dropping the price to sell the additional quantity, it is the marginal revenue, not the price or average revenue that is used to monetize the added physical production resulting from labor’s contribution to the production process. If the $35 per hour cost related to the employee begins to eat into the profitability of the item produced and cannot be offset in some manner, it is logical that the firm’s manager begins to reconsider the productive resource mix (labor, capital, entrepreneurship, land) to see if there might be some way of reducing cost.
If decisions are made at the margin as labor theory argues, then the physical contribution of labor to the production process should be monetized at its marginal revenue and not its average revenue, which is the price to the consumer. It should be noted that as the degree of competition in the product market increases, the divergence between the price and the marginal revenue of the good or service in question converges toward zero.
If labor’s compensation, so determined, is less than a living wage; whatever that nebulous term means, then that labor had better find a more productive job or work longer hours. Labor could also put in the extra effort to embody greater human capital in itself by additional training, education, etc. Paying labor a “living wage” if it is higher than labor’s marginal revenue product, will simply result in job loss and it is unsustainable in the real world.
The word ‘sustainability’ in a real world context, must be must be realistically defined and not borrowed from fantasy land.
The last several years have been in many ways tragic in terms of employment and real wage growth, no matter the intention of policy makers. Adoption of clichés and their incorporation into legislation does not good policy make. While the path to hell may not be paved with good intentions the path to bad economic policies can be so paved.
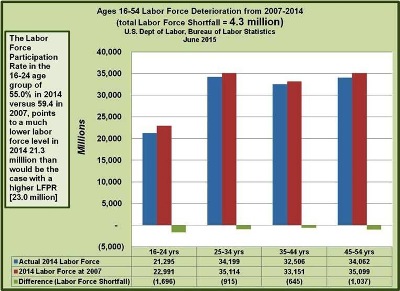
Last Point: Falling Labor Force Participation in the 16-54 Age Group (2007-2014)
In 2007, the Labor Force Participation Rate for the 16-24 year old demographic was 59.4%. The Labor Force Participation Rate is equal to the Labor Force (those employed and those unemployed (U3 Unemployment) actively seeking employment) divide by the Civilian Noninstitutional Population (those 16+ year olds not in the military, prison, or otherwise counted in institutions). In 2014, the LFPR dropped to 55.0%. If that Labor Force Participation Rate would have remained at 2007 59.4% level, then 1.7 million more people would be in the labor force in 2014.
Since around 50% of minimum wage earners are in the 16-24 year old age group, does it make sense to raise the minimum wage?
www.pewresearch.org/fact-tank/2014/09/08/who-makes-minimum-wage/
“People at or below the federal minimum are:
Disproportionately young: 50.4% are ages 16 to 24; 24% are teenagers (ages 16 to 19).”
Keep in mind that the LFPR is significantly lower than it was in 2007. If you increase the cost of hiring these people for minimum wage jobs, what is the more likely outcome? Increased hiring by employers on the margin (those facing other cost pressures due to such things as the implementation of Obamacare and higher cost of other inputs), or reduced hiring?