October 6, 2015
For a downloadable version, click the following:
…a bit more compressed version of the PDF
Latest on Employment Situation Year-to-date Jan – September 2015
On a marginal basis (from January – September 2015) the Labor Force fell by 465,000 while the working age population expanded by 1.6 million
Meanwhile Federal Reserve action on raising the Federal Funds target seems well on the way, or is it?
www.wsj.com/articles/janet-yellen-ally-sees-possible-fed-interest-rate-move-soon-1443754863
Oct. 1, 2015 11:13 p.m. ET
Federal Reserve Bank of San Francisco President John Williams said Thursday he sees the central bank raising short-term interest rates this year, perhaps as early as this month, as the economy continues to improve.
Mr. Williams, a close ally of Chairwoman Janet Yellen, said the Fed doesn’t need much new economic data before moving, adding that the decision to hold off on raising rates at the central bank’s September meeting was “a very close call.
www.businessinsider.com/august-jobs-report-september-4-2015-9
In a speech just before the jobs report, Richmond Fed president Jeffrey Lacker said the labor market supported the case for raising rates sooner rather than later. But this report was unlikely to "materially alter the labor market picture or, for that matter, the monetary policy outlook."
www.reuters.com/article/2015/09/04/us-usa-economy-idUSKCN0R40CT20150904
U.S. job growth slowed in August, but the unemployment rate dropped to a near 7-1/2-year low and wages accelerated, keeping alive prospects of a Federal Reserve interest rate hike later this month.
The problem with the so-described news is that it only speaks to those added to the ranks of the employed in the Payroll Survey, but it doesn’t address those moving out of the labor force.
As a refresher, keep in mind that there are two basic surveys measuring employment changes published by the Bureau of Labor Statistics. The number of those dropping out of the ranks of the employed in the Current Population or Household was 236,000, while the data collected in the Nonfarm Payroll or Establishment Survey showed that there were 142,000 added.
Because the household survey has a broader employment definition than the payroll survey, the household employment level (green line) exceeds that of the payroll survey (blue line).
www.bls.gov/web/empsit/ces_cps_trends.pdf
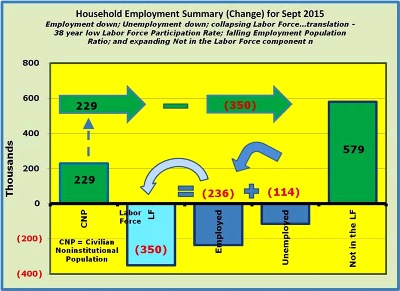
As you can see in the figure below, the Employment Summary tracks the changes in the employment picture for the month. Starting with the Unemployed, that number dropped by 114,000. Next, you can see that there was a reduction of 236,000 in the Employed for the month. The change in the Labor Force is equal to the change in the Employed of -236,000 plus the change in the Unemployed -114,000, leaving us with -350,000 change in the Labor Force for the month of September.
229,000 working age individuals were added to the (CNP) Civilian Noninstitutional Population (16+ years and older, not in military, or otherwise counted in institutions). The CNP consists of those in the labor force and those not in the labor force. Since the net change in the Labor Force for July was -350,000, that meant that 579,000 were added to the not in the labor force, again on a net basis for the month.
Change in the Civilian Noninstitutional Population (CNP) = Change in the Labor Force (LF) + Change in the Not in the Labor Force (NLF)
229,000 CNP = -350,000 LF + 579,000 NLF
Focusing again on just the month of September 2015, the Labor Force Participation Rate (LFPR) for the month was -152.8% [(Employed -236,000 + Unemployed -114,000) / CNP 229,000]. The change in the Labor Force Participation Rate is equivalent to the change in the Labor Force of -350,000 divided by the change in the Civilian Noninstitutional Population (CNP) of 229,000.
Meanwhile, since employment fell for the month by 236,000 [Employment Population Ratio -103.1%: Employed -236,000 / Civilian Noninstitutional Population (CNP) 229,000]. In summary, it was not only disastrous in terms of the monthly marginal Labor Force Participation Rate and the Employment Population Ratio, but the bad news spilled out in the form of those sidelined in the ‘not in the labor force’ category which grew by 579,000.
Employment Situation – Sept 2015 (released October 2, 2015)
www.bls.gov/news.release/archives/empsit_10022015.pdf
In a recent newsletter, we looked at the labor markets from 2007 through 2014 (The Labor Markets 2007 – 2014: How the Age Groups have made out www.econnewsletter.com/jul102015.html ), but for this latest article, we wanted to see how the labor situation has performed in 2015.
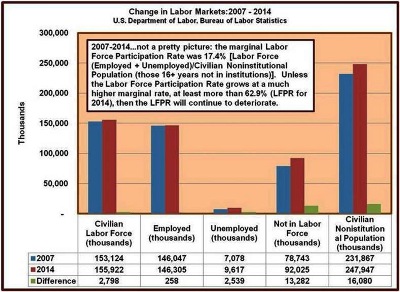
What we found was that while the media continues to laud the economic gains, at least domestically, the data in the labor markets is far from rosy.
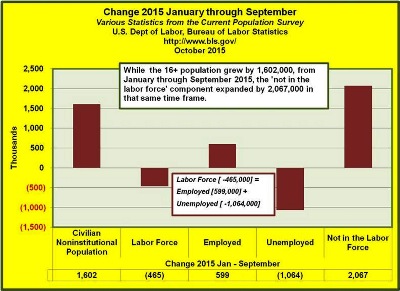
From January through September 2015:
The Civilian Noninstitutional Population expanded by 1.6 million (within the expected range)
The year-to-date Labor Force (LF), equivalent to the Employed + Unemployed (actively seeking employment), was a -465,000.
The Labor Force fall off was attributed to a modestly rising Employed figure of 599,000 added to dropping Unemployed number of 1,064,000.
While the falling unemployed, on its face is viewed as a positive thing in the media, the problem was that on a net basis, since neither the 1,600,000 added to the Civilian Noninstitutional Population nor the 1,064,000 in the unemployed translated into equivalent or even a modest percentage of additions to employment, the results have been disastrous.
Year-to-date 2015 (January through September)
1,600,000 CNP = -465,000 LF + 2,067,000 NLF
The not in the labor force component of the Civilian Noninstitutional Population grew by 2,067,000. The current ‘Not in the Labor Force’ component (those not employed or unemployed seeking employment) of the Civilian Noninstitutional Population is 94.6 million, or 36.7% of that total.
Year-to-date 2015 (January – September): Labor Force Participation Rate, Employment Population Ratio, and Not in the Labor Force Rate
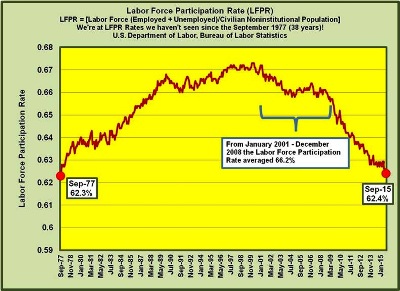
To provide some perspective, the Labor Force Participation Rate is at a 38-year low. As recently as October 2008 it was at 66.0%. In January 2015 it was at 62.9% and by September it dropped an additional half percent to 62.4%; again, the lowest level since September 1977.
As recently as October 2008 it was at 66.0%. In January 2015 it was at 62.9% and by September it dropped an additional half percent to 62.4%; again, the lowest level since September 1977.Once again, the Labor Force Participation Rate (LFPR) measures Labor Force (Employed + Unemployed seeking employment (the U3 measure)) divided by the Civilian Noninstitutional Population (working age population – those 16+ who are not counted in the military, prison, or other institutions).
Measuring the Marginal Rates for Year-to-Date 2015 (January – September)Labor Force Participation Rate (LFPR)
The change in the Civilian Noninstitutional Population was 1,602,000
The change in the Labor Force was -465,000 [599,000 Employed + -1,064,000 Unemployed]
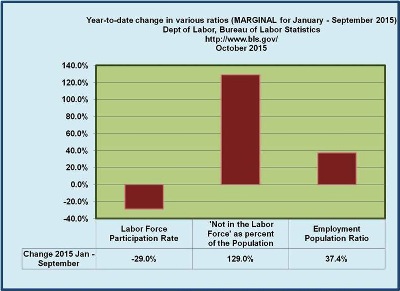
The year-to-date change in the Labor Force Participation Rate (LFPR): -465,000 (LF) divided by the 1,602,000 (CNP) = -29.0%
Employment Population Ratio
The change in the Civilian Noninstitutional Population was 1,602,000
The change in the Employed was 599,000
The year-to-date change in the Employment Population Ratio: 599,000 Employed divided by the 1,602,000 (CNP) = 37.4%
The change in the ‘not in the labor force’ as percent of the Civilian Noninstitutional Population for 2015 (January – September) – those that moved out of the Labor Force altogether, was a staggering 129%. In short, more people moved out of the Labor Force than entered the Civilian Noninstitutional Population.
It’s important to note that as bad as it is that the Labor Force Participation Rate continues to collapse, it is sometimes difficult to grasp how much that affects the economy – after all, moving from 66% down to 62% doesn’t sound all that bad. When you put it in terms of people, rather than percentages, it really crystallizes.
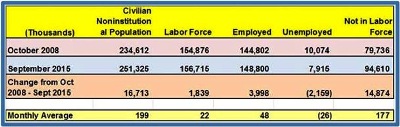
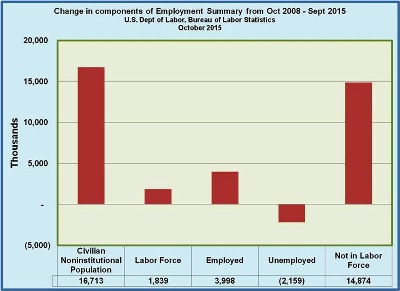
From October 2008 through September 2015 (7-years), the working age population (CNP) expanded by 16.7 million. On a net basis, 89%, or 14.9 million of those people ended up moving out of the labor force (again, on a net basis).
From October 2008 through September 2015, 14.9 million people moved to the sidelines; out of the labor force (employed + unemployed actively seeking employment) at a rate of 177,000 per month. In that same seven year period, from October 2008 through September 2015 employment rose by only 4.0 million, or 48,000 per month.