2015 Volume Issue 14
October 15, 2015
For a downloadable version, click the following:
…a bit more compressed version of the PDF
OCTOBER 15 2015
A Seven Year look-back on the Labor Situation: Not a Pretty Picture
A Few More Things to Consider on the Labor Front – what about that dropping unemployment rate?
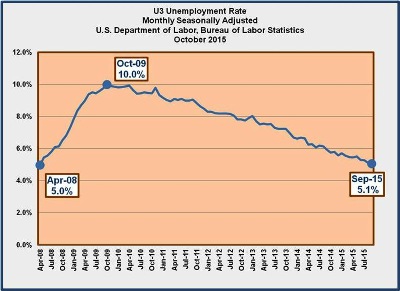
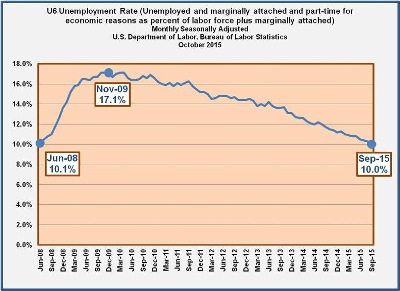
- There are 6 measures of unemployment published by the BLS www.bls.gov/news.release/empsit.t15.htm with U3 at 5.1% counting those who are not employed, but actively seeking employment (U6 as the broadest measure, currently at 10% in September 2015.
What about those seemingly healthy monthly job growth numbers?
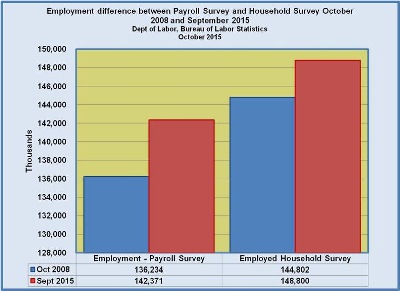
- The monthly numbers on employment typically point to the CES or Establishment Survey report which counts payroll numbers officially reported by businesses and governmental units. The number used to determine the U3 Unemployment rate and the rest (including U6) are from the CPS or Current Population Survey (Household Survey) which is arrived at by contacting household directly, querying them on their employment status. The Payroll Survey is very large in size (monthly forms submitted from several hundred thousand work locations), but the Household Survey is larger in scope because it picks up those working individuals in households self-employed, in small businesses, and agricultural workers, none of which are covered in the Payroll Survey.
www.bls.gov/opub/mlr/2006/02/art2full.pdf

Unemployment down and Employment up, but not enough to grow the Labor Force
- Since the unemployment number is drawn from the Household Survey, and it is more inclusive than the Payroll Survey, we tend to see that measurement as more representative of the labor situation. You can argue one way or another (that the Payroll Survey lags behind the Household Survey, or vice versa), but we prefer to focus on the Household Survey because it is more inclusive (covering more of the population than the Payroll Survey). In summary, while the Payroll Survey Employment is continuing to expand at a healthy rate, it is effectively a subset of the Household Survey Employment. Having said this, if the Payroll employment side grows and the Household Survey Employment does not keep up with that growth, the difference reflects a movement within the Household Survey (from the not in the Payroll portion of the Household Survey to the Payroll sector).
- When the unemployment rate drops, as the U3 rate has for the past several years, and the numbers don’t translate into commensurate increases in employment to offset those leaving the ranks of the unemployed, while also picking up a portion of the new monthly additions to the population, you have a what is known as the ‘discouraged worker effect’. The Labor Force, which is the total employed plus those unemployed actively seeking employment, continues to deteriorate. The problem is that this has gone on, unabated, for the past several years. http://blogs.udmercy.edu/newparadigm/2010/05/
www.econnewsletter.com/may122010blog.html
C:\Users\ederbin\Documents\Eds_Website\Eds_Website\index\2010\may122010blog.html
The Labor Force Participation Rate continues to underperform, especially in the younger age groups
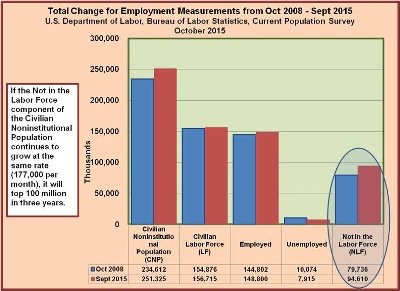
- The real danger has been that we have seen a dramatic rise in those moving out of the labor force (Labor Force = Employed + U3 Unemployed seeking employment), which has driven the Labor Force Participation Rate [Labor Force divided by the working age population (16+ years old) or the Civilian Noninstitutional Population] to 38 year lows. All of this translates into a not in the labor force component of 94.7 million, an all-time high.
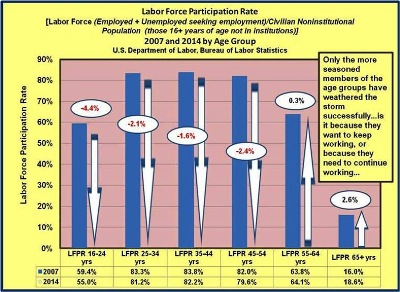
An explanation offered to explain this situation highlighting the massive movements out of the labor force (falling Labor Force Participation Rate) focuses on the retirements relating to the Baby Boomers (born 1946 through 1964). At face value this seems plausible since the leading edge of the boom is rapidly approaching 70 years of age. The problem with this line of thinking is actually two-fold:
On the one hand, folks in the 65+ year old age range are actually remaining in the labor force at a significantly higher rate than they had in the past. On the other hand, it is reasonable to expect that the younger age groups would be picking up the slack in the jobs vacated by the retirees. This is clearly not occurring and points primarily to less than robust economic growth.
www.econnewsletter.com/jul102015.html
Those moving out of the Labor Force are rapidly approaching the 100 million mark
Beyond all of this, keep in mind that since those folks in the ‘not in the labor force component’ are not contributing to economic growth (GDP and National Income), this is further dragging down the economy. This is a growing problem as there will be 100 million on the sidelines in the ‘not in the Labor Force’ portion of the Civilian Noninstitutional Population within a few years…assuming nothing changes.