
2016 Volume Issue 8
Economic Newsletter for the New Millennium
August 1, 2016
For a downloadable version, click the following:
…a bit more compressed version of the PDF
THE ECONOMIC CONSEQUENCES OF A PROLONGED PERIOD OF A SUB-PAR RATE OF ECONOMIC GROWTH: AN UNSUSTAINBLE LEVEL OF GOVERNMENT AND PRIVATE SECTOR DEBT BURDENS
The nation’s debt, both public and private, continues to approach unsustainable levels given the historically low level of real economic growth over the past several years.
Here comes the Debt
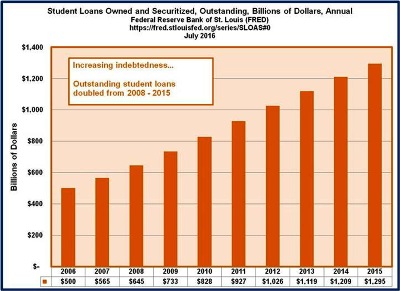
The alarming growth of the U.S. Federal Government debt over the past several years is being accompanied by the unsustainable levels of private debt due to the sub-par real economic growth rate for the last several years.
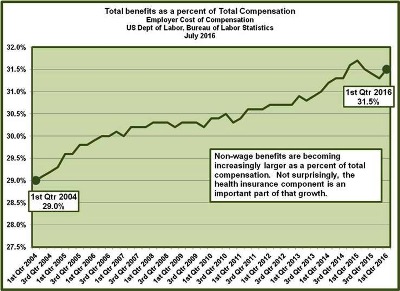
In respect to this dismal performance in our economic growth, it is the worst in modern times. The collapse in the labor force participation rate is but one reflection of this disappointing pattern of real economic growth. Exacerbating the problem is the now in full swing ‘’Affordable Health Care Act’ which is gradually changing the employment mix from full-time to part-time employment to avoid the costs of this Act to employers. As pointed out in earlier newsletters on this website, the Bureau of Labor statistics shows that non-wage benefits including such as health care premiums of employees paid for by employers, now account for about 30% of total labor compensation. A significant portion of such benefits goes only to full-time employees. The relatively low labor force participation rate and the gradual move toward part-time employment from full-time status has a significant impact on income and taxes, the traditional sources of funding sustainable government and private sector spending that stimulate the real economic growth rate.
Revisiting Okun’s Law
While the U3 unemployment rate has fallen to close to pre-recession levels, the massive numbers of people who have exited the labor force has resulted in an artificially low unemployment rate. By simply adjusting for the 66% pre-recession Labor Force Participation Rate, the current unemployment rate of 4.9% would move up to 9.7%, a difference of 4.8%. According to Okun’s Law [Rule of thumb…for every 1% the unemployment rate is higher than the full employment unemployment rate, GDP (economic output gap) is 2% lower than what it would otherwise be] this higher unemployment rate would indicate there is a shortfall of approximately 10% in terms of real GDP.
This ongoing lackluster growth rate of less than three percent real GDP over the last several years has kept the American economy from any real economic recovery. Incurring increasing debt burdens to maintain pre-existing expenditure patterns is not a viable substitute for earning an income from a productive life just as using debt to finance government spending is not a viable alternative to funding government spending with taxes.
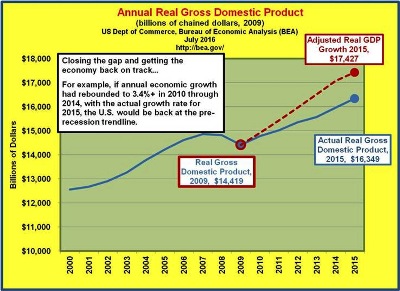
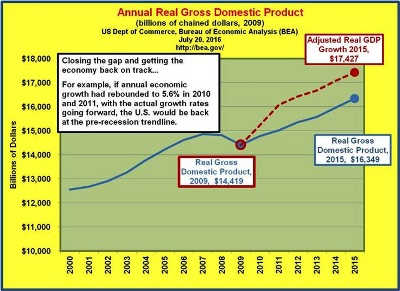
The sub-par real economic growth rate has created a GDP (Gross Domestic Product) gap. At the very end of this article, we once again walk through the calculations involving the estimated impact of slow growth as inferred In Okun’s Law. Preceding the Okun’s Law piece, we illustrate how debt burdens of both the federal government and the private population have dangerously filled the gap to maintain spending. Most taxes are either directly or indirectly related to economic activity, especially production and income.
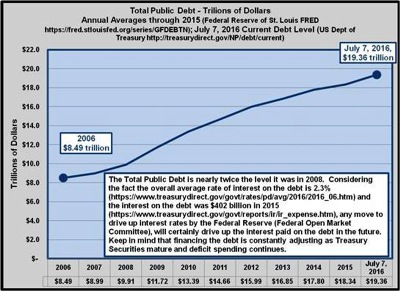
The Total Public Debt (U.S. Federal Government debt) is nearly twice (85% higher than it was in 2008). Considering the fact the overall average rate of interest on the debt is 2.3% www.treasurydirect.gov/govt/rates/pd/avg/2016/2016_06.htm() and the interest on the debt was $402 billion in 2015 FY (fiscal year) (www.treasurydirect.gov/govt/reports/ir/ir_expense.htm), any move to drive up interest rates by the Federal Reserve (Federal Open Market Committee), will certainly drive up the interest paid on the debt in the future. Keep in mind that financing the debt is constantly adjusting as Treasury Securities mature and deficit spending continues.
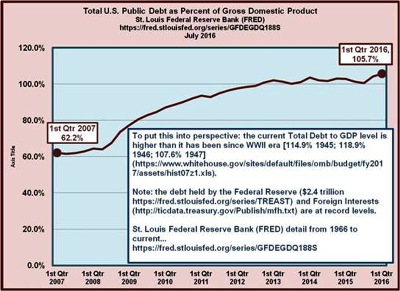
To put this into perspective: the current Total Debt (U.S. Federal Government debt) to GDP level is higher than it has been since WWII era [114.9% 1945; 118.9% 1946; 107.6% 1947] ().
www.whitehouse.gov/sites/default/files/omb/budget/fy2017/assets/hist07z1.xls
Note: the debt held by the Federal Reserve ($2.4 trillion https://fred.stlouisfed.org/series/TREAST) and Foreign Interests (http://ticdata.treasury.gov/Publish/mfh.txt) are at record levels.
St. Louis Federal Reserve Bank (FRED) detail from 1966 to current…
https://fred.stlouisfed.org/series/GFDEGDQ188S
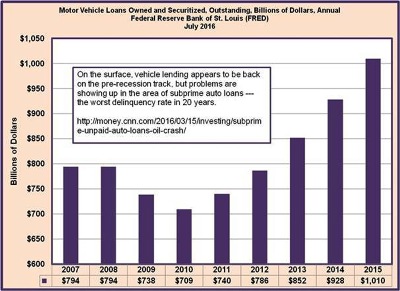
On the surface, vehicle lending appears to be back on the pre-recession track, but problems are showing up in the area of subprime auto loans --- the worst delinquency rate in 20 years.
http://money.cnn.com/2016/03/15/investing/subprime-unpaid-auto-loans-oil-crash/
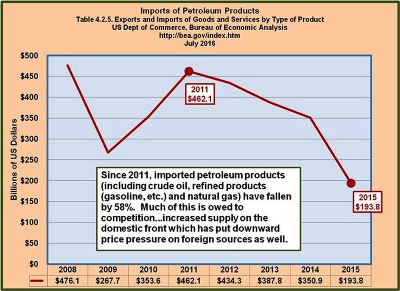
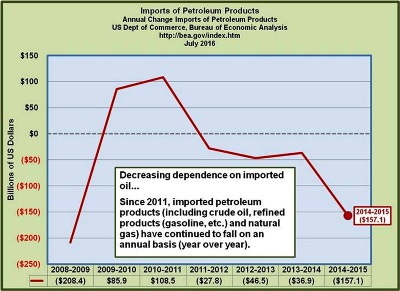
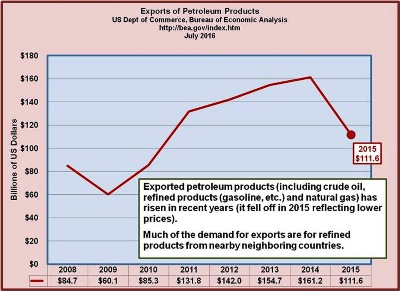
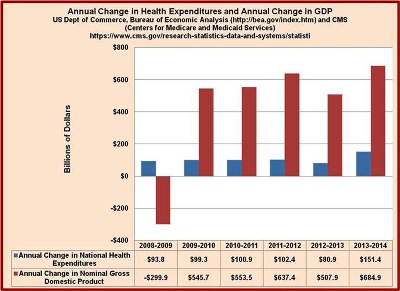
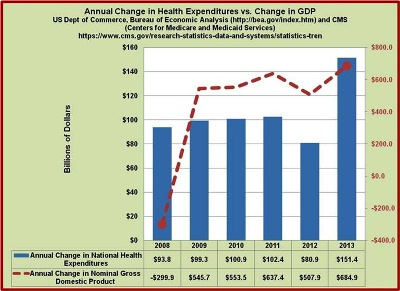
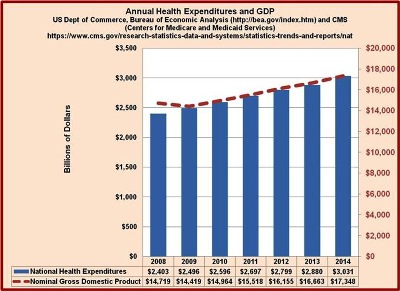
Gains in Domestic Production of Fossil Fuels were wiped out by rising Health Care Costs --- take a walk through the graphics…
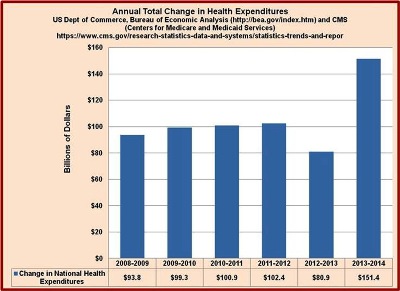
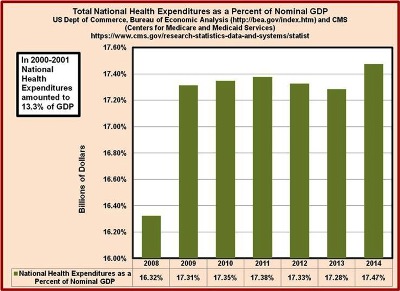
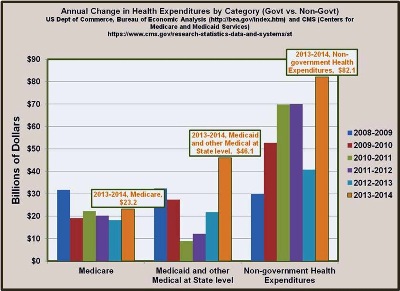
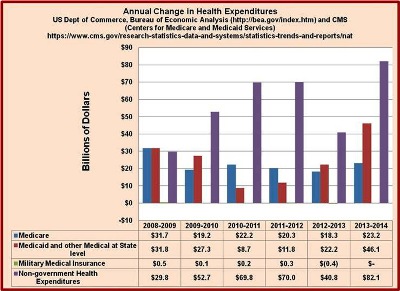
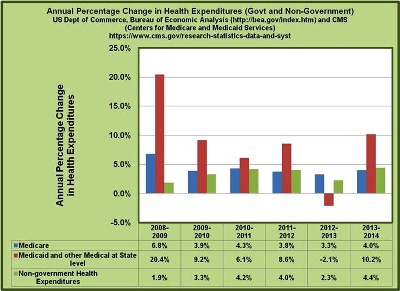
Speaking of Health Care Costs
Given the large increase in the productive population health care costs, don’t expect any improvement soon. It may be affordable to the less and non-productive members of the population, but it is not affordable to the more productive members of the population and is squeezing out spending in other sectors such as spending in durable consumer goods.
www.ncsl.org/research/health/health-insurance-premiums.aspx
The increased cost of health insurance is a central fact in any discussion of health policy and health delivery. Annual premiums edged beyond $17,500 for an average family. For those Americans who are fully-covered, these cost realities affect employers, both large and small, plus the "pocket-book impact" on ordinary families. Yet for 2016 among the roughly 85 percent of www.healthcare.gov consumers with premium tax credits, the average monthly net premium increased just $4, or 4 percent, from 2015 to 2016, according to an HHS report.
Our contacts in the employee benefits area tell us it has caused chaos for them. In recent years, the Department of Labor, Bureau of labor Statistics has reported that non-wage benefits such as employer paid health care insurance premiums have averaged about 30% of total labor compensation.
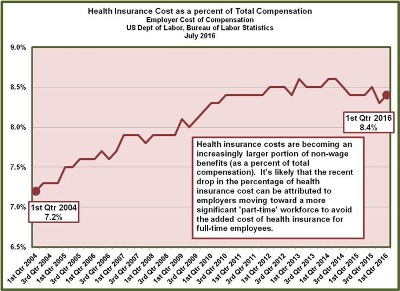
A shift toward higher health care costs for employers and a move to avoid paying for insurance by pushing employees to part-time has been manifesting itself.
One large nationwide retail firm recently shifted its labor force from a 70% full time-30% part time mix to a 30% full-time to 70% part-time mix. Such firms are already losing market shares to online shopping. The rising cost of health care insurance and the current rush to raise minimum wages have accelerated automation in the fast food market where many employees have traditionally began to acquire the basic skills for better jobs in later life.
Wrap-up
It seems to be the case that the dots cannot be connected if the policy makers do not know what the dots really are.
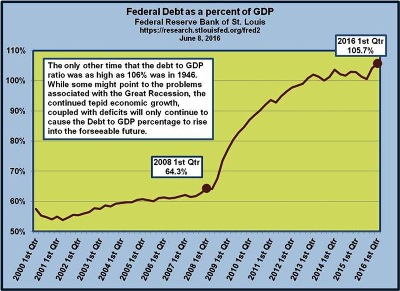
The ratio of the U.S. Total Public Debt to its Gross Domestic Product is approaching its highest peace time levels since just after the Second World War ended. The ‘my way or the highway’ and ruling by presidential edicts has been fine tuned by the existing administration in the White House. We hope that this is not the ‘Executive Standard’ moving forward. I wonder what Alexander Hamilton and the rest of the founding fathers would say about this if they were still around and kicking. King Louis XV of France just fifteen years or so before the French Revolution uttered those famous words, "Après moi le déluge" ("after me the flood"); a flood of blood as it turned out. In addition to the Divine Right of Kings, the French had over the years increased their national to debt to very high levels including a large portion of which was to help the American colonies of England win their freedom. Will those words of Louis XV once again be appropriate given the huge debt burdens being faced in the U.S. of A.? Just think of the mess when interest rates rise to more normal heights and the burden of the public and private sector debt becomes even more oppressive.
Estimating the burden of servicing the Federal Government’s debt
The current overall average rate of interest on the debt is 2.3% and the interest on the debt in the 2015 fiscal year (October 1, 2014 - September 30, 2015) was $402 billion.
The Total Public Debt is nearly twice the level it was in 2008. Considering the fact the overall average rate of interest on the debt is 2.3% (www.treasurydirect.gov/govt/rates/pd/avg/2016/2016_06.htmon the debt was $402 billion in 2015 FY (fiscal year) www.treasurydirect.gov/govt/reports/ir/ir_expense.htm), any move to drive up interest rates by the Federal Reserve (Federal Open Market Committee), will certainly drive up the interest paid on the debt in the future. Keep in mind that financing the debt is constantly adjusting as Treasury Securities mature and deficit spending continues.
Simply put: if the average interest goes from 2.3% to 4.6%, the interest paid on the debt will double to $800 billion annually. Keep in mind that this ignores ongoing deficits of $400 - 500 billion at current spending levels; and that the additional payments associated with the interest on the debt will be added to that as well.
When we couple just that portion of the public debt with the problems associated with a Social Security System which is already running deficits, a Medicare System which is also running deficits and will soon exhaust its trust fund, and a Medicaid System which has never been funded, these problems associated with the burgeoning debt will only worsen.
This all comes back to a very simple issue that we’ve addressed repeatedly in this newsletter - we need a much more robustly growing economy (3.4-3.5% annually for a period of five years) which will go a long way to drive the Labor Force Participation Rate back to its normal 66-67% level and put a dent in the federal deficit. To put this into perspective, prior to the current administration, every administration has experienced at least one year of 3.0%+ annual real growth rates, going back to well before the Great Depression.
www.econnewsletterjun162016.com/
Modified Okun’s Law
What about that GDP growth…make that the GDP Gap?
- Okun’s Law https://en.wikipedia.org/wiki/Okun%27s_law
- GDP Gap = Actual GDP - potential GDP
- Rule of thumb…for every 1% the unemployment rate is higher than natural rate, GDP (economic output gap) is 2% lower than where it would otherwise be.
Example:
- 2009 U3 Unemployment = 9.3%, which was 4.3% higher than full employment unemployment rate (5%, approximately)
- 4.3% X 2 = 8.6% (GDP Gap…GDP lower than where it should otherwise be)
- Real GDP in 2009 = $13,894 billion
- Real GDP Gap = $13,894 billion X 8.6% = $1,195 billion
Modified Okun's Law…reflecting the ‘pre-recession normal’ 66% Labor Force Participation Rate
- November 2015 - Current Population Survey (Household Summary) <BR>
- www.bls.gov/news.release/archives/empsit_12042015.pdf
- Civilian Nonininstitutional Population (CNP) = 251,747,000
- Civilian Labor Force (employed + unemployed) = 157,301,000
- Force Participation Rate = Labor Force / CNP = 62.5%
- Employed = 149,364,000
- Employment-Population Ratio = Employed / CNP = 59.3%
- Unemployed = 7,937,000
- U3 Unemployment Rate = Unemployed / Labor Force = 5.0%
- Not in the Labor Force = CNP - Labor Force = 94,446,000
- Modified for a 66% Labor Force Participation Rate LFPR (66.2% average from 2001-2008)
- Civilian Nonininstitutional Population (CNP) = 251,747,000
- Civilian Labor Force (employed + unemployed) = 157,301,000
At 66% Labor Force Participation Rate…
- 251,747,000 CNP X 66% LFPR = 166,153,000 Labor Force
- Employment is 149,364,000
- Unemployed = Labor Force [at 66% LFPR] 166,153,000 - Employed 149,364,000
- Unemployed [at 66% LFPR] = 16,789,000
- Unemployment Rate [at 66% LFPR] = 10.1%
- Full Employment = approximately 5%
- Modified Unemployment Rate = approximately 10%
- Real GDP in 2014 was $15,962 billion
- ’s Law GDP Gap (2 X 5% = 10%)
- GDP Gap = $1,596 billion
This is just a rough estimate based on an unemployment rate modified to fit a 66% LFPR.
