
Economic Newsletter for the New Millennium
June 16, 2016
For a downloadable version, click the following:
…a bit more compressed version of the PDF
May Labor Report: Cause for Concern? You bet!
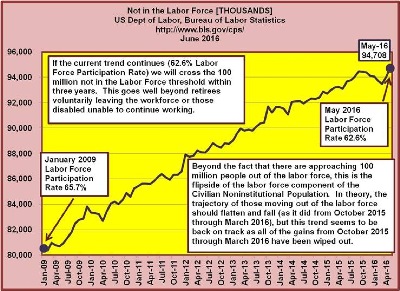
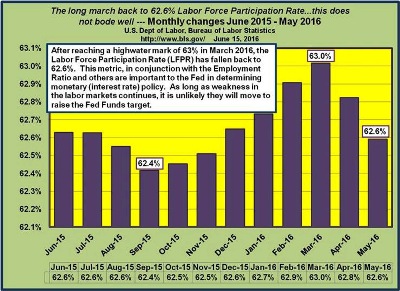
In the March 2016 Labor Report the Labor Force Participation Rate registered 63.0%, the highest since March 2014; by May it had fallen to 62.6%, the lowest since December 2015.
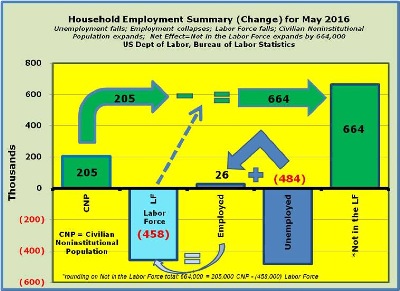
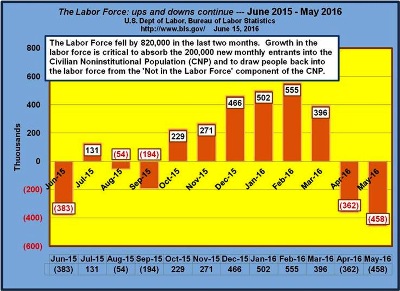
The Employment Situation Report for May 2016 was terrible, with the 664,000 leaving the labor force. The ‘Not in the Labor Force’ component is equal to the monthly change in the Civilian Noninstitutional Population (205,000) less the change in the labor force (+26,000 employed -458,000 unemployed).
*rounding on Not in the Labor Force total: CNP 205,000 - (26,000 Employed -458,000 Unemployed) = 664,000
www.bls.gov/news.release/archives/empsit_06032016.pdf
The Employment Situation for the month of May 2016 in Review
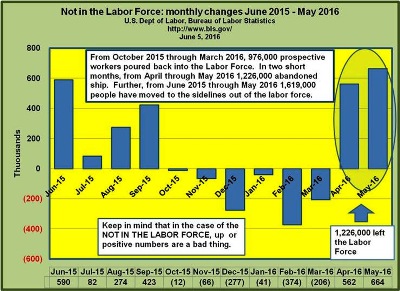
In the month of May 2016, the employment situation continued its spring swoon with 664,000 people leaving the labor force. Over the last two months, 1,226,000 people left the labor force. In the six months prior, from October 2015 through February 2016 976,000 were added to the labor force (leaving the Not in the Labor Force component of the Civilian Noninstitutional Population). The labor markets were looking positive for the first time in years and the bottom fell out yet again in April and May.
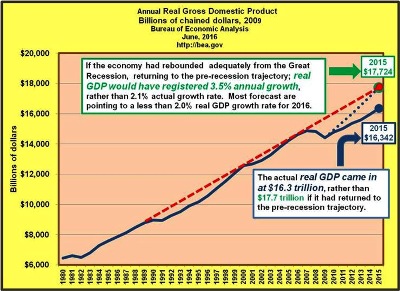
The net results of lethargic economic growth combined with a slack labor market is that we are probably around $1.5 trillion short on the real GDP side for 2015 and at least 9 million short on the workforce side based on a ‘normal’ Labor Force Participation Rate of 66% which was about the average from 2006 through 2009. Simply put, the economy is not growing at a fast enough pace to absorb the surplus labor.
Without the increased numbers of folks more fully participating in the job market, flat or lower wages are the norm. Why pay higher wages when there is excess capacity in the workforce? For that matter, as an employer what justification would you have raise wages in a situation where price increases spell doom in such a highly competitive sales environment? Keep in mind there are several million folks sitting on the sidelines waiting for an opportunity, any reason to jump back into the workplace.
Let’s also keep in mind that this is coupled with a less than robust, effective demand for your products in the first place? How can you have robust demand for products when you have several million people not working, who could be employed, but don’t have the financial means to purchase the products?
In conclusion, without substantial or at least adequate economic growth, there is no need to hire more people at any wage level. The irony here is that the Fed Reserve (the Federal Open Market Committee or the FOMC in particular) continues to discuss driving up the Fed Funds Rate (thus pressuring up at least short-term interest rates) and the Federal government continues to press for more regulations aimed at driving up the cost of doing business. Both the implied monetary (Fed) and actual fiscal policies (let’s not forget to point out the mad dash to implement executive orders in particular) only serve to increase uncertainty and burden the business sector. The thing to keep in mind is that the private sector is the engine for economic growth and by extension, jobs!
Next we will do a rundown of the components in the labor picture as presented in the Household Survey (Current Population Survey) which is conducted by the Census Bureau for the Bureau of Labor Statistics on a monthly basis.
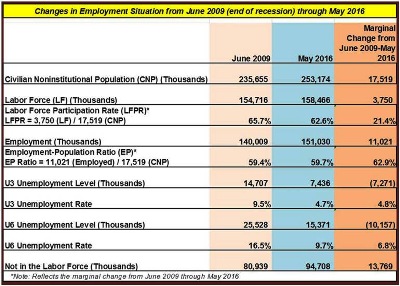
Looking first at the Civilian Noninstitutional Population, (CNP: includes the segment of the total population which is 16+ years of age that are not counted in the various institutional population measures such as the military, prisons, etc.) it grew by 205,000 in May, which is pretty much on par. Again, the CNP number is estimated, but typically ranges from 180,000 to 225,000 on a monthly basis. Keep in mind that there is no upper age limit on the CNP, so this captures retirees as well. The point is that with the CNP, unless there are at least 130,000 of the new entrants absorbed into the labor force (employed or unemployed), then the Labor Force Participation Rate falls.
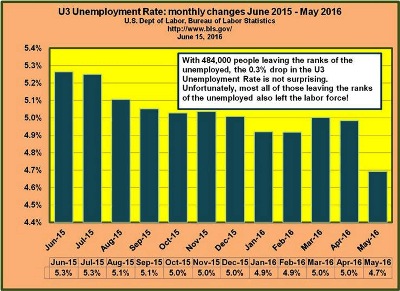
The Labor Force includes that portion of the CNP which is either employed or unemployed - but actively seeking employment (this constitutes the U3 or ‘official’ unemployment level). When the monthly Labor Force change is less than the Civilian Noninstitutional Population amount, then there is a net outflow from the Labor Force; conversely, when the number is greater than the CNP, as was the case in February 2016 with 555,000 being added to the Labor Force, then there is a net outflow from the ‘not in the labor force’ component of the CNP. In May 2016, 458,000 people left the Labor Force. While employment increased by 26,000, it was overwhelmed by 484,000 people leaving the ranks of the unemployed (no longer actively seeking employment). The point is that while the unemployed dropped by 484,000 they did not move into the ranks of the employed.
The Labor Force Participation Rate (LFPR) measures the relationship of the Labor Force divided by the Civilian Noninstitutional Population. Going back to prerecession levels (2000-2008) the Labor Force Participation Rate had been in the 66.0% range. After reaching a nearly 40 year low in September 2015 of 62.4%, the Labor Force Participation Rate rebounded to 63.0% in March (the highest since March 2014), but fell to 62.6% in May. Keeping in mind that the labor force is equal to those employed plus those unemployed actively seeking employment (U3 Unemployed), even sticky or rising unemployment are not necessarily bad things so long as they eventually move into the other side of the labor force - the employed.
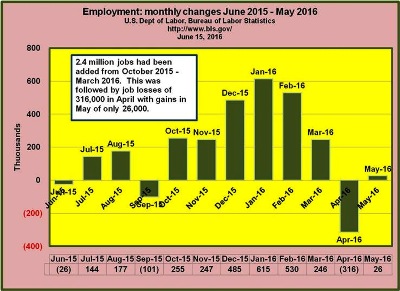
Employment grew by 26,000 in May 2016. When we reference the ‘Employment Situation’, this uses data drawn from the Current Population Survey. The Current Population Survey (CPS) and the Current Employment Statistics (CES) both measure changes in Employment. While the CPS is smaller in size than the CES (also referred to as the Payroll Survey), it covers a wider swath of the population than the latter.
Understanding the employment measures from the CPS and CES survey
www.bls.gov/opub/mlr/2006/02/art2full.pdf
Labor Force Statistics from the Current Population Survey (CPS)
The Current Population Survey (CPS) is a monthly survey of households conducted by the Bureau of Census for the Bureau of Labor Statistics. It provides a comprehensive body of data on the labor force, employment, unemployment, persons not in the labor force, hours of work, earnings, and other demographic and labor force characteristics. Current Population Survey, a sample of 60,000 households; data are collected by personal and telephone interviews. Basic labor force data are gathered monthly; data on special topics are gathered in periodic supplemental surveys.
CES or Current Employment Statistics www.bls.gov/ces/
Each month the Current Employment Statistics (CES) program surveys approximately 146,000 businesses and government agencies, representing approximately 623,000 individual worksites, in order to provide detailed industry data on employment, hours, and earnings of workers on nonfarm payrolls.
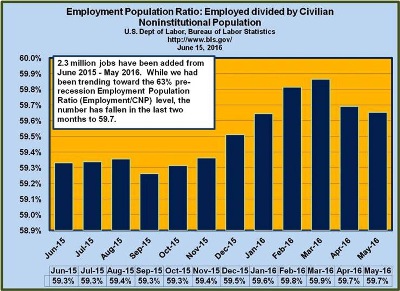
The Employment Population Ratio measures those Employed divided by the Civilian Noninstitutional Population (CNP). The significance of the ratio is that it provides insight into how many people are rowing the boat. For May 2016, the Employment Population Ratio had dropped to 59.6 from a nearly seven year high of 59.9% in March 2016.
The Unemployment level fell by 484,000 in May 2016. On the surface a fall in the U3 Unemployment might appear to be a positive sign; unfortunately, only 26,000 jobs were added, resulting in nearly all of them also leaving the labor force altogether.
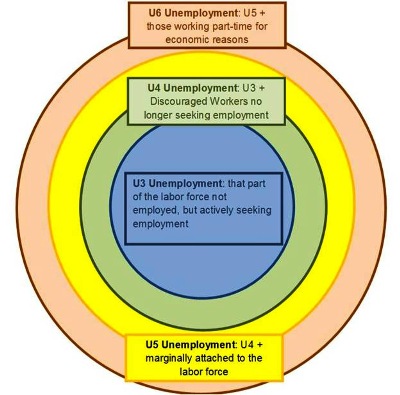
As an aside, the U6 measure of unemployment (underemployment) includes the U3 folks (not employed, but actively seeking employment) along with those who are discouraged (non U3 component of U4), marginally attached (non U4 component of U5), and those who are working part-time for economic reasons (non U5 component of U6). The U6 Unemployment number is not published, but the U6 Unemployment rate is www.bls.gov/news.release/empsit.t15.htm.
The U3 Unemployment Rate measures that portion of the labor force that is not employed but actively seeking employment divided by the total Labor Force (employed + unemployed). The U3 Unemployment Rate fell from 5.0% in April 2016 to 4.7% in May. Unfortunately, while the unemployed fell by 484,000, most of those people ended up leaving the labor force altogether (on a net basis). We seem to be going on a wild ride in the labor markets; we’ve gone from an ‘Encouraged Worker Effect’ in March where the unemployment rate ticked up due to more people actively seeking employment to a ‘Discouraged Worker Effect’ in May, where the unemployment rate dropped due to people leaving the labor force altogether. The shortage of job opportunities on the horizon tends to swell the not in the labor force component and the unemployment level and rate often fall as was absolutely the case in May.
The U6 Unemployment Rate is a better measure of the health of the labor markets because in addition to the U3 rate (not employed, actively seeking employment), it also takes into account those people who are discouraged, marginally attached, and those who are working part-time for economic reasons. While the U3 Unemployed was 7.4 million and the U3 Unemployment Rate was 4.7%, the U6 Unemployed level was 15.4 million and the U6 Unemployment Rate remained unchanged from April at 9.7%.
The ‘Not in the Labor Force’ component of the Civilian Noninstitutional Population (CNP) is simply the CNP - Labor Force (LF) [where the Labor Force is equal to Employed + U3 Unemployed]. The bad news over the last two months is that 1.2 million people left the Labor Force. So for May 2016 205,000 were added to the Civilian Noninstitutional Population, while the Labor Force fell by 458,000 [26,000 Employed -484,000 Unemployed] with a net increase in the ‘Not in the Labor Force’ of 644.000!
Changes in the Employment Situation since the end of the Recession - June 2006
Note: according the NBER - National Bureau of Economic Research www.nber.org/cycles.html, the recession went from December 2007 - June 2009 --- go figure
From our discussion regarding a modified version of Okun’s Law in our December 2015 Newsletter article: www.econnewsletter/dec152015.com/
2015 Volume Issue 15 (December 15, 2015)
Okun’s Law https://en.wikipedia.org/wiki/Okun%27s_law
GDP Gap = Actual GDP - potential GDP
Rule of thumb…for every 1% the unemployment rate is higher than natural rate, GDP (economic output) gap is 2% lower than where it would otherwise be. If unemployment rate is 5% higher than full/natural/high employment, then you simply multiply 5% X 2 = 10% (shortfall in GDP or economic growth)
Modified Okun's Law…66.2% Labor Force Participation Rate
In the following exercise, we are using a modified version of Okun’s Law to illustrate how the Labor Force Participation Rate can mask the unemployment rate and potential economic growth.
- May 2016 - Current Population Survey (Household Summary)
www.bls.gov/news.release/archives/empsit_06032016.pdf
- Civilian Nonininstitutional Population (CNP) = 253,174,000
- Civilian Labor Force (employed + unemployed) = 158,466,000
- Force Participation Rate = Labor Force / CNP = 62.6%
- Employed = 151,030,000
- Employment-Population Ratio = Employed / CNP = 59.7%
- Unemployed = 7,436,000
- U3 Unemployment Rate = Unemployed / Labor Force = 4.7%
- Not in the Labor Force = CNP - Labor Force = 94,708,000
Modified for a 66% Labor Force Participation Rate LFPR (66.2% average from 2001-2008)
- Civilian Nonininstitutional Population (CNP) = 253,174,000
- Civilian Labor Force (employed + unemployed) = 158,466,000
At 66.2%…
- 251,747,000 CNP X 66.2% LFPR = 167,601,000 Labor Force
- Employment is 151,030,000
- Unemployed = Labor Force [at 66.2% LFPR] 167,601,000 - Employed 151,030,000
- Unemployed [at 66.2% LFPR] = 16,571,000
- Unemployment Rate [at 66.2% LFPR] = 16,571 / 167,601 = 9.9%
- Full Employment = approximately 5%
- Modified Unemployment Rate = approximately 10%
- Real GDP in 2015 was $16,342 billion
Okun’s Law GDP Gap (2 X 5% = 9.9%)billion
GDP Gap = $1.6 trillion
This is just a rough estimate based on an unemployment rate modified to fit a 66.2% LFPR
The missing jobs: 16,571,000 (modified Unemployment Rate based on 66.2% LFLPR) - 7,436,000 actual U3 Unemployed = 9,135 in the not in the Labor Force who would otherwise be employed or at least be counted in the unemployed.
Again, that means we would be around 9 million short on the jobs front if the Labor Force Participation rate was in the 66% range.
