
2016 Volume Issue 4
Economic Newsletter for the New Millennium
For a downloadable version, click the following:
February 21, 2016
…a bit more compressed version of the PDF
The Gross Domestic Product (GDP) Gap: $1.1 trillion Real GDP; $1.6 trillion Nominal GDP
This article in our series on macroeconomic measurements speaks to the GDP gap in terms of our inability to rebound completely from the recession (December 2007 - June 2009) and linkage with the subsequent shortfall in employment
Revisiting the Employment Gap
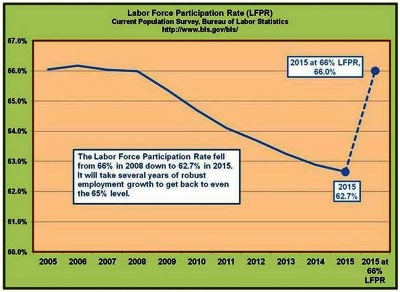
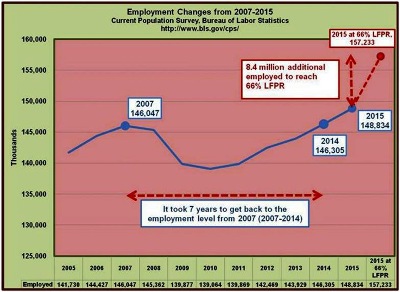
In our last related newsletter article, we cited a shortfall of 8.4 million jobs relating to the fall-off in the Labor Force Participation Rate, moving from 66.0% in 2008, to 62.7% in 2015. The labor force participation rate is the labor force (employed + unemployed actively seeking employment) divided by the Civilian Noninstitutional Population (16+ years of age, not in the military, incarcerated, or otherwise counted in institutions).
2015 (Annual numbers in thousands (000)) at 66.0% Labor Force Participation Rate
- Civilian Noninstitutional Population 250,801
- Using Labor Force Participation Rate = 66.0%
- Adjusted Labor Force = (250,801 X 66.0%)
- Adjusted Labor Force = 165,529
- Adjusted Labor Force 165,529 = [(Employed 148,834) + (Unemployed 8,296 + Adjusted Unemployed of 8,399)
Again, this would equate to an additional 8.4 million unemployed, doubling the unemployment rate to 10%. That 8.4 million missing from the labor force is what we refer to as the employment gap."
www.econnewsletterjan192016.com/
It’s one thing to point out the shortfall in employment picture, but it’s clear that increased hiring only occurs when there is economic growth to justify it.
Gross Domestic Product (GDP) Gap
Typically, what occurs following an economic downturn is that the real GDP returns to roughly the same trend line fairly quickly. This was clearly NOT the case following the last recession dating from December 2007 - June 2009, according to the NBER www.nber.org/cycles/cyclesmain.html).
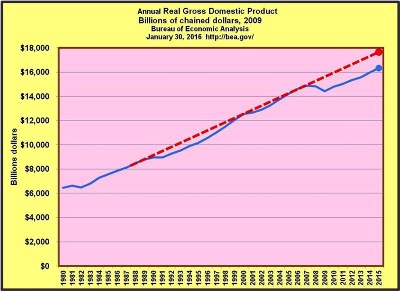
How large is the GDP Gap anyway?
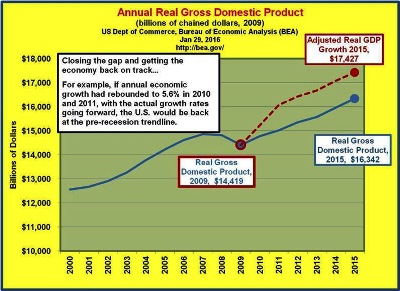
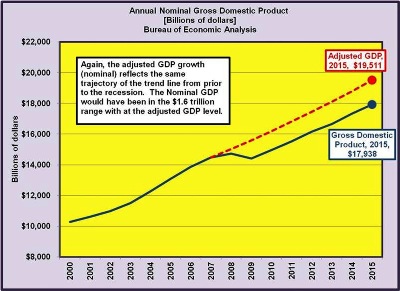
If the economy had not fallen into recession, and had grown at a modest 2% real GDP rate from 2008 and onward, this would have resulted in a fairly ‘normal’ trend line and the 2015 real GDP would be around $1.1 trillion higher than the actual level ($16.3 trillion actual versus $17.4 trillion projected).

In reality, the only way to get back to the previously mentioned trend line, would be for the economy to grow at a higher rate than 2% - 2.5% for a period of time. In the following scenario, we inserted a growth rate of 5.6% annually for the years 2010 and 2011 with the actual growth rates for 2012 through 2015. The idea here is to illustrate how important it is for the economy to grow at high enough rates to rebound from a recession.
Connecting the dots between the Employment Gap and the GDP Gap
Making the connection between economic growth and employment is a fairly easy concept to grasp, but there is a logical path to follow.
The first step in the process is to get a sense where nominal GDP (at market prices, or dollars in your pocket) would be at adjusting for a rebounding economy. The reason we now turn to nominal GDP is that when income, taxes, etc. are tabulated this takes place with nominal dollars.
Moving from GDP to National Income primarily involves removing depreciation from the mix.
On to the National Income Gap
When we drill down on National Income, again in nominal dollars, we found that data for 2015 was not yet available on the Bureau of Economic Analysis (BEA web site http://bea.gov/).
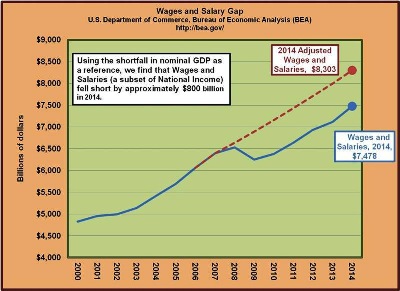
With that in mind, let’s take a look at national income and its component part, wages and salaries paid to labor.

Wage and Salary Gap; and Tax Gap
It’s clear that the shortfall in GDP and National Income point to a less than desirable level of employment. Simply put, the driver of (payroll) tax revenue including income tax, Social Security and Medicare is jobs. This is all very straightforward, but what has been missing in the dialog is the failure to recognize how much the employment gap, as illustrated by the lower labor force participation rate since 2008 highlights the reduced trajectory of the nation’s economic growth. Of course the lower economic growth, or GDP, translating into lower national income and wages, results in fewer payroll taxes being collected. The tax shortfall also equates with increased budgetary deficits adding to the debt.
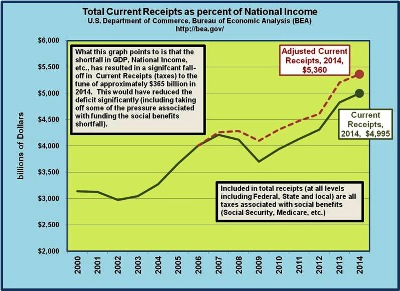
In short, the tie-in between the Employment Gap and the GDP/National Income Gap/Salary and Wage Gap, is that if the economy had rebounded to its previous trajectory, the labor force participation rate would most likely have recovered to something closer to pre-recession levels. As an aside, the added income would have brought significant revenues in terms of current receipts (taxes and contributions to social security and the like).
Wrap-up: the Gaps have had a Waterfall Effect
Less than ideal economic growth, as illustrated by the fact that the GDP has failed to return to its pre-recession trajectory, resulted in at least a trillion dollar shortfall in 2015 alone. In addition, since the economy didn’t rebound to its pre-recession levels, the cumulative effect (total shortfall from 2008-2015) probably amounts to a $5 trillion to $6 trillion shortfall in real GDP, with the nominal GDP shortfall closer to $10 trillion. Of course the waterfall effect is associated with the reduced labor force participation and the resultant sub-par employment numbers which translate into less tax revenue to support budgetary expenditures.
All the problems springing forth from the lack of sufficient economic growth has lead to increased budgetary deficits on the fiscal side as well as a monetary policy highlighted by several years of zero or near-zero Federal Funds rates.
Next up on macroeconomic measures: Price level changes…
